
Undernutrition and overnutrition are relevant Public Health problems in Colombia. We conducted a nutritional survey in the municipality of Tunja to quantify the problem in order to guide government interventions and serve as baseline for future evaluations. Schoolchildren were randomly selected among all private and public schools. Information on health status, socioeconomic and demographic characteristics of their families was collected using questionnaires, which also included the Colombian Household Food Security Scale. Anthropometric measurements of 1168 schoolchildren (5 to 19 years old) were obtained, analyzed with WHO Anthro-Plus, and associated with the mentioned variables by further statistic analysis. The overall prevalences of stunting, thinness and overweight were 11.3%, 1.7% and 17.6%, respectively. The highest prevalence of stunting was found in rural areas (23%). Children from rural areas, attending public schools and in female-headed households had higher risks of stunting. Overweight reached a percentage of 26.9% in children attending private schools, where the risk of overweight was double than in public ones. Within the studied households 48.6% had some level of food insecurity. In Tunja the prevalence of undernutrition was low, which could be an effect of government nutrition programs. However, it continues to be a problem in vulnerable population groups, mainly in rural areas. On the other hand, the rising prevalence of overweight, following the trend of countries in nutritional transition, is a new Public Health problem which should be addressed. Periodic controls are also needed to evaluate the impact of government nutrition programs on the nutritional status of the children.
Key words: Child nutrition disorders, Overweight, Colombia, Nutrition programs, Nutrition Survey
La malnutrición es un problema de Salud Pública relevante en Colombia. Realizamos una encuesta nutricional en el municipio de Tunja para cuantificar el problema, guiar intervenciones gubernamentales y servir de base a futuras evaluaciones. Para ello seleccionamos aleatoriamente escolares entre todas las escuelas públicas y privadas y recogimos información sobre su salud y características socioeconómicas y demográficas de sus hogares con cuestionarios, incluyendo la Escala Colombiana de Seguridad Alimentaria en el Hogar. Obtuvimos así medidas antropométricas de 1168 escolares (entre 5 y 19 años) que analizamos con WHO-AnthroPlus y relacionamos con las variables mencionadas mediante análisis estadístico. La prevalencias de bajo peso, delgadez y sobrepeso fueron 11,3%, 1,7% y 17,6%, respectivamente. La prevalencia más alta de bajo peso se encontró en áreas rurales (23%). Niños de áreas rurales, escuelas públicas y en hogares con mujeres como cabeza de familia presentaron mayor riesgo de bajo peso. Encontramos sobrepeso en el 26,9% de los niños en escuelas privadas, donde el riesgo de sobrepeso doblaba al de las públicas. De los hogares estudiados, un 48,6% presentaban inseguridad alimentaria. Encontramos por tanto una prevalencia baja de déficit nutricional, que podría ser resultado de los programas de nutrición gubernamentales. Sin embargo este problema continúa existiendo en poblaciones vulnerables, especialmente en zonas rurales. Por otro lado la creciente prevalencia de sobrepeso, siguiendo la tendencia de los países en transición nutricional, es un nuevo problema de Salud Pública a tratar. Para controlar la malnutrición es fundamental establecer controles periódicos para valorar el impacto de los programas nutricionales.
Palabras clave: Malnutrición, sobrepeso, Colombia, programas nutricionales, encuesta nutricional
Institute of Tropical Medicine and International Health, Charité-Universitätsmedizin Berlin. Germany.
Universidad Pedagógica y Tecnológica de Colombia Tunja- Boyacá.Colombia
Several studies suggest that Colombia is undergoing a process of nutritional transition. Following the economic and demographic development, epidemiologic changes affect the population. As a result, the percentage of children with chronic undernutrition has declined during the last decades and has been overcome by overweight. This process has already happened in other Latin American countries (1,2). The coexistence of undernutrition and overweight represents a double burden for the country’s weak healthcare system (3). The Colombian Family Welfare Institute (ICBF) has recently published the second National Survey of the Nutritional Situation in Colombia (ENSIN), conducted in 2010. The anthropometric measurements for school-aged children obtained in the ENSIN 2005 were reanalyzed according to WHO 2007 reference data. Their results show that while in 2005 the percentage of stunted and overweight children was exactly the same (13.9%), now the percentage of overweight has risen above the percentage of stunted children (17.5% and 10.0%, respectively) (4,5). Both 2005 and 2010 surveys show that stunting is more prevalent in male children, poor households and in the population of rural areas.
Boyacá is predominantly a rural department with 48% of its population living in rural areas (6). According to the ENSIN 2005, Boyacá department ranked second-highest in chronic undernutrition among children 5 to 9 years old and third among children 10 to 17 years. The recently published ENSIN 2010 shows that in Boyacá the percentage of stunted children has enormously declined in the last five years, from 21.9% in 2005 to 11.7% in 2010. This may be a result of the government nutrition interventions (4, 5).
Tunja, the capital and main municipality of Boyacá, has a population of 152,419 inhabitants. The 2005 census defined 77,093 (50.5%) of them as poor. In 2003, Castillo-Silva and Manrique-Abril (7) conducted a nutritional survey in Tunja among children between 0 and 10 years of poor households which showed that 15.8% of them were stunted. The lack of new available data at a local level to guide government interventions prompted this study. We conducted a nutrition survey to assess the overall nutritional status in school children in the municipality of Tunja. Our results will, furthermore, be a useful database for future studies. Socio-economic data were also assessed to obtain valuable information for the development of social and health policies.
Study population. The study was conducted among school children between 5 and 19 years old (1st. to 10th. school year). The sample size was calculated with OpenEpi (α=0.05, β=0.2, DEFF=3). We carried out a multistage cluster sampling: 5 public and 12 private educational institutions in Tunja were randomly selected from the 13 public and 63 private schools existing in the municipality, including primary and secondary schools, with probability proportional to their size. The proportion of children in public and private schools in our sample was so similar to the value for the municipality. In the second stage classes in these schools were randomly selected, stratified by school year. Approximately 3040 questionnaires were distributed to the students of 108 classes. The questionnaires, including an informed consent, were filled in by the parents. Only children returning a completed questionnaire were included in the study. The degree of response in public and private schools was similar (38.01% and 40.40%, respectively). During October and November 2010 we collected 1177 questionnaires and carried out the corresponding anthropometric measurements. Nine students were excluded due to missing values and errors in birth date. The anthropometric measurements of three students aged 19 were not included for the statistic analysis.
Questionnaires. Questions on the following topics were included:
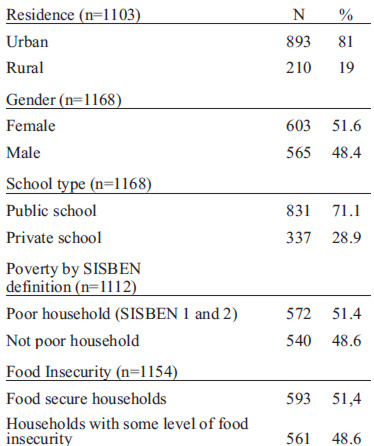
Demographic and socio-economic status. The parents were asked about the size of the household including the number of siblings living in it, who the head of the family is (main financial earner in the household), age of the mother, age of the father and whether they resided in a rural or urban setting. To determine the socioeconomic status we used the classification of children in the SISBEN (System for Selecting Beneficiaries of Social Programs), a survey conducted periodically by the Colombian government. This system classifies the households in six categories according to the wealth, taking into account availability and quality of housing and basic public services, possession of durable goods, human capital endowments and current income. Households in levels 1 and 2 are considered in poverty (8). We used this criterion in our study to define poor children. SISBEN data obtained in questionnaires were cross-checked with the SISBEN database to increase reliability. Children not included in the database (38.9%) were classified as not poor, as mainly poor children are inscribed to obtain social benefits.
Child’s medical history. Questions on recent diseases of the child were included, i.e. occurrence of respiratory infections, digestive infections or fever in the last two days.
Food security scale. The Colombian Household Food Security Scale (CHFFS) was used (9). The answers to this 12 item scale are coded as 0=no, 1=rarely, 2=sometimes, 3=always. The score is the sum of all the answers and is a value between 0 and 36 that represents the magnitude of the food insecurity in the household: the higher the score, the more pronounced the food insecurity. Households were classified as food secure (0), mildly food insecure (1-12), moderately food insecure (13-24) and severely food insecure (25-36).
Anthropometric measurement. The anthropometric measurements were carried out by trained research assistants in the schools. Height was measured with a kramer portable stadiometer with base, capacity 1 to 2 meter, and the weight with a Detecto medical scale (0-130 kg). Anthropometric measurements were analyzed using WHO AnthroPlus software. Weight for age Z-Scores (WAZ) for children 5 to 10 years old, as well as Height for age Z-Scores (HAZ) and Body Mass Index for age Z-Scores (BAZ) for children 5 to 18 years old were obtained according to WHO 2007 reference data. Children with a HAZ or WAZ less than –2 were defined as stunted or underweight, respectively, and as severely stunted or severely underweight if HAZ or WAZ were less than –3. For the evaluation of the BAZ we used the cut-offs recommended by the WHO (10): overweight as BAZ>+1SD, obesity as BAZ>+2SD, risk of thinness as BAZ <-1SD and thinness as BAZ<-2SD.
Statistics. All statistical analyses were done by IBM SPSS Statistics 19. Differences among subgroups were examined with Chi square test. Further associations between nutritional status and socioeconomic and demographic variables were examined using logistic regression, adjusting for cluster effect. Because of the correlation of some of the independent variables, the logistic regression was performed by using a forward selection model consisting of two (forward selected) blocs: the first bloc contained the variables we considered to be more general and therefore of higher interest: age and sex, residence, head of the family, private/public school, health status and poverty. The second bloc contained the remaining variables, in order to proof if they are able to enhance the rate of explained variance. Results were checked carefully by comparing them with univariate results and results of a logistic regression model which included all independent variables.
Ethical approval for the study was obtained by the Ethics Committee of the UPTC.
The final sample included 1168 students from 5 to 19 years old with the characteristics described in Table 1. The mean number of people in the household was 4.96, with a mean number of siblings per household of 2.92. Most of the households had a male as a head of the family (50.3%).
The prevalence of underweight, stunting and thinness were 4.4%, 11.3% and 1.7%, respectively. Overnutrition was overall more frequent: 17.6% of the children were overweight. The prevalence of underweight and thinness did not significantly differ for sex, age, character of the attended school and poverty level.
On the other hand the variability of stunting and overweight among children with different backgrounds was important (Tables 2 and 3). In rural areas 23% of the children were stunted, while 12.0% of them were overweight. In urban areas just 8.4% of the children were stunted and 19.0% were overweight. Among poor children (SISBEN levels 1 and 2) 15.4% were stunted and 14.4% overweight. Children in levels 3 to 6 or not included in the SISBEN we less often stunted (7.8%), but 20.0% of them were overweight. The mean height for 14 years old children rose with the SISBEN level from 151.2 cm in level 1 to 161.5 cm in SISBEN level 4. While in private schools just 4.5% of the children were stunted and 26.9% overweight, in public schools both values were similar (14.1% stunting and 13.9% overweight).
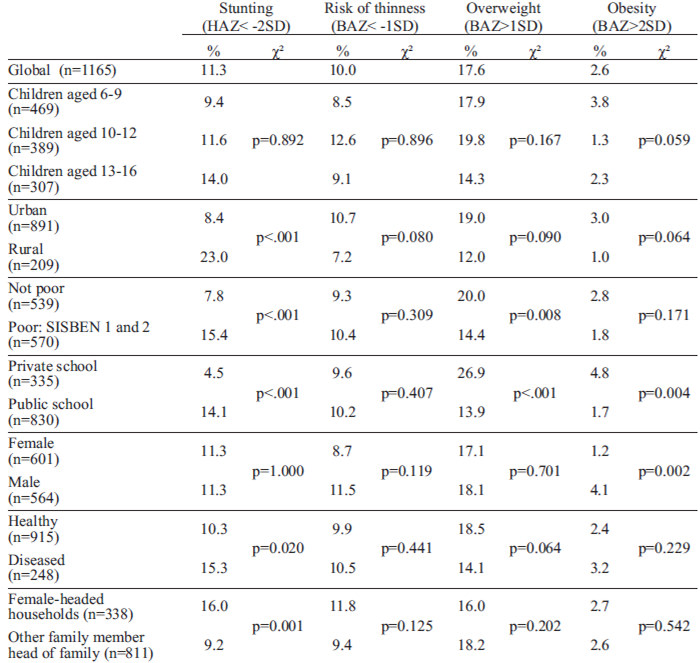
We did not find a difference between males and females for stunting in general, but severe stunting (1.6%) was significantly more frequent in males (p=0.035). Overweight was more frequent in females among children under 10, but in males among children aged 10 or more. Obesity was more frequent in males in all the age groups. Children living in larger households and children with a higher number of siblings were more likely to be stunted, while overweight occurred more frequently in children living in smaller households and in children with fewer siblings. In female-headed households the percentage of stunted children was significantly higher (16%, p=0.001), while in male-headed households the percentage of stunted children was significantly lower (8.8%, p=0.006) compared to households where both parents or other family members were heads of the family
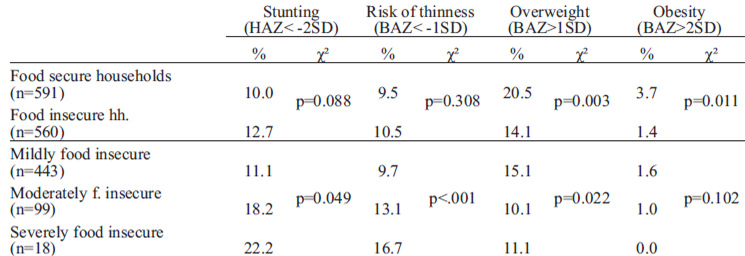
We found that 48.6% of the households were food insecure. The percentage of stunting increased with the degree of food insecurity, while overweight and obesity decreased (Table 3). The mean HAZ was related to the level of food security: its value was -0.7 (± 0.9) in food secure households against the -1.2 (± 0.8) in severely food insecure households. However, the association between food security and the undernutrition indicators underweight, stunting and thinness was not significant. Overnutrition was significantly higher in food secure households (p=0.003 for overweight; p=0.011 for obesity).
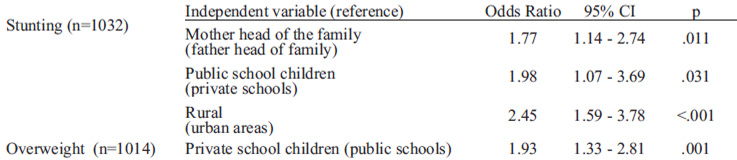
With logistic regression we found after adjustment that female-headed households, attendance of a public school and residence in a rural area were risk factors for stunting, while attendance of a private school was risk factor for overweight (Table 4). Children in rural areas had a 2.5 times higher risk to become stunted in comparison to urban children. Children attending public schools had two times higher risk to be stunted than children in private schools. Children living in female-headed households had almost double risk to be stunted than children in male-headed households. On the other hand, children in private schools had two times higher risk to be overweight than children from public schools.
Our results show that in the municipality of Tunja the nutritional profile of the school children is consistent with the national context: overweight has risen over undernutrition. The ENSIN 2010 results showed the same trend in Boyacá and nationwide, towards a nutritional transition, as it we expected in the Latin-American context. We didn’t have previous data for the municipality, but it is reasonable to think that the prevalence of malnutrition in Tunja municipality has declined during the last years as it has happened in the whole Boyacá department. This could be an effect of government interventions. Several nutrition programs have been developed in Colombia in the context of the National Food Security and Nutrition Policy (11). In Boyacá the government created the Food Plan for Learning (Plan Alimentario Para Aprender, PAPA) (12, 13). Since 2004 the plan provides supplementary food in schools of the department to improve the nutritional status of school children and their academic performance, and to reduce dropout. The plan is developed in those public schools where students have higher rates of poverty, and covers all students in these schools. However, chronic undernutrition continues to be a problem in vulnerable population groups. In our sample stunting was found to be more prevalent in poor and rural households, and in female-headed households, coinciding with higher food insecurity rates. This confirms the origin of the problem in social inequities. Nutrition programs should use the available information and create new databases to focus on the most vulnerable groups. More intensified actions to improve the situation in rural areas and female headed households should be considered. That would improve the effectiveness in the fight against chronic undernutrition.
The high percentage of school-aged children overweight in Tunja (17.6%) was a main finding in our study. In private schools more than a fourth of the children were overweight. Overnutrition was mainly related with a higher socio-economic status. However, the prevalence was also high in public schools (13.9%). These figures show that overweight is a new public health problem in Tunja. It is therefore imperative to develop measures to curb this growing trend. Measures to increase physical activity among the scholars and an intensive nutritional education would be advisable. These measures should be implemented in private educational institutions too.
For the development of the nutrition interventions the experience in countries more advanced in the nutritional transition, such as Chile or Brazil, should not be overlooked. In 2001, Uauy et al. warned about the potential of the supplementary feeding programs to increase obesity trends, as well as the difficulties that these programs present to eradicate undernutrition (1). To overcome these obstacles they recommended a better targeting of program beneficiaries and a careful selection of the supplementary food.
A better targeting in nutrition interventions in Tunja could be achieved by expanding the coverage of the SISBEN. In our study SISBEN level was associated with nutritional indicators and food insecurity, but it was not a powerful tool because only 38% of the children in our sample were registered in SISBEN. The increase in SISBEN coverage would mean a considerable economic investment and cannot be easily carried out, but it would be a step towards a better allocation of the resources for social policies.
Food security scales can be a good tool to assess the socio-economic situation of the household as a risk factor for malnutrition. Many studies have addressed this issue in order to obtain data for guiding government interventions. Lorenzana and Sanjur (14, 15) adapted the hunger index developed in the US by the Food Security Measurement Project (16-19) to the Spanish language and validated it in poor Venezuelan households. Álvarez et al. (20) validated the new scale for Colombian households in Antioquia department and named it the Colombian Household Food Security Scale (CHFFS). In subsequent studies carried out in Antioquia in households of children participating in the government nutrition program the level of food insecurity was 51.7% (9, 21, 22). In all these studies the CHFSS has proven to be a useful tool at a population level. Isanaka et al. (23) conducted a survey in Bogotá among low-middle income households using a 16 item questionnaire and demonstrated a prevalence of food insecurity around 76% in this urban population. The Latin-American and Caribbean household food security scale (ELCSA) has also been validated for Colombia in several studies. Lamentably, all these studies are hardly comparable as they have used different scales. Although the CHFSS has been used several times, this has been in different population subgroups, with a different time frame and with several evaluation criteria. To obtain a comparable food security assessment tool it would be necessary to agree on a standardized scale used in a common time frame, and the use of a unified classification of the degree of food insecurity for the interpretation of the results (24). The ENSIN 2010 has developed a new tool by combining the CHFSS with the ELCSA. Further analyses have to determine which scale has better association to socioeconomic characteristics and nutritional status.
It is essential to establish appropriate evaluations to tailor the nutrition programs to the real needs of the population. Monitoring the nutritional status of the school children with regular nutritional surveys will allow a better targeting of undernutrition interventions, as well as the control of overweight and obesity for the prevention of its dangerous consequences. In our study the degree of response in public and private schools was around 40%, which is comparable with other studies. Nevertheless, our results are only cross-sectional data which can serve as baseline for future evaluations of the impact of government nutrition programs on the nutritional status of the children. The strength of the study is the comprehensive demonstration of variations in body measurements especially in association to the food security scale. The data are comparable with the nationwide ENSIN 2010. The simplicity of the methodology and the accessibility of the children in the educational institutions provide with little invest an important contribution for the decision making. This could be applicable in many other similar settings.
We would like to acknowledge the collaborating institutions in Tunja: the municipal secretary of education; the SISBEN secretary; and all the participant educational institutions’ students and workers. Thanks to the ICBF for the information about the ENSIN 2010.
We would like to thank the German Academic Exchange Service (DAAD) and “La Caixa” Foundation for the studentship that allowed this research.
Recibido: 14-03-2012
Aceptado: 17-07-2012