
The glycaemic index (GI) is a physiological measure of a food’s potential to increase postprandial blood glucose, as compared to the effect produced by food taken as reference, such as glucose or white bread. Currently researchers and consumers are interested in low GI foods, since their consumption is associated with better weight control and reduced risk of incidence of chronic diseases, like diabetes. In the present study, the GI value for peach palm cooked fruit, peach palm chips and pitahaya pulp was estimated. The methodology established by the FAO / WHO for determining the GI of food was used. A total of 12 healthy, non-smoking volunteers were selected and they ingested the fore mentioned foods on different occasions, in 25 g portions of available carbohydrates, after 12-14h overnight fast. Blood glucose levels were measured in 30 min intervals up to 120 min after ingestion. Average GI value was 48 ± 11 for the pitahaya pulp and 35 ± 6 for the peach palm cooked fruit, which may be classified as low glyceamic index foods. The GI of peach palm chips was 60 ± 7, corresponding to a food with a moderate GI. The processing for producing the chips caused an increase in the GI value when compared to the cooked fruit, probably because the stages of milling, moulding and baking promote availability of starch during hydrolysis by the digestive enzymes.
Key words: Glycaemic index, peach palm, pitahaya, blood glucose, functional foods
El índice glicémico (GI) es una medida fisiológica del potencial de un alimento para incrementar la glucosa sanguínea, en comparación con el efecto producido por un alimento de referencia, tal como la glucosa o el pan blanco. Los investigadores y consumidores tienen interés en los alimentos de bajo GI, dado que su consumo está asociado con un mejor control del peso corporal y una reducción del riesgo de enfermedades crónicas como la diabetes. En el presente estudio se determinó el valor de GI del fruto cocido de pejibaye, de los chips horneados de pejibaye y de la pulpa de pitahaya. Se seleccionaron 12 voluntarios, aparentemente sanos, no fumadores, los cuales consumieron los alimentos evaluados y el alimento de referencia (pan blanco), en una porción que contuviera 25 g de carbohidratos disponibles, después de un período de ayuno de 12-14 h. Los niveles de glucosa en sangre fueron medidos en intervalos de 30 min hasta 120 min después de la ingesta. Se obtuvo un valor promedio de GI de 48 ± 11 para la pitahaya y de 35 ± 6 para el pejibaye cocido, los cuales pueden ser clasificados como alimentos de bajo índice glicémico. El valor de GI de los chips de pejibaye fue de 60 ± 7, lo que corresponde a un alimento de GI moderado. Se encontró que el procesamiento para la obtención de los chips produjo un aumento en el valor del GI, en comparación con el obtenido para la fruta cocida, probablemente debido a que las etapas de molienda, moldeo y horneo favorecen la disponibilidad del almidón para su hidrólisis por parte de las enzimas digestivas.
Palabras clave: Indice glicémico, pejibaye pitahaya, glucosa sanguínea, alimentos funcionales.
Escuela de Medicina, Universidad de Costa Rica. Centro Nacional de Ciencia y Tecnología de Alimentos (CITA). Universidad de Costa Rica. Instituto Costarricense de Investigación y Enseñanza en Nutrición y Salud (INCIENSA). San José, Costa Rica
The glycaemic index (GI) is a concept that was introduced in 1981 by Jenkins et al. in order to quantify the glycaemic response to carbohydrates in different foods (1). Recent studies show that consumption of high GI foods is associated with a greater risk of type 2 diabetes mellitus (2), cardiovascular disease (3), and certain cancers (4). In contrast, the inclusion of low GI foods in a diet can help control blood glucose (5). Low GI foods, by virtue of the slow digestion and absorption of their carbohydrates, produce a more gradual rise in blood sugar and insulin levels, and are increasingly associated with health benefits (6). In Costa Rica, there is a variety of fruits which have recently attracted the interest of national and international markets, being widely studied in order to identify different nutritional and functional components which provide health benefits, such as the antioxidant activity in the case of the pitahaya (Hylocereus spp.) and the fibre and betacarotene contents of peach palm fruits (Bactris gasipaes) (7-9).
Currently, there is little information about GI values for tropical fruits, such as banana, pineapple, lychee papaya, mango, breadfruit, and sapote (5). There is no information regarding the effects that physicochemical changes occurring during processing could have on the GI values of tropical fruits, as is the case in the production of peach palm chips. The main objective was to estimate the GI of peach palm (Bactris gasipaes) cooked fruits, peach palm baked chips and pitahaya (Hylocereus spp.) raw pulp, and to establish the changes on the GI value during processing of the peach palm fruit.
Selection of subjects: 12 healthy, nonsmoking, normal weight, male and female volunteers, aged between 18 and 51 years, were selected (Table 1). The volunteers showed no family history of diabetes or food allergies, were not taking medication, and were not following any weight loss diet. All volunteers were instructed to not perform strenuous exercise, drink alcohol, or eat an unusual amount of food the night before the study. None of the subjects were taking medication. According to Aston et al. (10) 25 g portions of available carbohydrates of each food were consumed with 300 mL water after a 12-14h overnight fast. The subjects were requested to consume the foods within 10 min. A single venous blood sample was taken in the fasted state and at 30, 60, 90 and 120 min after eating the food. Each sample was analysed in duplicate according to the FAO / WHO (11) protocol. The study was approved by the institutional Bioethics Committee involved (University of Costa Rica, San José, Costa Rica, Project No. 422-A7-049) and subjects gave written, informed consent.
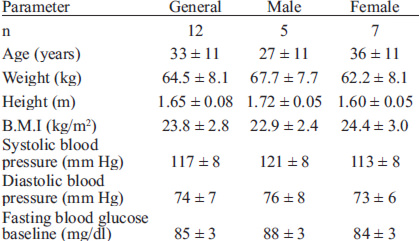
Figure 1 summarizes the process flow for preparing each studied food.
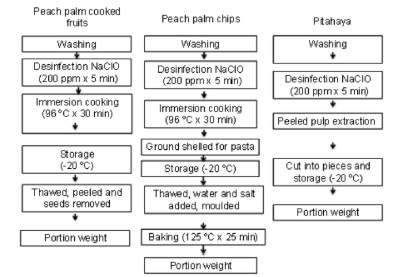
Peach palm cooked fruits: Mature peach palm fruits (red-orange peel) were harvested in Tucurrique (Jiménez, Cartago province, at an altitude of 760 m.a.s.l). They were washed with water, and disinfected with sodium hypochlorite (200 ppm) for 5 min. They were cooked by immersion in boiling water (96 º C for 30 min) and stored frozen (-20 º C) until use. For consumption, the peach palm fruits were thawed at room temperature, peeled, and deseeded.
Peach palm chips: Peach palm whole cooked fruits were ground with skin attached to obtain a paste that was stored at -20 º C until use. Dough thawed at room temperature and was mixed with water (6%) and salt (1.2%) before being moulded into slices which were 2 mm thick and 6 cm in diameter. The chips were baked (oven Dictate, 65X4516 HF model) at 125 º C for 25 min to obtain a final product weight of approximately 3.6 g per slice or chip.
Pitahaya pulp: The fruit was washed with water and disinfected with sodium hypochlorite (200 ppm) for 5 min. The fruit was peeled and then the pulp was removed, chopped, and stored frozen (-20 ° C) until further use. The volunteers were allowed to add sucralose (Splenda ®) ad libitum.
Control (white bread): As a reference a sliced white wheat bread was used (Breddy ® brand). The crusts were removed; the bread was packed in plastic bags and stored at 0 °C until use.
Physicochemical composition of pitahaya pulp, and peach palm cooked fruits and chips, was determined using standard AOAC methods (12) for moisture no. 920.151 and no. 925.09; for ash no. 940.26, no. 940.23 and no. 923.03; for protein no. 920.187, no. 920.152 and no. 979.09; for total dietary fibre no. 985.29; for total titratable acidity no. 942.15 expressed as citric acid equivalent. Fat content was determined using the Soxhlet method with acid hydrolysis and ether extraction (13). Available carbohydrate content was determined by calculation, from moisture, ash, protein, fat, dietary fibre and total titratable acidity analyses.
Analysis of blood glucose. Blood glucose was determined through the glucose oxidase technique using a spectrophotometer (Thermo Spectronic brand model Genesys 20), glucose oxidase reagent and glucose standard (TicoLab, Costa Rica). Once the blood sample was taken, it was centrifuged (IEC Centra ® CL2), then the serum was frozen at -4 ºC, and the procedure for the determination of glucose was followed (14).
The blood glucose concentration was calculated using the following equation:
Glucose (mg/dl) = A Sample x C Standard / A Standard
Eq. 1
Where:
A: Absorbance
C: Concentration (mg/dl)
The area under the curve (AUC) was calculated using the double integration technique, where X1 represents the point Xi at which it begins to integrate, X2 represents the point Xi where it integrates ends, f(y, x) represents the density function defined on the interval X [X1, X2] and Y [Y1, Y2]. All the AUC's below the baseline were excluded from calculations. The GI value was calculated as the value of AUC’s increase of glycaemia for the test food in each individual, divided by the value of AUC’s increase of glycaemia for the reference food for each individual multiplied by 100, and then multiplies by 0.7 to obtain the GI value with glucose as the reference food (5). The GI was expressed as means ± S.E. for the individuals participating in the study for each food (n = 12 for bread and n = 8 for pitahaya pulp, and peach palm cooked fruits and chips). An analysis of variance was performed to compare the blood glucose concentration significance between times (0, 30, 60, 90, 120 min) for each food. Significant differences among the AUC's were assessed with ANOVA model for the peach palm and peach palm chips. Differences were considered statistically significant when p < 0.05.
All statistical analyses were performed with the SAS program, version 9.2 (SAS Institute, Cary, NC).
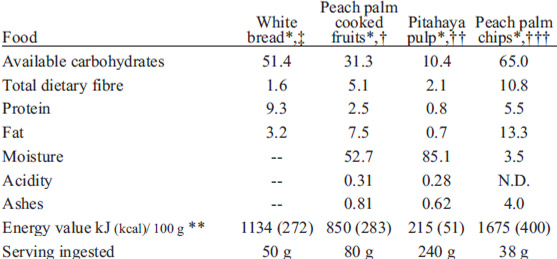
The nutritional characterization of sample foods is described in Table 2. Food composition among food products is very different, with high amounts of available carbohydrates in peach palm chips and white bread. Peach palm chips are also higher in dietary fibre and fat in comparison to the other test foods.
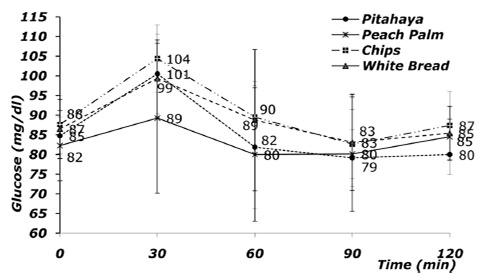
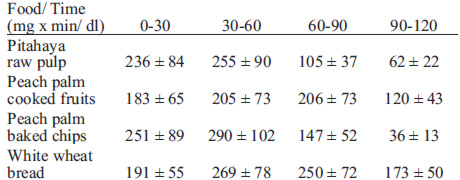
Peach palm cooked fruits, pitahaya pulp, peach palm baked chips, and white bread presented the highest glycaemia average increase in the first 30 min of the study (Figure 2). Similar results were obtained after ingestion of Basmati rice, oatmeal gruel, breakfast cereal (10), barley kernels (6) and potatoes (15). The intake of peach palm baked chips was associated with higher average blood glucose (104 ± 9 mg/dl), followed by pitahaya pulp (101 ± 10 mg/dl), and peach palm cooked fruits (89 ± 19 mg/dl), while consumption of white bread resulted in 99 ± 10 mg/dl. Measurements at 90 min after ingestion of peach palm baked chips, pitahaya pulp and white bread, showed a decrease in average blood glucose to 83 ± 9 mg/dl, 79 ± 7 mg/dl and 83 ± 12 mg/dl, respectively. In the case of peach palm cooked fruits, the blood glucose concentration reached a minimum value of 80 ± 17 mg/dl, constant from 60 to 90 min. After eating peach palm chips and pitahaya pulp the average blood glucose value was significantly different (p < 0.05) only at minute 30, when compared to other periods for the same food. Bread consumption showed significant differences (p < 0.05) at 30 min, compared with readings taken at 90 and 120 min. After 120 min, the estimated blood glucose after the ingestion of peach palm did not show significant differences (p > 0.05).
When analyzing the average values for each food AUC, both periods at 0-30 and 30-60 min, showed the highest value for peach palm chips (251 ± 89 and 290 ± 102), min 60 to 120 showed the largest value for the white bread (147 ± 52 and 173 ± 50) (Table 3).
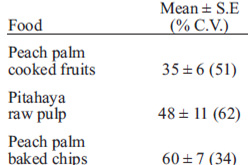
The estimated GI values reported in Table 4 show that peach palm cooked fruit had the lowest GI value (35 ± 6), followed by pitahaya pulp (48 ± 11); peach palm chips reported the highest value (60 ± 7). In terms of variability, data variation coefficients for GI were higher for the pitahaya pulp, peach palm chips and peach palm cooked fruits. When ANOVA was applied to the test foods there were no significant differences (p > 0.05) for GI estimated values. However, the same analysis applied for comparing statistical significance between the chips of peach palm and peach palm fruits showed significant differences (p < 0.05) in the glycaemic response.
Peach palm and pitahaya fruits presented a favourable glycaemic response, ranking as foods with a low GI; for peach palm baked chips, this value was higher, therefore, it can be classified as a food with moderate GI (16). These results show that peach palm has a value similar to those presented by legumes, such as red lentils (GI=29), chickpeas (GI=36) and beans (GI=48), and lower than some values reported for cereals, such as barley (GI=68) and some varieties of rice (GI=64). The pitahaya has a value similar to that reported for other fruits, such as bananas (GI=52), plums (GI=39) and oranges (GI=42). While the peach palm chips have a higher mean value compared to Mexican tortillas (GI=52) and wheat tortillas (GI=30), and they are lower than other products such as potato chips (GI=75) and corn chips (GI=63) (5). The variability of the GI values in the data obtained (Table 4) can be ex-plained in terms of differences between subjects and the methodology employed. Van-Camp (17) noted that the methodological factor is a major component of variation, even more so than real differences between foods. These variations include the use of venous instead of capillary blood and the methodology used for calculating the AUC value (18). However, it is important to note that in the present study the maximum value of estimated standard error was 11 for pitahaya’s GI, which is lower than the 15 that according to Atkinson et al. (19) is related to high variability in the data. Moreover, Vega-Lopez et al. (20) noted in a study of 23 healthy subjects that the use of bread as reference food can contribute to the variability of results, compared with the use of glucose solutions. However, studies using white bread as reference are more common, in comparison with those that use glucose as standard (5).
Food factors such as food form, particle size, processing, preparation and cooking methods, type of sugars and starch structure, the presence of other macronutrients and anti-nutrients, and the ripeness of the raw material may affect the GI value (10, 21). An important effect attributable to results associated with a low GI in peach palm fruits could be the storage temperature changes. Tahvonen et al. (15) found a lower GI value for cooked potatoes, which were cooled and reheated in contrast with freshly prepared product. There is scientific evidence that explains the significant differences found between the GI of peach palm and peach palm baked chips. The effects of processing of other foods, such as potatoes, is well established in terms of increased availability of starch, increased digestibility related to gelatinization when applying moist heat, and chemical and physical changes in the structures of starch which make it more readily available for amylase, especially due to the different temperatures used in processing (17,22). Schakel et al. (16) suggest that particle size reduction by grinding exposes the starch to digestive enzymes, increasing the GI, as is the case when preparing peach palm chips.
Another explanation consistent with Garsetti et al. (23) is that the preparation of peach palm chips requires adding water to facilitate the moulding stage of the paste and, thereby, increases the availability of water, which could favour the swelling of starch granules and gelatinization during the subsequent baking. It is also important to note that peach palm chips contain a higher amount of fibre (Table 2). The fibre in foods provides bulk to gastrointestinal tract contents, and slows transit time of matter through the tract (11). Soluble fibres also decrease the rate of starch digestion by pancreatic amylase in vivo, probably by delaying the interaction between enzymes and substrate (10). With regards to legumes, such as peas, beans, chickpeas and lentils, the fibre content has been reported between 14.05% and 24.08% (24), foods that are known for their low GI, with values between 22 and 42 (5). The fibre value for peach palm cooked fruits corresponds on average to 5.1 g/100 g and 10.8 g/100 g for peach palm baked chips (Table 2), a component that has an important effect when estimating the product’s GI values.
The fat content of peach palm cooked fruits in our study was approximately 7.5 g/100 g (Table 2) and it is another factor that reduces the glycaemic response (16), as it delays gastric emptying. Crowe et al. (25) performed an in vitro study of the effect of lipids on the enzymatic breakdown of starch using mixtures of potato amylose and amylopectin, suggesting the possibility that interactions between starch and fatty acids in the digestive tract could contribute to the formation of resistant starch. A similar effect could occur in the peach palm fruit, explaining the observed low GI value in peach palm cooked fruits and moderate for peach palm chips.
According to the results, the average GI value for the peach palm cooked fruit was found to be 35 ± 6, 48 ± 11 for pitahaya pulp and 60 ± 7 for peach palm baked chips. These products can be classified as low-GI foods for the first two and as moderate GI foods for the third.
It was demonstrated that the process for producing the peach palm chips causes an increase in the GI value when compared to the cooked fruits, probably because the stages of moulding and baking promote the availability of starch for hydrolysis by digestive enzymes.
The intake of peach palm and pitahaya can be considered favourable to consumers who require introducing low GI foods into their diet, and it is also a good choice for healthy eating habits in view of the contribution of bioactive compounds, such as carotenoids for peach palm and betacyanins for pitahaya. Moreover, the baked peach palm chips with a moderate GI value can be a good alternative as an occasional snack, managing to incorporate important components in the diet, such as fibre, monounsaturated fats and carotenoids. For future research, it would be important to assess the intake of cooked peach palm and pitahaya which has not been previously frozen or stored, in order to evaluate the effects of freezing on the GI value.
This research project was funded by PAVUC FP6-INCO project DEV-2, contract 015279, and the Vicerrectoría de Investigación from the University of Costa Rica (project no. 422-A7-049).
Recibido: 15-06-2012
Aceptado: 04-10-2012