
Childhood obesity is a serious public health problem in Mexico. In this study, childhoodspecific dietary patterns and their relationship with overweight-obesity prevalence, nutrient profiles and types of foods consumed were studied. A descriptive cross-sectional study of 724 randomly selected schoolchildren between 9 to 12 years old from Nayarit State, Mexico was performed. Data on anthropometric characteristics and food intake were recorded. Seven dietary patterns and three specific diets were identified by multivariate analysis. A dietary pattern characterized by high legume, snack and low beverage intake was negatively associated with weight and body mass index. The overall overweight and obesity prevalence was 20.2% and 20.6%, respectively. Diet type significantly influenced (p<0.05) protein, carbohydrates and fat intake but did not show correlation with the overweightobesity status. Simple sugars, candies, pastries and sweetened beverages appeared in all dietary patterns. Dietary patterns in countries with a wide gastronomic diversity should be considered to design preventive nutrition intervention programs.
Key words: Nutrition, obesity, schoolchildren, energy Intake, food habits
La obesidad infantil es un problema de salud pública en México. En este trabajo, se estudiaron los patrones dietéticos de escolares mexicanos y su relación con la prevalencia de sobrepeso-obesidad, el perfil de nutrientes y los principales grupos de alimentos consumidos. Se llevó a cabo un estudio transversal descriptivo donde participaron 724 escolares seleccionados al azar de entre 9 a 12 años del Estado de Nayarit, México evaluándose las características antropométricas y la ingesta de alimentos. Siete patrones dietéticos y tres dietas específicas fueron identificados mediante análisis multivariado. Un patrón de dieta caracterizada por una alta ingesta de legumbres y aperitivos junto con una baja ingesta de bebidas azucaradas se asoció negativamente con el peso e índice de masa corporal. La prevalencia de sobrepeso y obesidad fue del 20.2 y 20.6%, respectivamente. El tipo de dieta influyó significativamente (p<0.05) en la ingesta de proteínas, hidratos de carbono y el consumo de grasas, pero no mostró correlación con la condición de sobrepeso-obesidad. Los azúcares simples, dulces, postres y bebidas endulzadas aparecieron en todos los patrones dietéticos. Los patrones dietéticos en los países con una gran diversidad gastronómica podrían ser considerados de interés para diseñar programas de intervención nutricional preventiva.
Palabras clave: Alimentación, obesidad, escolares, ingesta de energía, hábitos alimenticios
Instituto Tecnológico de Tepic, Laboratorio Integral de Investigación en Alimentos, División de Estudios de Posgrado. Nayarit México. Programa de Posgrado en Alimentos del Centro de la República, Facultad de Química, Universidad Autónoma de Querétaro. Querétaro México. Food for Health Science Centre.Lund University. MediconVillage.
Mexico is among the twenty countries with the highest overweight and obesity prevalence in the world. At least 69.3% of Mexican adults are overweight, and 27.2% are obese (1). This problem also occurs in the Mexican childhood population. Overweight and obesity prevalence in school-aged Mexican children increased from 26.9% to 34.4% during the 1999 – 2012 period and 25% of children are currently overweight(2). The rapid increase in the prevalence of overweight and obesity has prompted many explanations, including genetic predisposition, altered energy requirements, endocrine disruptors, and social, and economic factors (3). In this sense, it is clear that diet plays an important role in the development of this disorder. Traditionally, the Mexican diet was based on corn, beans, and chili peppers, which are cooked in different typical dishes, depending on the region, but they have been increasingly replaced by ready to eat meals, fast foods, as well as, commercial carbonated and sugar sweetened beverages (4). Probably, a combination of lower real prices of food, changes in relative prices of different types of food and increased availability of highly processed, energydense, micronutrient-poor foods is responsible for such a drastic dietary change (5). In fact, Mexican schoolchildren have a high intake of fat, sugar (sucrose and fructose), soft drinks, and processed foods (6). The dietary patterns followed by preteen children had influence in their nutritional health not only during childhood, but also; during their teen years, as well as, in adulthood. Few studies have examined the association between dietary patterns and non-communicable diseases in the Mexican school population, and nowadays; is highly demonstrated that diets high in simple sugars may increase the risk of insulin resistance in children and adolescents (7). On the other hand, diastolic blood pressure, glucose, and triglycerides concentrations have been positively associated with the intake of soft drinks/sweetened beverages, and with high-fat dairy intake (6). However, these studies were focused mainly in the central area of Mexico and due to the extensive culinary diversity in the country, complementary studies in different regions are needed. Information about the relationship between dietary patterns, nutritional profile, and body mass index can be used to plan an efficient nutritional intervention to prepare dietary guidelines for children. The objective of this work was to identify the overall dietary patterns in the schoolchildren population (nine to twelve years old) in Nayarit State, and to determine the relationship between those dietary patterns, obesity, nutritional profile, and types of foods consumed.
Public Education Services of Nayarit State (SEPEN), case report form and informed consent form approved the protocol of this descriptive cross-sectional study. Eleven public schools in the city of Tepic, Nayarit State, Mexico were selected randomly, 724 schoolchildren (9-12 years old, 302 boys and 422 girls) participated in the study. Daily food intake and anthropometric data were obtained. Informed consent was obtained from children and from their parents or tutors. The following data were collected: grade, gender, age, weight, height, and place of living.
Dietary intake was measured using two-day nonconsecutive food records, where five meal food intakes were evaluated: breakfast, mid-morning meal, lunch, afternoon snack and dinner. The foods consumed were recorded in detail in order to obtain brand name and declared composition of commercial items, constituents of mixed dishes, etc. The assessments of quantity/volume, common household or other measures (plates, cups, spoons, etc.) were used. Nutrient intakes were calculated using the DIAL dietary analysis software (8). The DIAL food database was expanded adding the food composition of traditional Mexican foods and recipes (9, 10).
A total of 495 food items consumed by the participants were classified into 13 groups according to the DIAL software as follows:
1) Cereals; breakfast cereals, wheat flour, toast, white bread, bread, biscuits, sweet bread, paste, corn kernels, corn tortilla, rice, oats. 2) Legumes; soybeans, lentils, chickpeas, refried beans, boiled beans, green beans, pea. 3) Vegetables; carrot, purslane, green tomato, radish, green pepper, cucumber, potato, cactus, white cabbage, cilantro, chilli, white onion, squash, pumpkin, broccoli. 4) Fruits; Grape, pear, grapefruit, tamarind, watermelon, banana, dragon fruit, pineapple, raisins, orange, papaya, nanchi, melon, mango, apple, lemon. 5) Milk and dairy products; whole milk, lactose-free milk, evaporated milk, light milk, yogurt, milkshakes, cream, cheese. 6) Meat; beef, chicken, pork, sausage, bacon, belly, ham, liver, beef rib, turkey sausage, pork sausage, pork leg, chicken gizzards. 7) Fish and seafood; sawfish, salmon, sardines, octopus, snapper, oysters, marlin, dry shrimp, fresh shrimp and tuna. 8) Egg; whole and white egg. 9) Sugars, sweets, and pastries; sucrose, fructose, lollipops, artificial sweeteners, cakes, chocolate powder, chocolate bar, jam, gummy candy, gum, candy with chili. 10) Oils and fats; corn oil, sunflower oil, olive oil, lard, butter. 11) Beverages; purified water, coffee, tea, soda, natural and processed juices. 12) Snacks; corn chips, popcorn, potato chips, pumpkin seeds, peanuts, olive. 13) Sauces and seasoning; tomato puree, pepper, oregano, hot sauce, Worcestershire sauce, “pipian”, vinegar, bay leaf, chicken broth, mint, cumin, cloves, garlic, salt.
Food group energy intakes (in kcal) were divided by the total energy intake in order to derive their relative energy contribution to the overall diet. In order to reduce data dimensionality a principal component analysis (PCA) was performed to determine the energy contributed by each food group to the extracted principal components (PC). Dietary patterns were extracted based on the correlation matrix. PC were calculated without rotation and the number of PC was based on eigenvalues >1.0, identification of a break point in the scree plot, and interpretability. PC scores for each individual were calculated. Multiple regression analysis was used to test the relation between weight, BMI and PC score. Results were reported for the final model as standardized beta coefficient (b) and level of statistical significance (p<0.05). Furthermore, k-means cluster analysis (KCA) with PC score was used to classify students in three diet types and to reveal meaningful dietary patterns, as well as, to identify food groups with higher caloric intake and to determine the relationship between diet and overweight-obesity status. Threecluster solution was derived through KCA with a maximum number of iterations equal to ten. Initial cluster centers were obtained with sort distances and taking observations at constant intervals. Three clusters were selected because they were best interpretable and to check whether PCA and KCA extracted comparable patterns.
Trained personnel measured height and weight in scholars. Measurements were done in triplicate and the values were an averaged. Height was measured using a stadimeter (SECA, Model 213, Hamburg Germany) and recorded to the nearest 0.1 cm. Weight was recorded to the nearest 0.1 kg using an electronic scale (SECA, Model 803, Hamburg Germany) with a capacity of 150 kg. Subjects were shoeless and wore light cloths. Body mass index (BMI) was calculated and subjects were classified as follows: BMI<5th percentile, underweight, 5 to 85th percentile, normal weight, > 85th percentile, overweight and ≥95th percentile obese (11).
Statistica Release version 8.0 (StatSoft. Inc., Tulsa, OK, USA) was used for data analysis. Continuous variables are presented as mean values ± standard deviation, and categorical variables are shown as absolute frequencies. Contingency tables with calculation of χ2 test evaluated associations between the categorical variables, while one-way analysis of variance was applied for evaluating the associations between groups. P values < 0.05 were considered significant.
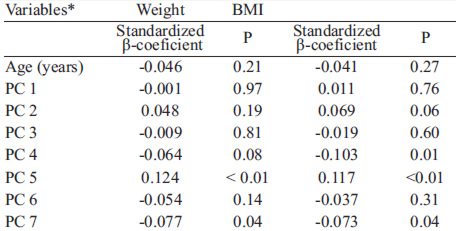
Thirteen dietary patterns emerged from PCA, but only seven had Eigenvalues > 1. This analysis explained 70.25 % of the variance in food group intake. Figures 1A and 2A show the PCA-loading matrix for the seven dietary patterns in the studied population. As higher absolute values indicate that the food variable contributes more to the development of the principal component (PC), dietary patterns showed the following characteristics: a pattern high in meat, oils and fats, low in cereals, milk and dairy products (PC 1);a pattern rich in vegetables, sauces, and seasonings, and low in sugar, sweets, pastries, oils, and fats (PC 2); a pattern characterized by high consumption of cereals, low consumption of vegetables, fruits, sugar, sweets, and pastries (PC3); a pattern characterized by high consumption of beverages and snacks, and low intake of egg (PC 4); and a pattern that represented important vegetables, fish, and seafood consumption (PC 5), legumes and beverages (PC 6), and high consumption of legumes and snacks, and low intake of beverages (PC 7). PCA was performed to obtain PC scores for each child subject. PC scores were used in the multiple regression and cluster analysis. Associations between PC´s and weight or BMI were then evaluated with multiple regression analysis; the models are presented in Table 1. PC 5 was positively associated with weight (standardized β-coefficient = 0.124, p< 0.01) and BMI (standardized β-coefficient = 0.117, p< 0.01). PC 7 was negatively associated with weight (standardized β -coefficient = -0.077, p = 0.04) and with BMI (standardized β-coefficient = -0.073, p = 0.04). PC 4 was negatively associated with BMI (standardized β -coefficient = -0.064 p = 0.01)
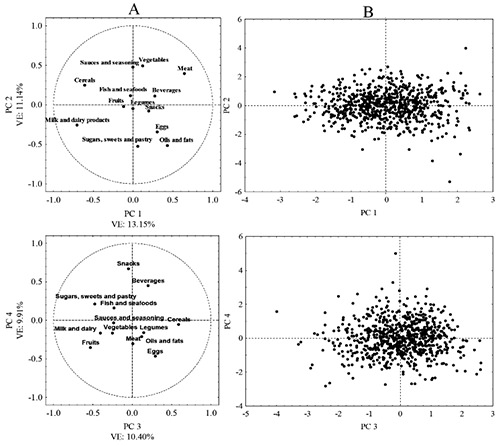
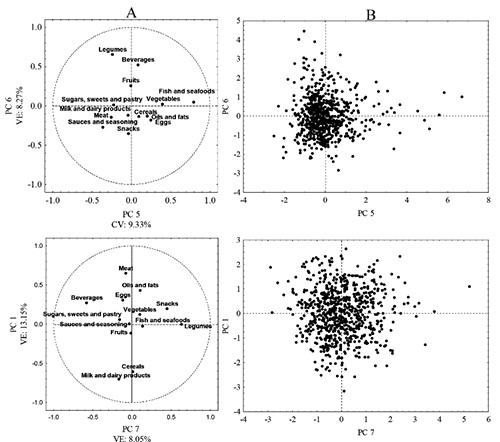
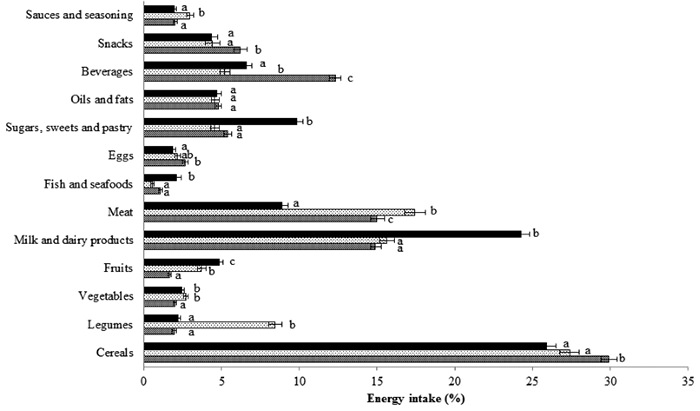
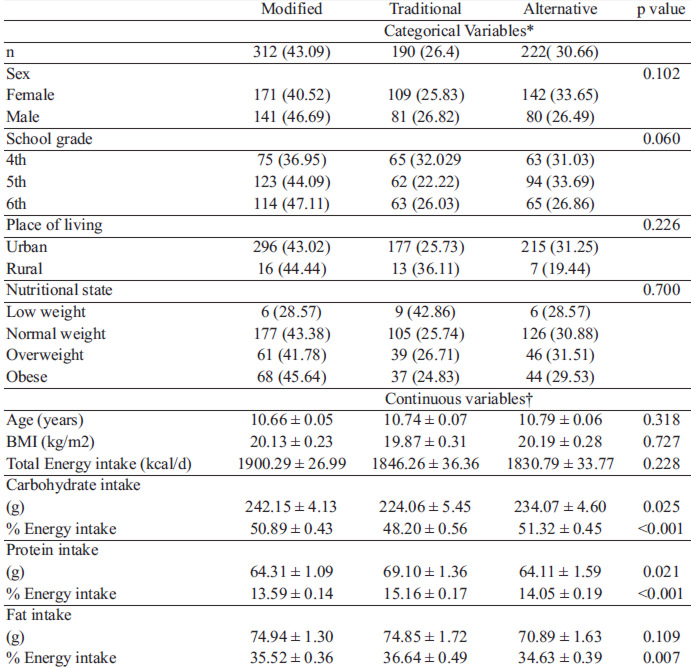
Using cluster analysis, the schoolchildren were divided into three categories: Cluster 1 with 312 (43.1%) subjects, cluster 2 with 190 (26.2%) and Cluster 3 with the remaining 222 (30.7%). The PC scores are presented in Figure 1B and 2B. They were used to classify Mexican schoolchildren into three groups. PC 1, 3 and 4, obtained the highest score in Cluster 1 (n=312), which represents a diet high in meat, oils, cereals, snacks and beverages. Thus, Cluster 1 was labeled as “Modified Mexican Diet”. PC 2, 6 and 7, had the highest score in cluster 2 (n=190), and was named as “Traditional Mexican Diet” with large intake of legumes, vegetables, snacks, sauces and seasonings. The cluster 3 (n=222) had a high score in PC 5, with increased consumption of fish and vegetables named as an “Alternative Mexican Diet”. Figure 3 shows the mean energy supplied by each food group to the three diet types. In general, the cereal group was the greatest energy source followed by meat, milk, and dairy products. Significant differences (p<0.05) were found between each diet for these three food groups. The higher intake of legumes was found in “Traditional Mexican Diet” (8% intake) with significant differences (p<0.05) compared with the other diets. In “Alternative Mexican Diet”, milk and dairy products represented the second most important energy source (24%), just below the cereals group (26%). Energy intake from meat was more frequent than fish and seafood (8 to 17 % vs 0.5 to 2% respectively) in all diets. The energy intake from sugars, sweets, and pastries was higher in “Alternative Mexican Diet” (9.8%), showing significant differences (p<0.05) with “Modified and Traditional Mexican Diets” (5.3 and 4.5% respectively), although these types of foods were presented in all the diets. In the “Modified Mexican Diet”, beverages accounted for about 12% of total energy intake, being significantly different (p<0.05) from the other diets. The highest levels of fruit and vegetables intakes were observed in the “Alternative and Traditional Mexican Diets” (4.8% and 2.7%, respectively), values that were significantly different (p< 0.05) compared with the “Modified Mexican Diet”. Sauces and seasoning intake showed significant differences between “Traditional Mexican Diet” (3% intake) and “Modified and Alternative Mexican Diets” (2% intake). No significant differences (p>0.05) were observed in eggs, snacks, oil and fats intakes among the different diet types.
Basic characteristics of Mexican schoolchildren Characteristics of schoolchildren by dietary pattern groups are shown in Table 2. Broadly, the prevalence of overweight was 20.2% and of obesity was 20.6%. In girls, 2.6% showed low weight, 59.7% had normal weight, 19.4% were overweight, and 18.2% were obese. In boys, 3.3% had low weight, 51.7% had normal weight, 21.2% were overweight, and 23.8% were obese. Sex, school grade, living place and nutritional state did not show association with diet type (p>0.05), 43% of the whole schoolchildren sample, 40.5% of girls and 56.7% of boys respectively, consumed the “Modified Mexican Diet”. Four in ten children with overweight or obesity consumed the “Modified Mexican Diet” and four in ten children with low weight consumed the “Traditional Mexican Diet”. No significant differences (p >0.05) were found between age, BMI and total energy intake. However, significant differences were found in protein, carbohydrates, and fat intakes among the various diet types (p<0.05). Mean energy intake in the whole-cohort of schoolchildren was 1864.80 ± 492 kcal/day. Carbohydrates represented 50% of total energy intake (234.9 ± 72.57 g/day), protein 14% (65.51 ± 20.77 g/day), and fat 36% (73.67± 23.66 g/day). Meals with more total energy contribution in the day were breakfast 23% (467.44 ± 243 kcal/day), mid-morning meal 28% (568.42 ± 290 kcal/day) and dinner 23% (452.33 ± 225 kcal/day).
In this study, specific dietary patterns were identified in a cohort of Mexican school children living in Nayarit State using a combination of PCA and cluster analyses and the association of each PC with weight and BMI was evaluated. Seven dietary patterns emerged and three diet types were identified: “Modified Mexican”, “Traditional Mexican” and “Alternative Mexican”. Positive and negative associations between weight and BMI, and dietary pattern intake were also observed. Interestingly, elevated BMI was associated to PC 5 (fish, moderate vegetable, oils and fats, and low consumption of legumes, meat and sauces and seasoning), something that does not agree completely with the generally accepted beneficial impact of vegetables or fish on health (12). This apparent paradox may be explained by the occurrence of interactions between different food groups in the PC. Also, both “Modified” and “Alternative” Mexican diets imply a relatively low legume intake (3%) compared with the “Traditional Mexican Diet”, where legumes constitute 8% of the daily intake. Thus, the two dietary patterns characterized by a low intake of legumes and high intake of oils and fats may lead to the elevated BMI values recorded. Additionally, the form of preparation of different dishes, both at household level and away from home, may have influence on body mass and composition of schoolchildren.
Previous studies have suggested a negative influence of away-from-home food consumption on obesity among all age groups, due to high energy, saturated and total fat content (13). A high intake of legumes and snacks, together with low sweet beverage consumption were associated with decreased weight and BMI. Legumes (eg, beans, lentils, chickpeas) have low fat content and are good sources of dietary fiber and protein, and provide important levels of slowly digestible carbohydrates (14). Several epidemiological studies have shown that dietary patterns corresponding to high legume intake are associated with protection against heart disease (15). We observed an association between high intake of snacks and low BMI. The energy intake from snacks in this study ranged between 4 and 6 % total energy. This value was lower than those found in an investigation in American children (more than 27% of total energy), although in that study desserts and sweetened beverages were considered as snack (16). Evidently, the criteria used for classifying different items in food groups may be of importance when establishing comparisons with other populations. Additionally, the high consumption of whole milk and dairy products could be associated with the lipid profile showed by Mexican children. A decrease in whole milk intake accompanied by an increase in sugar-sweetened beverages could be contributing to obesity development. Nonetheless, consumption of milk and dairy products low in fat with added micronutrients could reduce obesity risk (17). Fruits and vegetables have been considered rich sources of some essential dietary micronutrients, polyphenols and dietary fiber. Although fruits and vegetables intake in this study may be considered low, it was not associated with increased BMI values. On the other hand, it has long been recommended reducing the intake of red meat, mainly due to its high content of saturated fatty acids; however, we found no relationship between this food group and increased weight or BMI values. In this sense, lean red meat can lead to decreased levels of ghrelin (a hormone that stimulates hunger) and increased secretion of the hungerreducing hormones glucagon-like peptide-1 (GLP-1) and peptide YY (PYY) (18). In the present study no relationship between overweight-obesity status and diet types was found. Multiple factors influence overweight and obesity status in children, including mothers’ obesity, low physical activity, skipping breakfast, habitual overeating, father’s overweight and mother’s age over 40 years (3). Recently, the R230C variant of ABCA1 (cholesterol transporter) was associated with high circulating triglyceride and reduced high-density lipoprotein cholesterol levels in overweight/obese Mexican schoolchildren (19). Those observations suggest a genetic factor associated with the development of obesity in this population, although larger studies are needed to validate this finding (19). BMI has been linked to the development of non-transmissible diseases in childhood and children with a BMI ≥ 85th percentile and waist circumference ≥ 88.08 cm have greater risk for prehypertension and metabolic syndrome (20). Interestingly, we did not find a significant correlation between overweight-obesity status and the type of diets. However, we found here that the diet type influenced the nutrient intake profile and the intake of different food groups. Importantly, the observed differences in intake of certain food groups on the various diets were of a reasonable magnitude (i.e. “Modified Mexican” 5.7 % higher for beverages; “Traditional Mexican” 8 % higher in legumes, and “Alternative Mexican” 8.5 % higher in milk and dairy products). If such differences persist after childhood they are likely to have important consequences for the children’s health outcomes, given that dietary habits have been shown to track over the life course. Considering this, it is important that children develop skills at early life, which enable them to choose healthy foods in less structured environments, such as away from home or off school setting, so that these practices can continue into adulthood (21). In Australian schoolchildren, consumption of vegetables and fruits was higher in school days compared to nonschool days, due to the existence of school/based interventions encouraging fruit and vegetable breaks and/or providing subsidized fruit and vegetables (22). In recent years, healthy diets and physical activity have been promoted in Mexican education system, programs that have contributed to control the prevalence of obesity in schoolchildren (23). However, these actions have been conducted mainly in central Mexico, specifically, Mexico City. The information on dietary patterns identified in this work can be used to plan a nutritional intervention and prepare healthy dietary guidelines for specific regions, and possibly to take into account at a larger national scale, considering the diversity in foods preparations. As far as we know, this study is the first to examine the association between dietary patterns and overweight-obesity occurrence in schoolchildren in western Mexico. The combination of several multivariate techniques proposed in this work allowed to improve understanding of relationships of obesity and dietary patterns. Several limitations need to be considered in the interpretation of present data. Besides the relatively small sample size, dietary recalls are known to leave margin for inaccuracy. Moreover, the cross-sectional design (two-day recall) of the study also limits the interpretation of our findings in terms of its temporality. The classification into 13 food groups may have generalized the effects of dietary patterns; a larger number of food groups could provide more specific information on the influence of food items. The dietary pattern approach can create difficulties in replicating results in other populations. Nevertheless, this approach is useful for enhancing our understanding of the complex dietary variables involved in the development of non-communicable diseases. Further interventional and/or longitudinal studies are necessary to confirm here-presented findings.
The use of a combination of cluster analysis via principal component analysis gave seven dietary factors and emerged three different diets: Traditional, Modified and Alternative Mexican Diets. A dietary pattern characterized by high legume, snack and low beverage intake was negatively associated with weight and BMI, suggesting that the Traditional Mexican dietary pattern could lead to reduced prevalence of overweight and obesity among schoolchildren. An unclear relationship between overweight-obesity status and diet types was found. The macronutrient intake profile of schoolchildren is dependent on the type of diet consumed. The energy intake from sugars, sweets, pastries and sweetened beverages appears in all dietary patterns. New policies for the combat of overweight and obesity prevalence in Mexican schoolchildren should be consider, including the design of nutrition intervention program customized to the dietary patterns of each geographic zone.
Acknowledgements Special thanks to the children participants and their parents, to Public Education Services of Nayarit State (SEPEN) and to all the teachers who readily consented to carry out the study during school hours. VMZ-G acknowledges CONACYT, Mexico, for a scholarship (Registration number: 253795).
Recibido: 14-07-2016
Aceptado: 15-11-2016