
 ,
Izabella Bianca Cisterna Melo1 ,
Larissa Galastri Baraldi1 ,
Alline Artigiani Lima Tribst1
,
Izabella Bianca Cisterna Melo1 ,
Larissa Galastri Baraldi1 ,
Alline Artigiani Lima Tribst1
Introduction. The COVID-19 pandemic has impacted diet quality in differentways. In this context, community, organizational and consumer nutrition environments can influence the eating pattern. Objective. The purpose of this study was to identify how quarantine during the COVID-19 pandemic changed the diet in Brazil. Materials and methods. A natural experiment organized into experimental (social-isolated group - SIG) and control groups (non-isolated group - CG) was conducted with data collection from an online survey at the beginning of the pandemic (T0) and in the less restrictive period of 2020 (T1). Pre-post improvements in diet quality (IDQ) were determined for the SIG and CG. Intro-intergroup changes were tested using the Mann–Whitney and Wilcoxon signed rank tests. The intervention effect was estimated using crude and adjusted difference- indifference in multilevel regression analysis accounting for repeated measures. Results. A sample of 565 Brazilian adults answered the questionnaire at T0 and T1. IDQ was favored twice or more by attitudes such as buying food directly from farmers/street markets, reducing requests for food delivery, and increasing time spent on eating activities and the frequency of cooking. The isolated group had no IDQ at T1, whereas the no isolated group, who worsened diet quality (6.1%) at T0, improved it at T1 (4.8%). Conclusions. The restrictive quarantine forced the non-isolated population to have an experience comparable to a food desert, negatively affecting their diet. Arch Latinoam Nutr 2023; 73(3)S2: 101-111.
Keywords: food habits, food supply, family food environment, healthy diets, risk factors.
COVID-19 ha impactado la calidad de la dieta de diferentes maneras. Los entornos comunitarios, organizacionales y nutricionales de los consumidores pueden influir en los patrones dietéticos. Objetivo. el objetivo de este estudio fue identificar cómo la cuarentena durante la pandemia de COVID-19 cambió la dieta en Brasil. Materiales y métodos. Se realizó un experimento natural organizado en grupos experimental (grupo socialmente aislado - SIG) y control (grupo no aislado - GC) con datos recolectados en una encuesta en línea al inicio de la pandemia (T0) y en el momento menos restrictivo de 2020 (T1). Se determinaron mejoras pre-post en la calidad de la dieta (IDQ) para SIG y GC. Los cambios intra-intergrupo se probaron utilizando las pruebas de rangos con signos de Mann-Whitney y Wilcoxon. El efecto de la intervención se estimó utilizando diferencias crudas y ajustadas en el análisis de regresión multinivel, teniendo en cuenta medidas repetidas. Resultados. Una muestra de 565 adultos brasileños respondió el cuestionario en T0 y T1. IDQ se vio favorecido dos o más veces por actitudes como comprar alimentos directamente de los agricultores/mercados callejeros, reducir los pedidos de entrega de alimentos y aumentar el tiempo dedicado a las actividades alimentarias y la frecuencia de cocinar. El grupo aislado no mostró IDQ en T1, mientras que el grupo no aislado, que tenía peor calidad de la dieta (6,1%) en T0, mejoró en T1 (4,8%). Conclusiones. La cuarentena restrictiva obligó a la población no aislada a tener una experiencia comparable a un desierto alimentario, afectando negativamente su dieta. Arch Latinoam Nutr 2023; 73(3)S2: 101-111.
Palabras clave: hábitos alimentarios, oferta de alimentos, entorno alimentario familiar, alimentación saludable, factores de riesgo.
https://doi.org/10.37527/2023.73.S2.012
Autor para la correspondencia: Larissa Galastri Baraldi, e-mail: [email protected]
The COVID-19 pandemic has imposed new ways of organizing routines and making choices, including focusing on how people eat. Studies in different countries covering the COVID-19 pandemic period highlighted that both improvement and worsening of diet quality could occur in different groups depending on interactions with other socioeconomic and individual determinants (1-5).
In 2020, the United Nations System Standing Committee on Nutrition mapped the possible impacts of the COVID-19 pandemic on the food environment conceptual framework (6).
This framework identifies external and personal food environment dimensions that interact to shape people’s food acquisition and consumption. External dimensions include food availability, prices, vendor and product properties, and marketing and regulation policies, while the personal domain features dimensions relative to individuals, such as accessibility, affordability, desirability, and convenience (6).
Studies have shown that people’s dietary behavior and food consumption patterns can be determined by the spatial organization of the food environment and how it is licensed, available, and accessible to the population (7). Authors have also identified negative and positive changes in the family food environment during the COVID-19 pandemic (2). Negative ones are related to changes in eating habits (eating more), weight gain, increases in snacking, and irregular meal time frequency (2). In contrast, positive changes in the food environment included an increase in the time available to organize eating activities, a better division of cooking/house chores (1, 5, 8), and an increase in family mealtimes, which helped keep families connected during the pandemic (9, 2).
Additionally, consumers have been facing issues in the food environment, such as worsened food affordability, changed food prices, availability, and accessibility. There was a restriction on diversified food sources, and switching food acquisition practices, increased social capital, and local community food participation (3, 10).
In Brazil, the first wave of the pandemic occurred between March and September 2020 (11), reaching an intensive care unit hospitalization demand of up to 96% and causing approximately 155,000 deaths, according to data from Brazilian network media vehicles (12). In this period, self-isolation varied from 66.2 to 44.7% since different actions and regulations were adopted by states and municipalities at different times (13,14). Between September and November 2020, green flags based on the reduction of cases, hospitalization, and deaths allowed the flexibilization of quarantine, with the reopening of restaurants, parks, shopping, school, and nonessential services in most cities of the country, even following the rules of social distance, such as obligatory use of masks, reduced occupation of places and minimal distance between people (15). At this time, 33-40% of the population remained in social isolation, reaching lower levels since the beginning of the pandemic (13). Thus, in this second moment, considerable differences were expected in relation to individual, household and food environments between self-isolated and no isolated people.
Considering the multifactorial aspects that can influence the eating pattern, possible impacts of the covid-19 on the food environment (6) affecting food supply and consequently consumer behavior, we hypothesized that people exposed to an environment of prolonged social isolation changed their diet in a different rate from those who were not social isolated during the COVID-19 pandemic. Therefore, this natural experimental study aimed to signalize factors that affected the diet quality of Brazilians that experienced different external and internal domains of the food environment. The results of this study could support evidence-informed public health decisions standing out potential critical and fragile dimensions of the Brazilian food system that could be affected even in a short term, as happened in the first six months of COVID-19 pandemic.
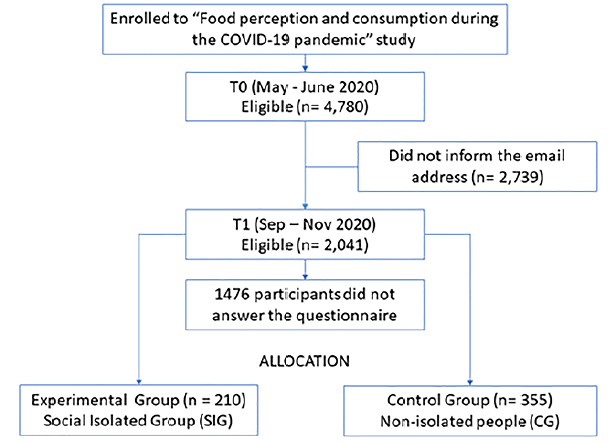
This study applied a natural experimental design (16) involving two data collections of self-reported data through an online survey applied in two groups (experimental and control groups) at the beginning of the pandemic in Brazil, from May 12th to June 26th, 2020 (T0) and reapplied from September 25th to November 19th 2020 (T1), over a convenience sample. T0 covered the most restrictive period of quarantine of the COVID-19 pandemic in Brazil (881-990 deaths daily), while T1 covered the flexibilization period in 2020 (388- 771 deaths daily). At T0, 4,780 eligible participants (over 18 years old) were recruited using a snowball sampling strategy through social media and networking, in addition to the researchers’ professional contacts (5). At T1, 2,041 participants whose email was informed at T0 were contacted and asked to respond to the instrument again. From those, a total of 565 valid responses were obtained in T1, composing the final sample (participants who answered the survey at both times requested). Figure 1 shows the study participants enrolled, allocated, and analyzed. Ethical approval was obtained from the human ethics committee (CAAE 30650220.0000.5404).
This study adopted the instrument (Supplementary material) previously tested and published that covered the changes promoted by the COVID-19 pandemic in different dimensions: (i) food marker consumption, (ii) accessed food supply, (iii) beliefs and feelings related to food consumption, (iv) individual and family cooking habits and practices, and (v) sociodemographic profile. More details about instrument development and application are found elsewhere (5). On T0, all questions were referred to the period before the pandemic, and on T1, the same questions were asked referring to changes that occurred compared to T0.
To determine who would compose the “experimental group” and who was allocated to the “control group”, participants answered at T0 and T1 whether (i) they were socially isolated (yes/ partially/ no); additionally, at T1 they answered if (ii) in relation to the beginning of the pandemic (T0) their social isolation “increased or decreased or remained the same”. On that note, the constraints to take part in the experimental group were as follows: individuals who had answered “yes” to the first question at both times or those who answered “partially” on T0 and “yes” on T1 and regarding the level of self-isolation respond “increased” or “remained the same”. These rules aimed to select only those who actually experienced the influence of self-isolation in their routine in that period; all other combinations of responses led the individual to the control group (CG). We named the experimental group the Social Isolated Group (SIG). As a result of this grouping, the variable “experiment” presented two categories that totaled 210 participants and CG 355 participants.
WinPepi software was used to estimate the minimum sample size needed to test changes in ratios (before and after the natural experiment) for a different two independent samples. The parameters considered were the significance level of 5% and power of 80%, expected percentages were obtained in the baseline (33% of the general population changed their diet) and the expected change in the right direction for each group. This estimation pointed at least 134 in each group, which was achieved as mentioned above.
Moreover, the main outcome was generated based on a previous study and named “Improved diet quality” (IDQ), configuring healthy changes in food patterns (5). In short, this outcome was categorized as “1” when participants reached the following conditions: a) increased the consumption of at least one of the food markers of diverse and healthy diets (fruits/vegetables), b) had a positive result in the final sum of the group previously identified as healthy, and c) the sum of the score for the unhealthy group was zero or negative. Otherwise, the outcome was categorized as “zero”, grouping respondents who did not achieve all conditions necessary to be classified into the IQD group during quarantine.
Descriptive frequency analyses were conducted on the sociodemographic characteristics of participants comparing the SIG group and CG at baseline using the Pearson chi-square test or nonlinear equivalent (Fisher’s exact test) when the data were binary, and the Bonferroni test was applied to explore which categories the difference was significant when variables presented more than two categories.
Intra- and intergroup changes observed in the outcome were tested using the Mann– Whitney and Wilcoxon signed rank tests, respectively. Considering the repeated measures of individuals, which are known to be temporally autocorrelated, our statistical approach to accurately evaluate changes - presented as Odds Ratio (OR) - in the outcome was a multilevel mixed logistic regression analysis, considering the individual as the second level and with exchangeable structure covariance, which allowed the analysis to assume that within-group residuals are serially correlated from one observation to the next. In this regard, the true intervention effect of this natural experiment was estimated using crude and adjusted difference-in-differences in this multilevel regression analysis, always adding the variables ‘experiment’, ‘time’ and the interaction term between them in the models. A significance level <0.05 was considered for all estimates. All statistical analyses were conducted in Stata 16.1 MP software.
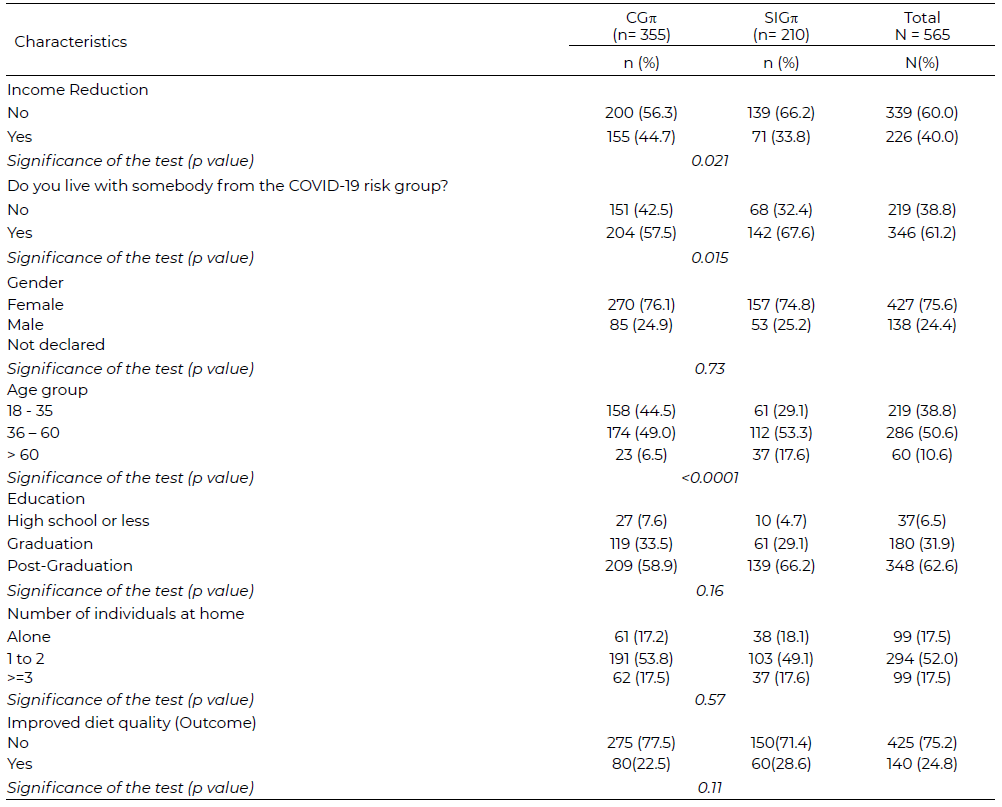
The study population comprised mostly women (approximately 75.6%) with a postgraduate degree (62.6%) who were living with one or two persons (52,0%), and almost 61% lived with somebody from the COVID-19 risk group (Table 1). They did not suffer income reduction (60.0%), and the majority did not improve their diet quality at baseline (75.2%). Mostly, the sociodemographic characteristics of SIG did not differ from the CG, maintaining the characteristics described above (Table 1). However, the SIG age group presented almost 3 times more elderly (>60 y.o.) than CG, approximately 15% fewer adults in the 18-35 age group (p<0.001) and a higher proportion of individuals without income reduction (66.2%; p <0,001).
Changes in individual factors and the family food environment that influence the outcome (IQD), controlled by ‘experiment’ and ‘time’, are presented in Table 2. In the crude analysis, independent of the time and group, the chance of IDQ was two times higher for those who increased the frequency of buying food directly from farmers or the street market. Furthermore, among those who reduced the frequency of asking for delivery of fast food or lunch boxes, the corresponding OR of IDQ were 2.3 and 2.6, which remained significant (p <0.05) in the adjusted analysis (OR = 1.6 and 1.7, respectively).
Increases in the time spent on eating activities and the frequency of cooking at home had IDQ (crude OR = 2.1 and 1.9), and the adjusted chance of IDQ remained significantly higher (OR = 1.7; p <0.05) among those who increased the frequency of cooking (Table 2).
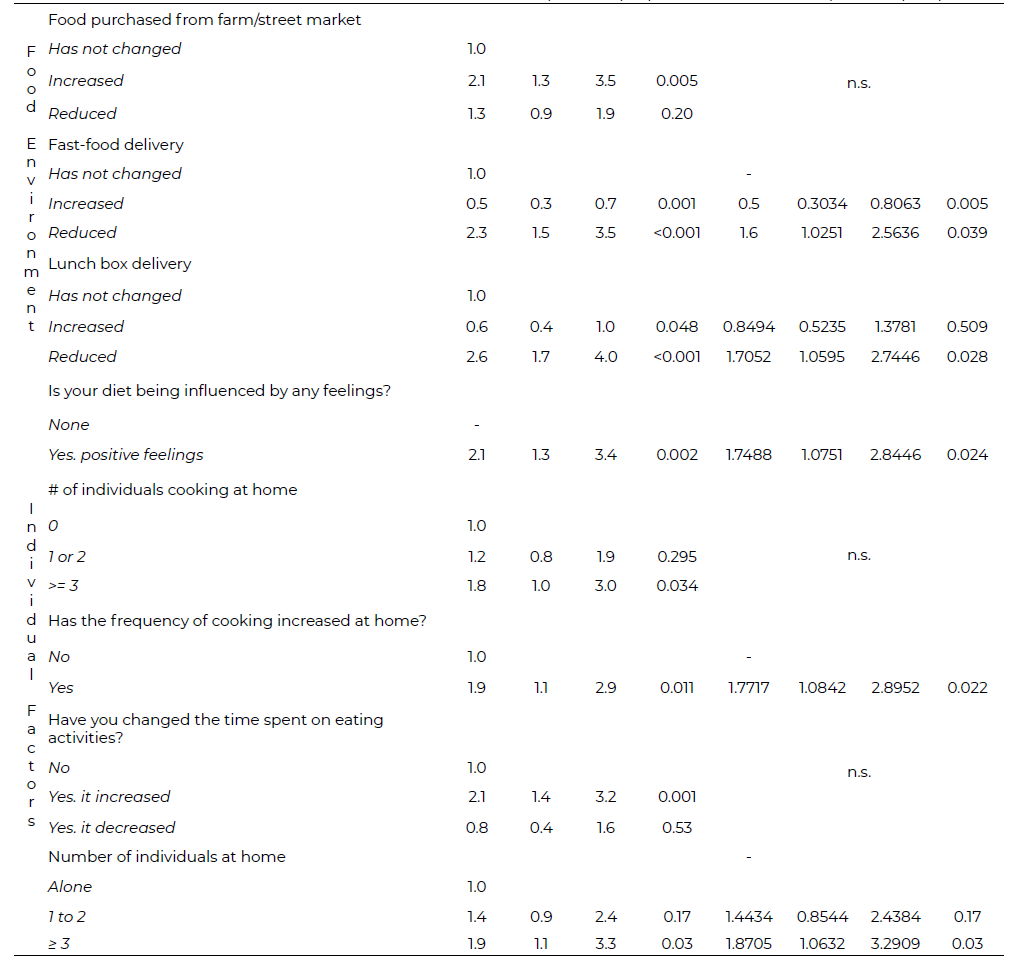
Additionally, the tendency (p for trend = 0.038) was that the greater the number of people living together, the greater the chance of IDQ in the adjusted model. Positive feelings influenced the adjusted OR on the IDQ by almost twice (Table 2).
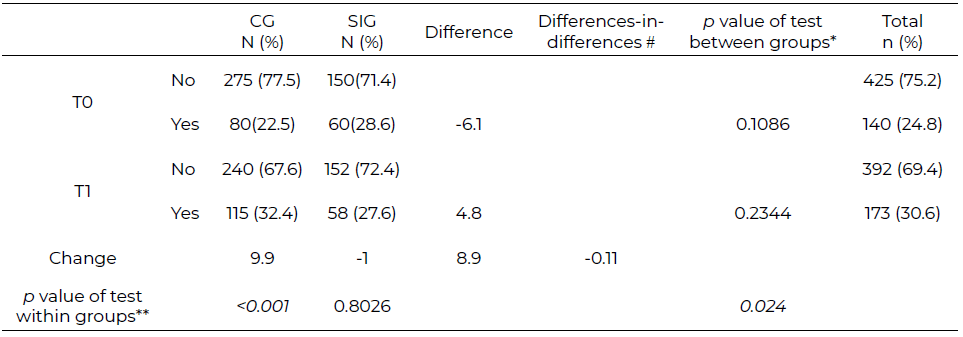
At T0, there was no significant difference between SIG and CG for IDQ; instead, the difference between them was – 6.1 percentage points (p.p) for CG. On T1, CG outperformed SIG at 4.8 p.p. A significant and positive difference in the outcome (9.9 p.p; p<0.001) was observed in the intragroup test for the CG. Furthermore, the interaction effects between time and group were significant (p = 0.028); therefore, the adjusted average difference-in-difference of improved diet quality was – 10.6 p.p, considering the CG as a reference (Table 3).
The hypothesis of the study was that the diet of people in a strict and prolonged social isolation group was different from the non-isolated group during the COVID-19 pandemic. The adjusted average difference- in-difference of improved diet quality of the natural experiment was significant, confirming the hypothesis. The main observed difference was that the control group improved diet quality at the less restricted period due to improved access to healthy food, while the group in social isolation for a long period did not substantially change the consumption of healthy food. This result highlights that the influence of the place of food consumption (isolation at home, at work or school) is very weak compared to changes happening in access to healthy foods, and also indicates that the guarantee of the human right to adequate and healthy food has been driven by the place of food purchase in Brazil including vendor properties (6).
Furthermore, the overall evaluation of the results showed that improvements in diet quality were associated with an increase in the frequency of buying food directly from farmers or in the street market and a reduction in the frequency of asking for delivery of fast food or lunch boxes, increasing the time spent on eating activities and cooking at home, regardless of the interaction between time and group. In addition, the more people living together and the greater the presence of positive feelings, the greater the chance of improving diet quality.
These results were in line with those observed in the first step of this research (5) and reflect some of the main messages of dietary guidelines about the importance of spending more time on eating activities and about the food environment (17) reinforcing the relevance of the domestic environment in the eating pattern. In this sense, previous studies showed that positive meal time interactions were associated with more frequent healthy family meal practices and influenced the parent–child diet (18,19). Additionally, a systematic review with meta-analysis showed stronger evidence between the relation with family functioning outcomes and family meal frequency (20).
In our first cross-sectional study, the main factor responsible for the IDQ was self-isolation (OR = 2.24), motivating the experimental design of the present study. This parameter was associated with increasing time available for meal preparation and better division of cooking chores (5). In addition to these factors, the quick improvement of diet quality at the beginning of the COVID-19 pandemic might be explained by the cooking skills of Brazilians, who used to eat traditional meals independent of social class and age (21). Similarly, other researchers evidenced the IDQ at the beginning of the COVID-19 pandemic for populations who believe that cooking plays a vital role in the dimension of care (22).
The follow-up results presented in this study showed that those who remained isolated did not improve or reduce diet quality compared to the first months of the pandemic, indicating that the improvements in diet quality reached in the beginning of the pandemic were maintained in the subsequent months, suggesting a stable pattern. Furthermore, the absence of significant new improvements may indicate that these groups have rapidly reached the desirable quality of the diet and/ or further improvements were not possible, considering the organization of the routine.
This stability in the maintenance of diet quality among the SIGs can be justified by some sociodemographic characteristics of this population, such as a higher prevalence of elderly people and individuals who did not present substantial income losses in this group compared to the CG. Another study about changes in the Brazilian lifestyle and the impact of social isolation during the pandemic showed that the consumption of healthy foods remained higher among the elderly (23). In addition, isolated families were usually more upper-income families, able to work from home, with higher purchasing power and accessibility for buying healthy food, while non isolated families have lower consumption of healthy foods, especially those of low income when compared to isolated families (24).
Conversely, the no isolated group (CG) showed improvement in diet quality only in the less restrictive phase of the pandemic in 2020. The main aspect that explains these differences refers to the changes that occurred in the food environment to which the no isolated population was exposed in the two periods. In T0, restaurants were completely closed for on-site consumption. Thus, for no isolated people, meal purchase options were restricted to ready-to-eat suppliers that already had a delivery system organized before the pandemic, mostly fast-food restaurants (25).
Data from Brazil show that there was significant growth in delivery services in the first year of the pandemic. Delivery sales grew by 94% between January and May 2020 compared to the same period in 2019, and delivery spending grew from April, the height of quarantine and social isolation (26). Exclusively comparing data from food franchises, billing numbers jumped from 18% to 36%, and orders via ‘WhatsApp’ (online shopping) more than doubled in 2020 compared to 2019 (27). In this context, a cross-sectional study that evaluated the use of food delivery apps (FDA) during the COVID-19 pandemic in Brazil found that approximately 47% of consumers use FDA weekly (28). Previous research evaluated the advertisements found in this type of digital food environment and showed that although some healthier options (for example, pasta or traditional meals) were advertised, the selling of unhealthy meals was favored by offers such as free delivery, combo options and other money-saving messages (29).
On the other hand, in T1, commercial establishments and restaurants reopened for on-site consumption due to the loosening of restrictive measures, and there was also time for local food traders to organize themselves for delivery/pickup (15). Therefore, this period was marked by an increase in options for purchasing food/ meals for those who were not in isolation.
In Brazil, only 15.1% of the mean daily energy intake per capita is consumed away from home. Among people who ate away from home 2 days/week, 63.4% of the energy consumed came from culinary preparation, compared to the 73.3% of energy for people who only ate at home (29). Thus, although there is a positive correlation between the reduction in the consumption of culinary preparations and the days that people eat out, culinary preparations still account for the largest proportion of the diet eaten out in Brazil (30). Similarly, other research showed that sit-down restaurants were the favorite place for meal acquisition outside the home in this country, which is positive with respect to the nutritional quality of the meals, since they were inversely associated with the consumption of ultra-processed foods, while fast-food restaurants were directly associated (31). It is important to highlight that in Brazil, there is a predominance of sit-down restaurants that adopt self-service systems, which are places where people select from a wide variety of foods what they will consume. They choose the preparations, and the charge is calculated per food weight consumed. This type of establishment, in general, has a wide variety of food and culinary preparations, which gives a wide range of choices for its audience.
This indicates that, during T0, the closing of restaurants that serve culinary preparations limited the options for purchasing meals and conditioned the population that could not be isolated to unintentionally worsen the diet quality. In T1, the reopening of these places allowed an improvement in the diet quality for this part of the population. This first context could be compared to food swamps, where residents of a determined geographic area have restricted or nonexistent access to healthy food options (especially fresh fruits and vegetables) due to the absence of grocery stores within a convenient traveling distance and at the same time fast food and junk food inundate the households as alternatives (32,33).
Still related to the food environment, this analysis reinforce that, regardless of the group and the time interval, buying food at the market and ordering less fast food or lunch box for delivery were associated with better nutrition (31). In this case, it is worth mentioning that places that deliver lunch boxes normally offer small quantities and varieties of fruits and vegetables, explaining why this kind of consumption could not be associated with the improvement of diet quality.
Thus, the general evaluation of the results shows how the place of purchase is directly associated with the quality of the diet, reinforcing that the greater the number of places that sell healthy food the individual has access, the greater the chance of acquiring healthy food (34). This emphasizes the need for public policies to favor the provision of healthy eating places to impact the health and quality of life of populations (10).
This study has some limitations. Our sample, although large enough to conduct statistical tests, was no probabilistic. Consequently, many of the participants were female, had a high education level, and had financial stability, and 80% were from the Southeast region, limiting the generalizability of the results to the other sociodemographic groups of Brazil. Female response bias is well known in health surveys (35), and in this study, this may have been favored by the network contact list of most people who helped to spread the survey. The financial stability of this sample can be seen in a positive way, as it allowed us to have reliable data. If the population was in a situation of vulnerability or even food insecurity, these conditions would dictate food choices, and an understanding of isolation and the food environment would not be possible. Thus, we know that the (best) choices presented in the outcome did not have a strong influence on the familiar income.
The instrument applied did not allow for the analysis of quantitative indicators of diet quality and respondents’ previous consumption. Limitations regarding the instrument were discussed in a previous publication (5). Although the individuals allocated to the CG and IG had some differences, these differences were controlled by the statistical model and did not impact the results of the diet. The number of participants remained low due to the low follow-up response rate, which may also limit the extrapolation of the results. Attention is drawn to the need for long-term studies with representative populations to better understand the real changes in diet and its effects on health outcomes after the COVID-19 pandemic.
Despite these drawbacks, this study proved to be innovative in comparing the differences in the quality of the diet based on the determinants outlined in the Dietary Guidelines of isolated and no isolated Brazilians, bringing significant considerations about the contextual factors of the food environment in the two moments of the COVID-19 pandemic.
The findings of this study allow us to infer, therefore, that much more than the place of food consumption (being or not in home isolation) what caused the main change in the diet of the CG was being exposed to changes in the environment of purchase of food consumed. In this way, the most restrictive period of the COVID-19 pandemic forced the no isolated population to experience a scenario comparable to a food swamp, negatively affecting their eating pattern. Policies that prioritize a food system with production, access, and consumption in natura or minimally processed foods should be encouraged worldwide to prevent populations from becoming vulnerable to changes in the local economic and administrative system.
No acknowledgement to declare.
The authors declare there are no conflicts of interest.
Publicado: 29/01/2024