
 ,
Samuel Escandón2 ,
Alejandro Rodríguez3 ,
Carl Lachat4 ,
Roberto Aguirre5 ,
Wilma Freire6 , ,
Silvana Donoso2,8 ,
Susana Andrade2,9 ,
Angélica Ochoa-Avilés2,8
,
Samuel Escandón2 ,
Alejandro Rodríguez3 ,
Carl Lachat4 ,
Roberto Aguirre5 ,
Wilma Freire6 , ,
Silvana Donoso2,8 ,
Susana Andrade2,9 ,
Angélica Ochoa-Avilés2,8
Introduction. The intake of energy-dense unhealthy food at school could influence the overall energy intake of children. Objective: To characterize the patterns of buying a snack at school and to analyze the association of these patterns with the source of the school snack (brought from home or bought at school) and screen time. Materials and methods: A cross-sectional study was conducted from October 2018 until May 2019 among school children (9 to 12-year-olds) from Cuenca-Ecuador. Intake of energy-dense unhealthy food groups, the source of the school snack, and screen time were assessed using questionnaires. Multiple correspondence analysis was used to identify intake patterns of unhealthy food groups, and logistic regression to assess the association between intake of energy-dense unhealthy food groups (FG) with the school snack source. Results: Among 1,028 children recruited 63%, 42%, 30% and 22% of the children reported consuming sweets/confiture, savory snacks, fast food, and pastry products, respectively, at least two days per week. Around 39% of the children were classified as “Frequent consumers of energy-dense unhealthy FG”. Buying the snack at school was associated with a more frequent intake of sweets/confiture (OR=1.56, CI 95% =1.05-2.32) and fast food (OR=2.01, CI 95% =1.15-3.50) during the week, as well as with being classified in the “frequent consumer of energy-dense unhealthy FG” (OR=1.99, 95% CI=1.40-2.82). Conclusions: Ecuadorian children still consume prohibited unhealthy foods at school. These results reinforce the importance of evaluating, monitoring, and adapting strategies to promote a balanced diet. Arch Latinoam Nutr 2023; 73(3)S2: 35-46.
Keywords: public policy, food quality, food legislation, school feeding, unhealthy food.
Introducción. La ingesta de alimentos poco saludables con alto contenido energético en la escuela podría influir en la ingesta energética total de los niños. Objetivo: Caracterizar los patrones de compra de snacks en el colegio y analizar la asociación de estos patrones con la procedencia del snack escolar (de la casa o comprada en el colegio) y el tiempo de pantalla. Materiales y métodos: Se realizó un estudio transversal (octubre 2018-mayo 2019) en escolares (9-12 años) Cuenca- Ecuador. La ingesta de grupos de alimentos (FG) no saludables altos en energía, la fuente del snack escolar y el tiempo de pantalla se evaluaron mediante cuestionarios. Se utilizó análisis de correspondencias múltiples para identificar patrones de ingesta de FG poco saludables y la regresión logística para evaluar asociación entre la ingesta FG no saludables con la fuente del snack escolar. Resultados: En 1.028 niños 63%, 42%, 30% y 22% declararon consumir dulces/golosinas, aperitivos salados, comida rápida y productos de pastelería, respectivamente, al menos dos/días/ semana. Un 39% fueron clasificados como “Consumidores frecuentes de FG poco saludables de alta densidad energética”. La compra de los snacks en el colegio se asoció con una ingesta más frecuente de dulces/golosinas (OR=1,56; IC95%=1,05-2,32) y comida rápida (OR=2,01; IC95%=1,15-3,50) durante la semana y con la clasificación en el grupo” consumidores frecuentes de FG poco saludables de alta densidad energética” (OR=1,99; IC95%=1,40- 2,82). Conclusiones: Los niños ecuatorianos aún consumen alimentos no saludables prohibidos en la escuela. Estos resultados refuerzan la importancia de evaluar, monitorear y adaptar estrategias para promover una dieta balanceada. Arch Latinoam Nutr 2023; 73(3)S2: 35-46.
Palabras clave: política pública, calidad de alimentos, legislación alimentaria, alimentación escolar, comida no saludable.
https://doi.org/10.37527/2023.73.S2.005
Autor para la correspondencia: Susana Andrade, e-mail: [email protected]
Obesity prevalence has increased worldwide (1); by 2016, around 340 million children and adolescents were overweight or obese (2). Unhealthy eating and sedentary behavior are important risk factors for obesity and non-communicable diseases (3). In Ecuador, 35% of school-age children are overweight or obese (4), 45% spend more than two hours/day on sedentary screen-related activities (5), and risky dietary practices are prevalent in the adolescent population (6).
Healthy eating promotion requires broad and comprehensive policy actions (7). Food label regulations and food advertisement and marketing restrictions have been recognized as promising approaches (8,9). The last is especially important for children and adolescents, as screen-based sedentary behavior (i.e., TV viewing) is associated with consuming unhealthy energy-dense foods (10–12). In addition, setting standards and offering healthy foods in public institutions such as schools are promising strategies (13).
In Ecuador, two large-scale regulations are in place. Ecuador was the first Latin American country to implement food label standards in 2013. All processed and ultra-processed foods and beverages with added sugar, fat, or salt must carry a traffic-light-food label(14). The system classifies food items as low (green), medium (yellow), or high (red) in total fat, sugar, and salt content according to predefined concentrations (14). Secondly, the regulation of school food kiosks was issued in 2014. The kiosks must guarantee a variety of fresh and nutritious foods and beverages with a preference for traditional recipes; processed and ultra-processed foods and beverages with a red traffic-light, caffeinated, and energy drinks or drinks with non-caloric sweeteners are forbidden (15).
A priori impact evaluation of the regulations was not planned (15). The available evaluations have analyzed the implementation qualitatively or have quantified the (un) availability of (un)healthy foods in the school kiosks (16). Until now, no representative study has quantified which foods children buy at school kiosks; or has described the relationship between buying snacks at school and the intake of unhealthy energy-dense food groups.
The present study aims to: (i) characterize the overall intake of energy-dense unhealthy food groups (i.e., savory snacks, sweets, soft drinks, fast food, and pastry products) among schoolchildren; (ii) identify food groups that are usually consumed at school; and (iii) evaluate if buying a snack at school is associated with the overall intake of unhealthy energy-dense food groups among schoolgoing children. The analysis will include important covariates (i.e., age, sex, weight status, socioeconomic level) and screen time as a predictor, considering that specific policies targeting food marketing and advertisement exposure among children are not in force.
A cross-sectional study involving children aged 9 to 12 was conducted in Cuenca from October 2018 until May 2019.The city is the third most populated in Ecuador (around 600,0000 citizens), located in the Andean highlands(17). The Ecuadorian education system comprises public schools (the government fully subsidizes), partly subsidized schools (partly subsidized by the government and the parents), and private schools (parents cover the full tuition ranging from 70 to 400 USD/month)(18).
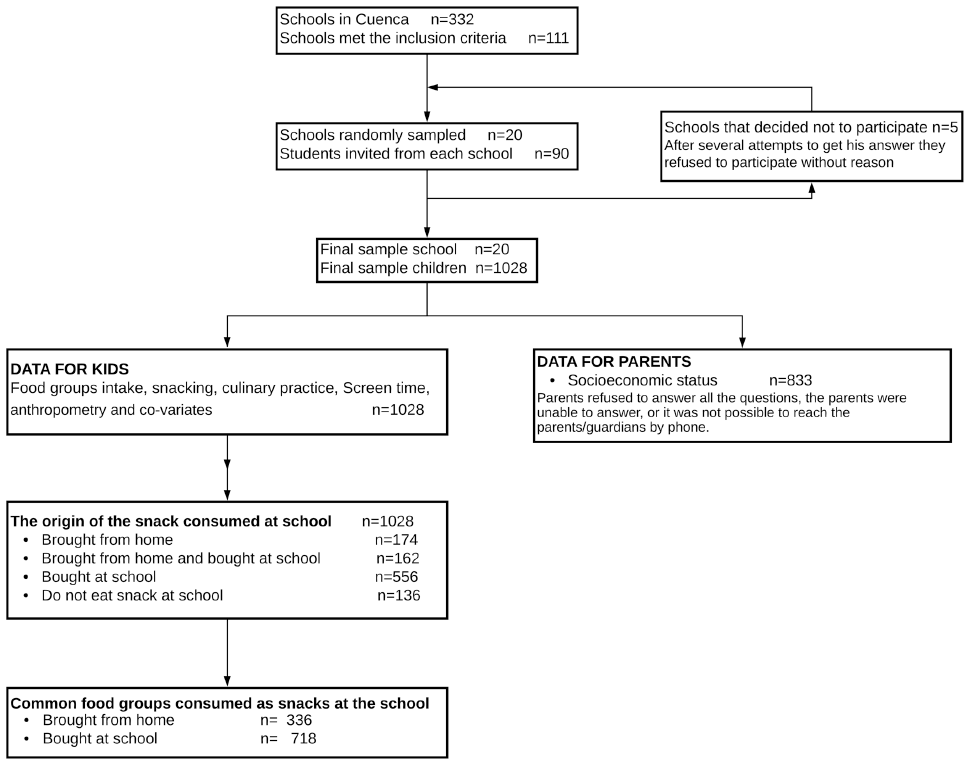
This research is derived from a study that analyzed the individual and environmental factors associated with school children's health(19); therefore, the sample size of 934 was considered sufficient to detect these associations with a power of 85% and a cluster effect of two. A total of 20 schools were selected following a probability proportional to sample size procedure according to walkability index and neighborhood socioeconomic status of each school (20). In each selected school, 90 randomly students were invited to participate. All children with disabilities and pathologies that influence their usual diet or physical activity were excluded (flowchart in Figure 1).
The Ethics Committee from Universidad San Francisco de Quito approved the survey instruments and the study protocol (No. 2017-090E, 2019-001E). All children and their parents/guardians signed written consent.
Trained interviewers were in charge to apply questionnaires, following standardized procedures, that were adapted to the context and validated with children outside the study sample.
Parents/guardians filled out the national survey on socioeconomic stratification (21) with a total score between 0 and 1000. A household was classified as low, medium and high socioeconomic status when the index was between 0-535, 536-696, and above 697, respectively.
The child's ethnicity, age, sex, food intake, screen time, and anthropometric data was collected by using Kobo Toolbox (Harvard Humanitarian Initiative) on tablets.
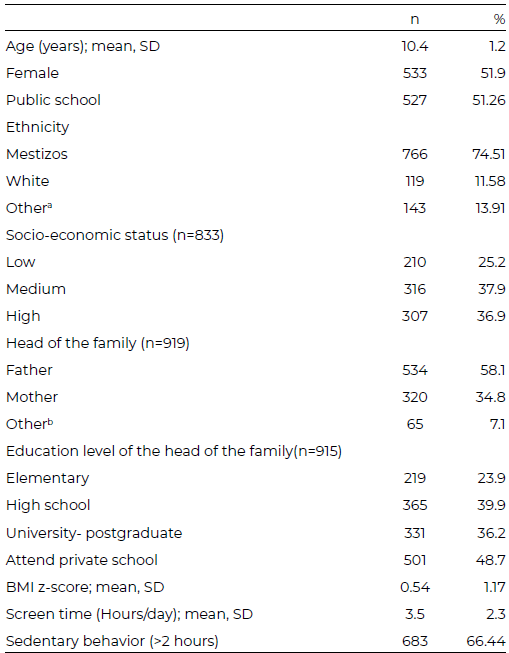
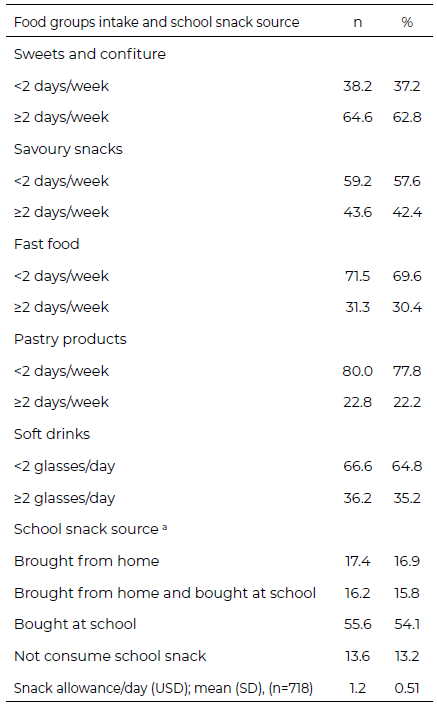
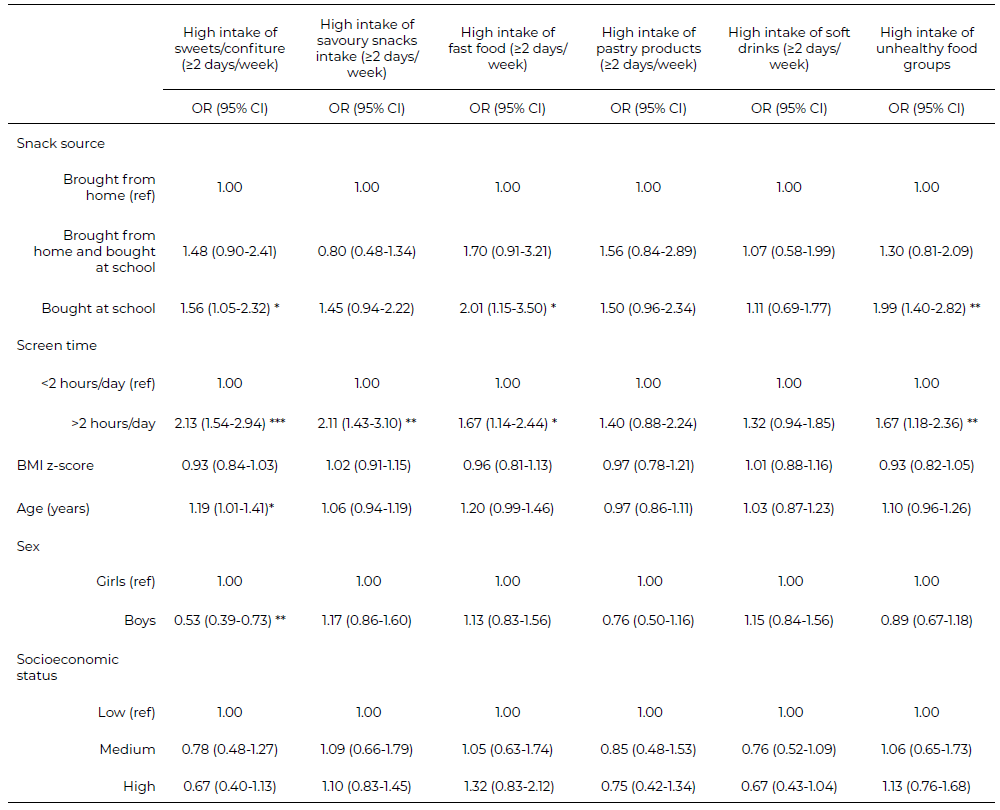
Intake of energy-dense unhealthy food groups in the previous week was assessed using a validated tool for Chilean children (22). Soft drink intake, including soda and processed and ultra- processed drinks, was reported as glasses consumed per day; the intake was categorized as Choose one option regarding the snack you eat at school during school hours: "You bring it from home, and you do not bring money", "You bring money to buy it", "You bring food from home and bring money to buy it", and "You do not eat a snack at school" (22). The daily snack allowance was registered for those who reported bringing money to buy snacks at school.The food groups usually consumed as school snacks were characterized for the children who reported "bringing their snack from home" and/or "buying it at school". Screen time (min/day) after school hours during weekdays was measured using a Spanish version of the survey iHealth (24)(19). Total screen time in minutes included the time spent per day watching television/videos/ DVD/Netflix, sedentary games (computer or consoles), and using the internet for leisure activities (social networks, YouTube). Screen time was categorized as inadequate when children spend > two hours and adequate for ≤ two hours (25,26). Body weight and height were taken in duplicate (27) and a third measurement was taken in the case of a 2% difference. The arithmetic average of the two or three measurements was used to calculate children's body mass index (kg/m²) and BMI z- (28,29). Descriptive statistics are presented as percentages for categorical variables and mean ± standard deviation for continuous variables. Data management and analysis were performed using STATA (version 13, STATA Corp). All the analyses were adjusted for the cluster design using "svy" command. Hypothesis tests were performed with 0.05 alpha levels. According to its source (brought from home or bought at school), food groups consumed as school snacks (fruits, vegetables, savory snacks, sweets snacks, dairy, water, sugar drinks, non-sugar drinks, sandwiches, and rice) were displayed using bar charts. Differences in food groups reported according to the source of the snack consumed at school were assessed using the test of two proportions. Multiple correspondence analysis (MCA) was used to identify consumption patterns based on energy- dense unhealthy food groups (fast food, savory snacks, sweets/confiture, pastry products, and soft drinks). The technique analyses the relationships between several categorical dependent variables to produce a graphic illustration of the original information in a low dimensional space. Five dimensions were explored, and two dimensions were chosen based on the alpha Cronbach coefficient, the percentage of variance explained, and associations between each variable with each dimension. A graphical display of food groups and subjects (children) was constructed using the two dimensions to identify consumption patterns. Having identified three consumption patterns of energy-dense unhealthy food groups intake, we used cluster analysis to classify children in each consumption pattern based on the z-values of MCA for the two selected dimensions. A scatter plot was constructed to outline how cluster analysis assigned children to each pattern. To confirm the MCA model's interpretability, cross tabulation frequencies and X2 test were used to identify clusters' differences in food group intake. Logistic regression models were applied to assess if the school snack source and screen time were associated with the overall unhealthy food intake. Dependent variable in each model was the intake of sweets, savory snacks, fast food, pastry products, soft drinks, and the intake pattern of unhealthy food groups. For the latter variable, the three patterns of intake of unhealthy food groups (resulting in MCA analysis) were reduced to two groups ("Less frequent" and "Regular consumers" groups were merged into one category). The independent variables included school snacks source and screen time. Also, the models were adjusted for age, sex, BMI z-scores, and socioeconomic level. Results are displayed as odds ratios (OR). A total of 1,028 children (48% attending private schools) were recruited. The average age of the children was 10.4±1.2 years; 52% were female, and 75% identified themselves as mestizos. Also, 37%, 38%, and 25% of the children lived in high, medium, and low SES households, respectively. In 58% of the cases, the father was the head of the family, followed by the mother (35%). In total, 40% and 36% of the head of the family hold secondary and university or postgraduate degree, respectively. On average, the children spent 3.5±2.3 hours/day on screen-time-related sedentary activities during school days, and 66.4% of children spent more than two hours on screen-timerelated sedentary activities (Table 1). Sweets/confiture and savory snacks intake for two or more days per week were reported by 63% and 42% of the children, respectively. In total, 30% and 22% of participants consumed fast food and pastry products at least twice weekly, respectively (Table 2). The MCA and cluster analysis identified three groups (i.e., patterns) based on the intake of energydense unhealthy food groups (Figure 2a). The first pattern was named "Less frequent consumers" and was associated with those children who do not consume food from unhealthy food groups. The second pattern was called "Regular consumers" and was associated with those children who consume fast food, savory snacks, sweets/ confiture, and pastry products once a week and once a day for soft drinks. The last pattern was named "Frequent consumers" and was associated with those children who consume more than twice a week fast food, savory snacks, sweets/confiture, pastry products, and more than twice a day for soft drinks. Most of the children were clustered in the "Regular consumers" (40.5%) and "Frequent consumers" (39.3%) groups, and 20.2% in the "Less frequent consumers" cluster (Figure 2b shows clusters according to MCA's Z values). In total 54% of children bought their snacks at school (n=718, average snack allowance was 1.2±0.5 USD per day); 17% brought their snacks from home, and 16% combined both practices (i.e., both brought from home and bought at school) (Table 2). The proportion of food groups consumed as school snacks by source (bought at school or brought from home) is presented in Figure 3. In summary, the proportion of children that reported having fruit, vegetable and dairy products as a snack were higher among those who brought from home the snack in comparison who bought at school (p-values <0.001). An important percentage of the participants reported the consumption of sweets and soft drinks as school snacks, although these percentage was higher among children who bought their snacks at school (sweets: 32% at school vs. 22% from home p<0.001; soft drinks 37% at school vs. 30% from home, p=0.037). There were no differences in the water (p=0.349) and savory snacks intake (p=0.973) between the children who brought their snacks from home compared with those who bought them at school. Twenty-four percent of the children who reported bringing money to school indicated buying fast food (data unavailable for children bringing their snacks from home). Associations between school snack source and screen time with a weekly or daily intake of energy-dense unhealthy food groups Buying the snack at school was associated with a more frequent intake of sweets/confiture (OR=1.56, 95% CI=1.05-2.32, p<0.05) and fast food (OR=2.01, 95% CI=1.15-3.50, p<0.05) over the week. Bringing money to buy snacks in the school kiosks was associated with being classified as the frequent consumer of energy-dense unhealthy food group (OR=1.99, 95% CI=1.40- 2.82, p<0.01). Spending two or more hours per day on screen devices was associated with a more frequent intake of sweets (OR=2.13, 95% CI=1.54-2.94, p<0.001), savory snacks (OR=2.11, 95% CI=1.43-3.10, p<0.01) and fast food (OR=1.67, 95% CI=1.14-2.44, p<0.05). Finally, spending two or more hours per day on screens was independently associated with being classified as frequent consumer of energy-dense unhealthy food group (OR=1.67, 95% CI=1.18-2.36, p<0.01) (Table 3). Our study documents how urban Ecuadorian children maintain unhealthy dietary behaviors that could be conducive to non-communicable diseases. Even though selling processed and ultra-processed foods and beverages with a red traffic light or with non- caloric sweeteners is forbidden at schools, our analysis suggests that buying food in the school kiosks is prevalent and associated with the intake of energy- dense unhealthy ultra-processed food groups over the week. Two out of ten children reported buying fast food or savory snacks at school, three out of ten reported buying sweets and confiture and four out of ten bought soft drinks at school. The last can be an indirect indicator of the school food kiosks regulation compliance. The reasons for these results are diverse; according to the available data, the strategy seems not to be evaluated, updated or designed, considering the contextual and cultural aspects of the available evidence (15,30). In this context, in April 2020, during the COVID-19 lockdown, the national parliament issued a national school food policy (30). The last demonstrated interest in the topic from policymakers. Nevertheless, the policy seems not to have developed considering the local problems, barriers and facilitators, and local context in general. In addition, as far as we know, the policy was developed without the participation of local stakeholders and seemed not to be developed according to the available evidence of successful strategies. As a result, the strategies described are succinct. The policy focuses exclusively on food availability without considering other influential factors. Furthermore, details about forbidden or allowed food items are not included; for example, nothing is mentioned about micronutrient content, type of fat, refined cereals, artificial sweeteners, processed and ultra-posseted foods or food labels (30). Although in- person classes in the national school system started progressively in September 2021 (31), we could not find any additional update or plan to implement or evaluate the national food policy. The large body of evidence must be considered to improve the strategies; in that sense, a recent systematic review of qualitative studies identified several barriers regarding the compliance of school food policies which seem not to be considered in the current policy (32). The most common barriers include reductions in profit or revenues, availability of unhealthy food in the school proximities and, sociocultural aspects such as poor knowledge in the community or negative attitudes of local stakeholders towards the policies. These barriers have been previously identified in local qualitative and contextual research (16,33,34). Food kiosks owners often complain about the large availability of street vendors in the school surroundings or the poor preference of children to acquire fruit and vegetables, resulting in considerable food waste and profit losses. Besides, our data demonstrate that although the snacks sent from home seem to be healthier (16), a large proportion of parents (19-30%) sent savory snacks, sweets/confiture and soft drinks for the school snack. Previous studies performed in Cuenca demonstrated that poor parental knowledge, lack of time to prepare healthy snacks, children's financial autonomy, parental permissiveness, and unfavorable school support are influential factors for (un)healthy eating behaviors among schoolchildren and adolescents (35). None of these contextual and influential factors is considered in the school food policy. Children in Ecuador are exposed to marketing and advertisement (6,36). Our results show that children spend an average of 3.5 h/day on sedentary screen activities, and 66.4% of children spend more than two hours on sedentary screen activities during school days. These figures seem to have increased, a study published in 2015 reported that Ecuadorian adolescents spent on average 2.2 h/day in sedentary acidities (37), similarly, according to the national health survey performed in 2012, only 44.5% of children and adolescents exceeded two hours per day on screen-time sedentary activities (5). Worryingly, our data suggest that spending more time on screen devices is associated with a pattern of intake of energy-dense ultra-processed unhealthy foods. Previous research indicated that sedentary screen time activities, such as high TV exposure, could be associated with a high intake of unhealthy food (38,39). The last could be explained due to non-conscious eating (40). Besides, children are exposed to marketing during TV advertising, which promotes high-calorie products (10). These results highlight the urgent need to regulate food advertisements and marketing in TV, social media, and the school setting. According to the new school food policy, "The national health authority will coordinate with the competent Regulatory and Control Agency the restriction of advertising processed or ultra-processed foods and beverages with high salt, sugar and fat as well as those containing sweeteners". Once again, this is a good starting point that must be clarified to avoid ambiguity. For example, it is unclear if the traffic-light food label will be used to define the high content of salt, sugar and fat, and implementation details are not specified. Undoubtedly, the school environment plays a crucial role in children's eating habits due to their time in school; for many children, at least two meals take place there (11). Our results highlight that purchasing food at school and sedentary screen time are potentially important and independent risk factors for unhealthy eating behaviors. Therefore, both factors should be the target of ongoing and future policy actions to enhance a more significant impact on children's health. One of the limitations of this study was that certain food groups were not considered (e.g., meat or fish) in the questionnaire used. Since this is a cross-sectional study, causation cannot be inferred. Nevertheless, considering the absence of formal evaluations, our results reasonably estimate the school food kiosks regulation compliance. We included a randomly selected representative sample of children living in urban areas; our data can be extrapolated to other urban settings in Ecuador. This cross-sectional documents how Ecuadorian children maintain unhealthy food intake practices conducive to non- communicable diseases. Although the regulation of the school food kiosks had been in force, the school still seems to be a source of intake of unhealthy food groups. Furthermore, screen time is strongly associated with unhealthy dietary patterns. More robust evidence-based policies are urgently needed to ensure that schools are healthy and supportive environments. Policymakers need to recognize the need to design culturally appropriate evidence-based strategies, which must be evaluated and adapted using good-quality research. We are grateful to the parents, schools, students, authorities, and all the members of the project, especially to Elisabeth Rodas, Jorge Brito and Adriana Quezada for their insight and initial support. This work was developed within a joint postgraduate program of VLIR Network Ecuador. The authors declare that the research was conducted in the absence of any commercial or financial relationships that could be construed as a potential conflict of interest. Publicado: 29/01/2024Statistical analysis
Food groups intake according to school snack source
Unhealthy food groups' intake patterns
Predictors of daily or weekly intake of energy-dense unhealthy food groups
Results
Energy-dense unhealthy food groups intake
aSource of the food where children obtain their food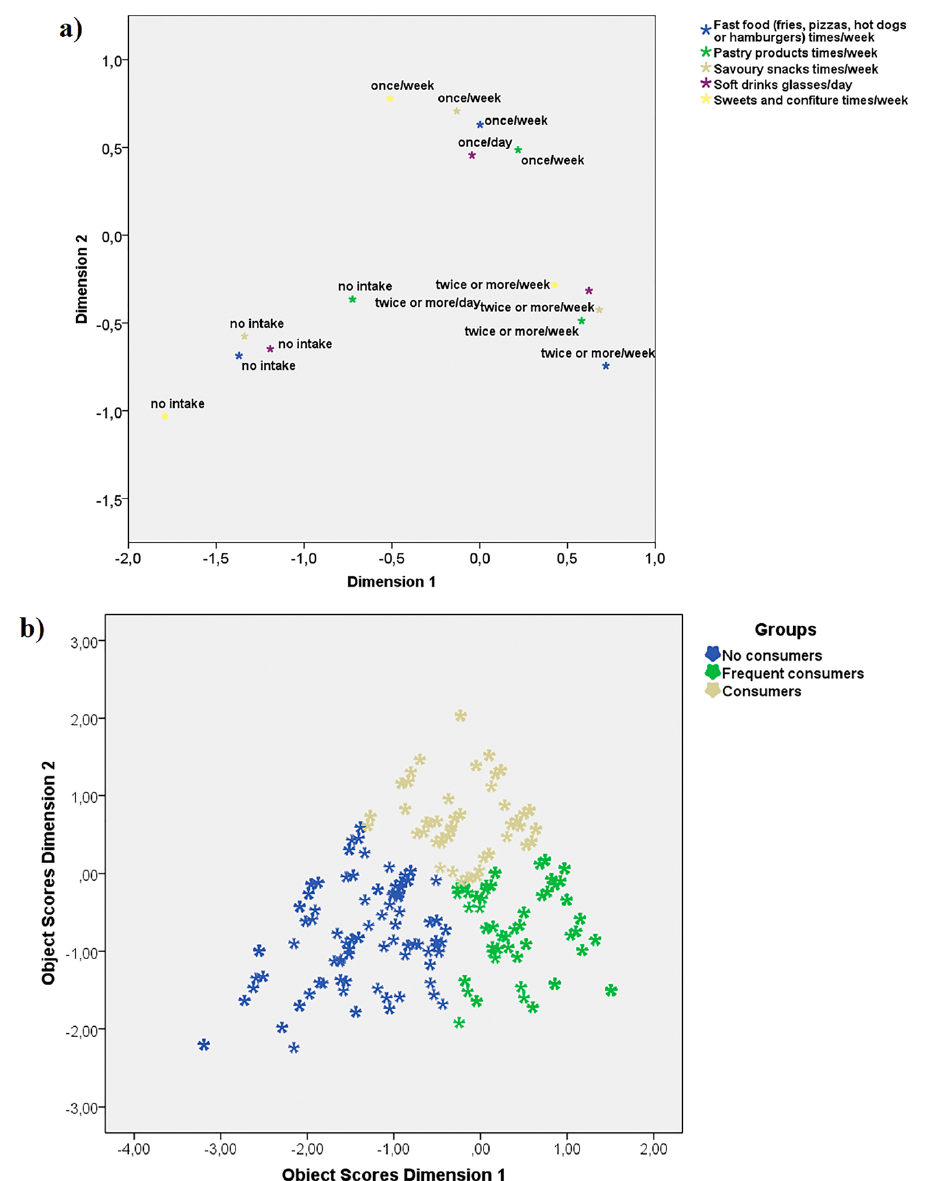
School snacks
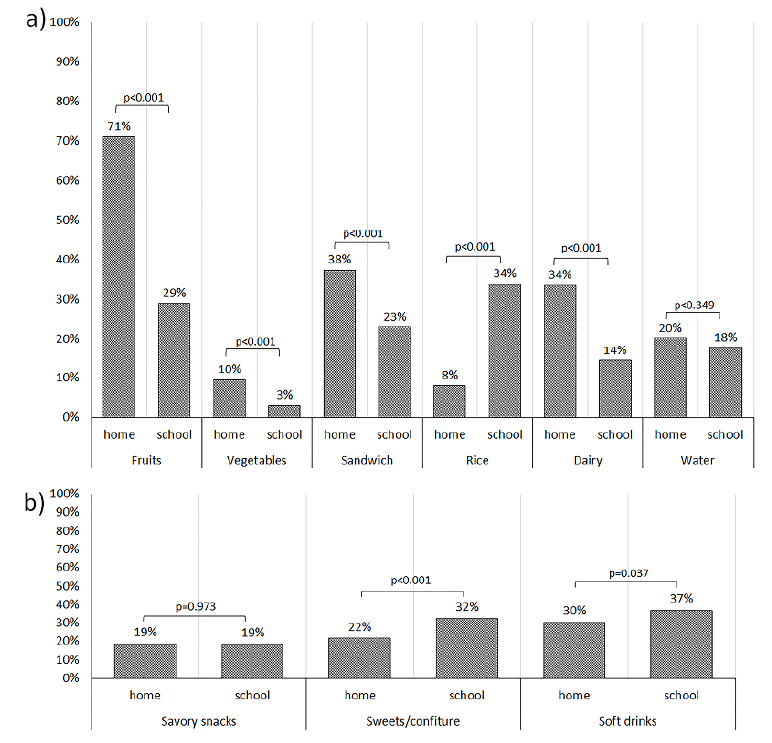
a Brought from home include children who reported bringing their snacks from home and do not bring money, and those who reported bringing food from home and also bringing money to buy it (n=336)
b Bought at school include children who reported bringing money to buy their snack exclusively (n=556)Discussion
Conclusions
Acknowledgments
Conflict of Interest
REFERENCIAS