
 ,
Romina Buffarini3 ,
Andrea Gomez4 ,
Simone Farías-Antúnez3 ,
Andrea Mary Fletcher5 ,
Lucía Gómez Garbero1 ,
Augusto Ferreira Umpiérrez1 ,
Marlos Rodrigues Domingues3 ,
Mariângela Freitas da Silveira3
,
Romina Buffarini3 ,
Andrea Gomez4 ,
Simone Farías-Antúnez3 ,
Andrea Mary Fletcher5 ,
Lucía Gómez Garbero1 ,
Augusto Ferreira Umpiérrez1 ,
Marlos Rodrigues Domingues3 ,
Mariângela Freitas da Silveira3
Introduction. There is growing consensus globally that the consumption of ultra- processed food (UPF) can negatively affect the nutritional status of children. Objective. The present study aims to evaluate associations between the consumption of UPF and the nutritional status in a sample of Uruguayan and Brazilian preschoolers belonging to two studies: the ENDIS Study and the Pelotas 2015 Birth Cohort. Materials and methods. We conducted a cross-sectional analysis. The main outcome measure was obesity defined as BMI for age and sex ≥ +3 z-scores. The score of UPF consumption was the main exposure measured. Each positive answer of habitual intake was added up to create a UPF score ranging from zero to six or more UPF. Crude and adjusted logistic regressions were performed for the associations between UPF consumption and nutritional status in preschoolers. Results. The final sample consisted of 8,687 preschool children, 50.8% belonging to the Uruguayan study, while the remaining 49.2% belonged to the Brazilian study. Nearly 5% of the sample of young children were obese. We didn’t observe a relationship between the score of UPF consumption and obesity, the odds ratio (OR) was 1.04 (95% CI, 1.00–1.09). Adjustments resulted in modest attenuation of the relationship and a lack of statistical significance. However, in children under 48 months, the score of UPF consumption was directly associated with childhood obesity. Conclusions. Results suggest that higher consumption of UPF is associated with obesity in Uruguayan and Brazilian preschool children under 4 years of age. These findings suggest that actions to reduce ultra- processed food consumption could lead to diminish obesity patterns and bring important public health benefits. Arch Latinoam Nutr 2023; 73(3)S2: 47-57.
Keywords: child, childhood obesity, eating behavior, ultra-processed foods, body mass index.
Introducción. Existe creciente consenso a nivel mundial de que el consumo de alimentos ultraprocesados puede afectar negativamente el estado nutricional de los niños. Objetivo. El presente estudio tiene como objetivo evaluar asociaciones entre el consumo de ultraprocesados y el estado nutricional en una muestra de preescolares uruguayos y brasileños pertenecientes a dos estudios: el Estudio ENDIS y la Cohorte de Nacimiento de Pelotas 2015. Materiales y métodos. Se realizó un análisis transversal. La principal medida de resultado fue la obesidad definida como el IMC/edad y sexo ≥ +3 puntuaciones z. La puntuación del consumo de ultraprocesados fue la principal exposición. Cada respuesta positiva de la ingesta habitual se sumó para crear una puntuación de ultraprocesados que oscilaba entre cero y seis o más. Se realizaron regresiones logísticas crudas y ajustadas. Resultados. La muestra final estuvo constituida por 8.687 niños, de los cuales el 50,8% pertenecía al estudio uruguayo, mientras que el 49,2% restante pertenecía al estudio brasileño. Casi el 5% de la muestra de niños pequeños eran obesos. No observamos relación entre la puntuación del consumo de ultraprocesados y la obesidad, el odds ratio (OR) fue de 1,04 (IC 95%, 1,00-1,09). Los ajustes dieron lugar a modesta atenuación de la relación y falta de significación estadística. Sin embargo, en menores de 48 meses la puntuación de consumo de ultraprocesados se asoció directamente con la obesidad infantil. Conclusiones. Los resultados sugieren que un mayor consumo de ultraprocesados se asocia con obesidad en prescolares uruguayos y brasileños menores de 4 años. Estos hallazgos sugieren que las acciones para reducir el consumo de alimentos ultraprocesados podrían conducir a una disminución de los patrones de obesidad y traer importantes beneficios para la salud pública. Arch Latinoam Nutr 2023; 73(3)S2: 47-57.
Palabras clave: niño, obesidad infantil, conducta alimentaria, alimentos procesados, índice de masa corporal.
https://doi.org/10.37527/2023.73.S2.006
Autor para la correspondencia: Isabel Pereyra-González, e-mail: [email protected].
Ultra-processed food (UPF) is defined as formulations of ingredients, mostly of exclusive industrial use, typically created by a series of industrial techniques and processes (1). Globally, there is growing evidence of the detrimental effects that UPF consumption can have on health across the life course (2–4). The Working Group on Science and Evidence for Ending Childhood Obesity of the World Health Organization (WHO) published evidence that modifiable risk factors such as lack or short breastfeeding duration, poor dietary habits (high calories, sugar and fat foods), lack of physical activity, obesogenic family environment and distorted sleeping patterns can cause excess weight gain in children (5). Some studies have found that preschool and school-aged children with higher UPF consumption had higher body mass index (BMI) or fat mass index, although literature in this area is still scarce (6,7). The convenience of UPFs due to their low cost, highly palatable and addictive taste, ease of accessibility, readiness-to- consume with minimal preparation, and persuasive marketing, which may promote overconsumption, led to these foods being consumed more than any other type of food, despite public health campaigns encouraging people to avoid over-consumption of these products (7–12). Research examining the UPF contribution to total energy intake in young children is minimal, however, one study from New Zealand identified that 45% of the energy intake in children from 1 year of age was from UPF and increased to 51% by 5 years of age, indicating that UPF contributed a substantial amount of energy to the diets of young children (13).
The Pan-American Health Organization has determined that over recent years sales of ultra-processed products have risen rapidly, including in Brazil and Uruguay (2,14). It has also been determined in Brazil that the price of UPF has been inversely associated with the prevalence of being overweight and obese, with a higher prevalence in low socioeconomic populations (10). A recent publication showed that Uruguayan schoolchildren are consuming calories in excess and that UPFs comprised 28% of their daily intake on average (15).
Although many studies highlight the importance of UPF consumption in school-age children, there is less available information focusing on younger children, and there is even less available research in these two countries investigating associations with the demographic, socioeconomic, and nutritional status of these children. The present study aims to evaluate associations between the consumption of UPF and the nutritional status in a sample of Uruguayan and Brazilian preschoolers belonging to two studies: the ENDIS Study and the Pelotas 2015 Birth Cohort.
We conducted a cross-sectional secondary data analysis using data population-based surveys. Data were collected in the “Encuesta de Nutrición, Desarrollo Infantil y Salud” (ENDIS), conducted by the Uruguayan Ministry of Social Development and the Pelotas 2015 Birth Cohort from Brazil.
The ENDIS assessed representative samples of children from urban locations. The analytical sample of this survey comprised 939 children from the 2013-14 survey, 1637 children from the 2015-16, and 1421 children from the 2018 survey. Our analytic sample for the whole country had 3,997 children
The Brazilian survey included all live births in Pelotas in 2015, from mothers living in the urban area of the city (4,387 live births). Our analytic sample had 4,275 children (16).
Our estimated sample size was informed by the results of Corvalan et al. who described a prevalence of overweight and obesity in Brazil and Uruguay of 7.3% and 7.2% respectively in children under 5 years (17). Assuming that the intake of UFP would increase the prevalence of obesity in children and the effect size of odds ratio (OR) would be similar to the study of da Costa et al. (18), with 90 % power assuming a two-sided test at alpha = 0.05, the final sample size would be of at least of 242 young children with obesity and the same amount without obesity.
Anthropometric measurements were performed by trained field workers. In Uruguay data was collected using a Seca scale (sensitivity of 0.1 kg) and stadiometer (sensitivity of 0.5 cm). In Brazil, a TANITA® scale (model UM-080, sensitivity of 0.1 kg) and Harpenden® stadiometer (sensitivity of 0.1 cm) were used. Our main outcome was obesity (BMI z-score for age and sex ≥ +3) (19). Anthropometric data were processed using Anthro Plus software from the World Health Organization (version 1.0.4; World Health Organization; Geneva, Switzerland) (20).
UPF groups were considered: processed meat products (hamburgers, hot dogs, and poultry/fish nuggets), ready to heat and/or eat food (soup, pure, stock cubes, fried potatoes, instant noodles), packaged dairy desserts, sweets (i.e. candy, chocolate, jelly, ice cream), cookies (i.e. biscuits, cakes), chips, chocolate milk, and sweetened drinks (i.e. soft drinks or artificial juices). A UPF score ranging was created by summing positive responses for each group. The score of UPF consumption was the main exposure.
The following variables were used as possible confounders: country, child’s sex, age in months, weight at birth z-scores, maternal education, family income and exclusive breastfeeding duration (EBF) (quintiles and terciles).
Multilevel analysis was considered with the intention to nest the individuals within groups (studies or countries). The intraclass correlation coefficient (ICC) was low, so we used the fixed effects approach.
Student's T-test, ANOVA and 2 test were applied to compare continuous variables and categorical variables, respectively. Logistic regressions analyses were performed with and without adjustment. We analyzed by data pool and separately by surveys and age (cut-off point 4 years), considering differences in the descriptive analysis. Statistical significance was set at p<0.05. Statistical analyses were performed in R version 4.1.1.
ENDIS study was approved by the Ethics Committee from the University of the Republic of Uruguay (Resolution no. 159, file number 070153- 000486-13) and Pelotas 2015 Birth Cohort was approved by the School of Physical Education (ESEF) Ethics Committee (approval number 26746414.5.0000.5313) for Brazilian participants. Written informed consent was obtained from the child´s responsible adult.
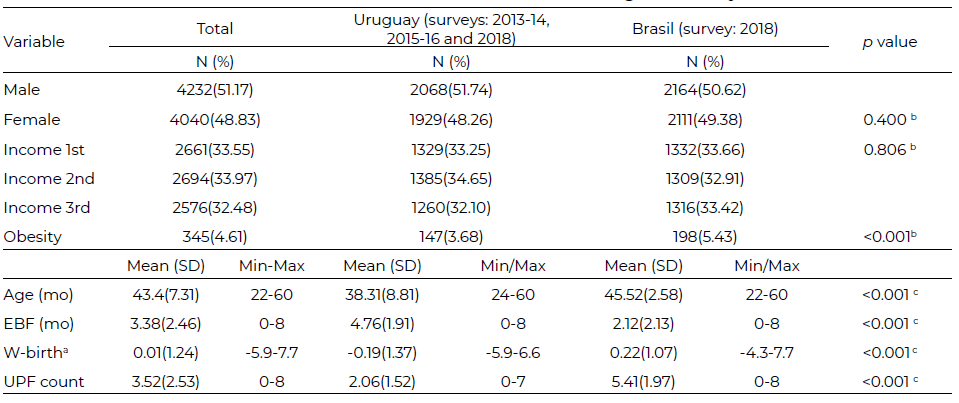
Table 1 provides the sociodemographic characteristics of the total sample and by country. The mean age was about 43.4 (SD±7.31) months and there was a similar proportion of female and male children. The overall prevalence of childhood obesity was 4.61%. Brazilian preschoolers had a higher prevalence of obesity (5.43%) than Uruguayan (3.68%, p < 0.001). The mean breastfeeding duration was 3.38 (SD ± 2.46) months. The mean score of UPF consumption in the total sample was 3.52 (SD ± 2.53). The mean z Weight at birth was 0,01 (SD±1.24) with statistical differences between countries.
Household socioeconomic characteristics and descriptive information on the children´s nutritional status according to the survey are presented in Table 2. The prevalence of obesity ranged from 2.41% in the Uruguayan 2013-14 survey to 5.43% in the Brazilian cohort.
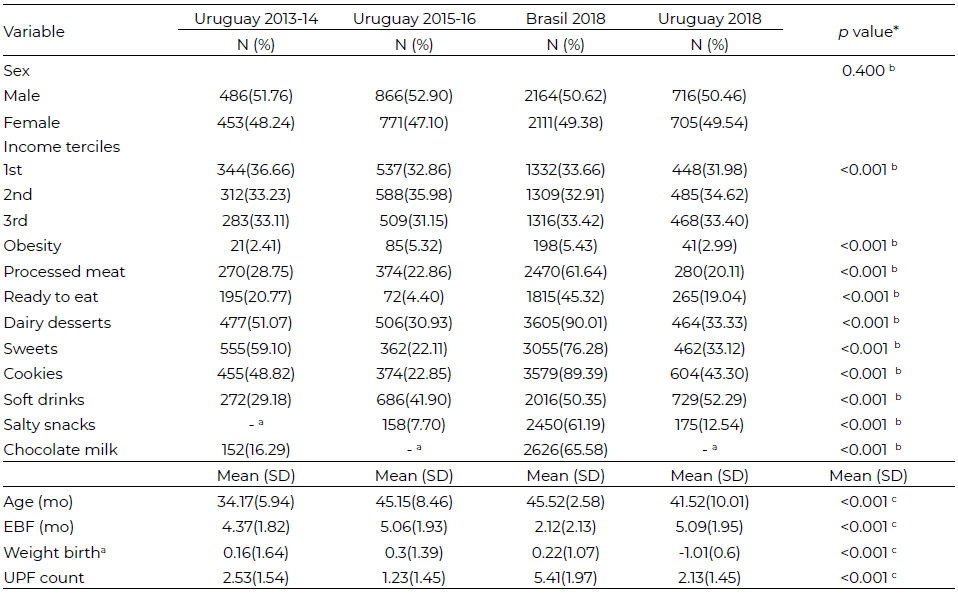
In Brazil, the mean of UPF intake was almost 5 groups, while in Uruguay, among 1 to almost 3 (2.53 at 2013-14, 1.23 for the 2015-16-and 2.13 for the 2018 survey). With respect to the eight groups of UPF analyzed, the UPF groups that were more frequently consumed were dairy desserts, cookies, sweets (i.e. candy, chocolate, jelly, ice cream) and soft drinks.
The survey with the higher proportions of UPF consumption for individual groups was the Brazilian, where 90.01% of the included children consumed packaged dairy desserts, 89.39% frequently ate cookies, and 76.28% sweets. In Uruguay, the survey with the higher proportions was the 2013-14 survey with 51.07%, 48.82%, and 59.10% for dairy desserts, cookies and sweets, respectively (Table 2).
Table 3 showed the prevalence of obesity according to socio-demographic characteristics, exclusive breastfeeding duration and UPF intake groups and UPF score. Results showed that obesity was higher among older children (mean age of children with obesity 44.88 months and 43.35 months in children without obesity, p<0.001) and those with higher weight z-scores at birth (8.25% in children with z-score higher than 1, p=0.000).
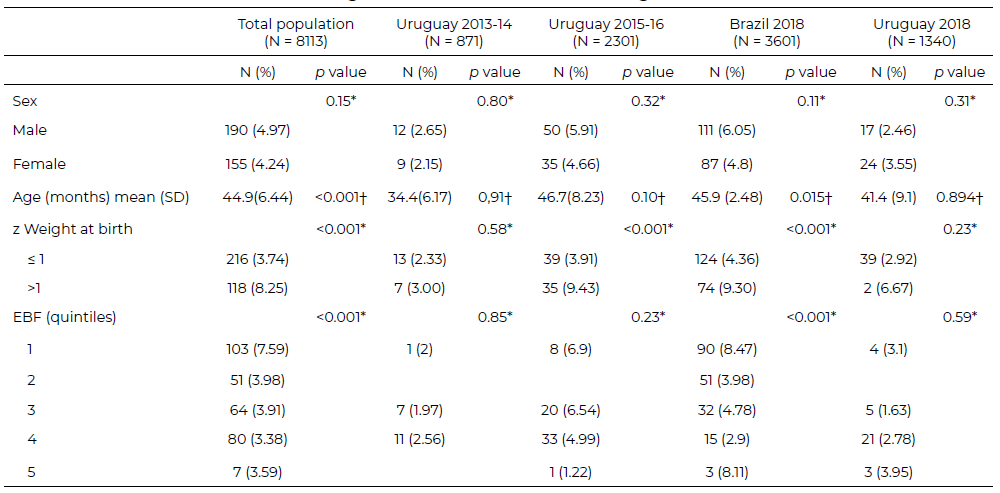
Exclusive breastfeeding duration was associated with the prevalence of obesity in the studied children, the first quintile (shorter time) doubled the prevalence with respect to the others (p <0.001).
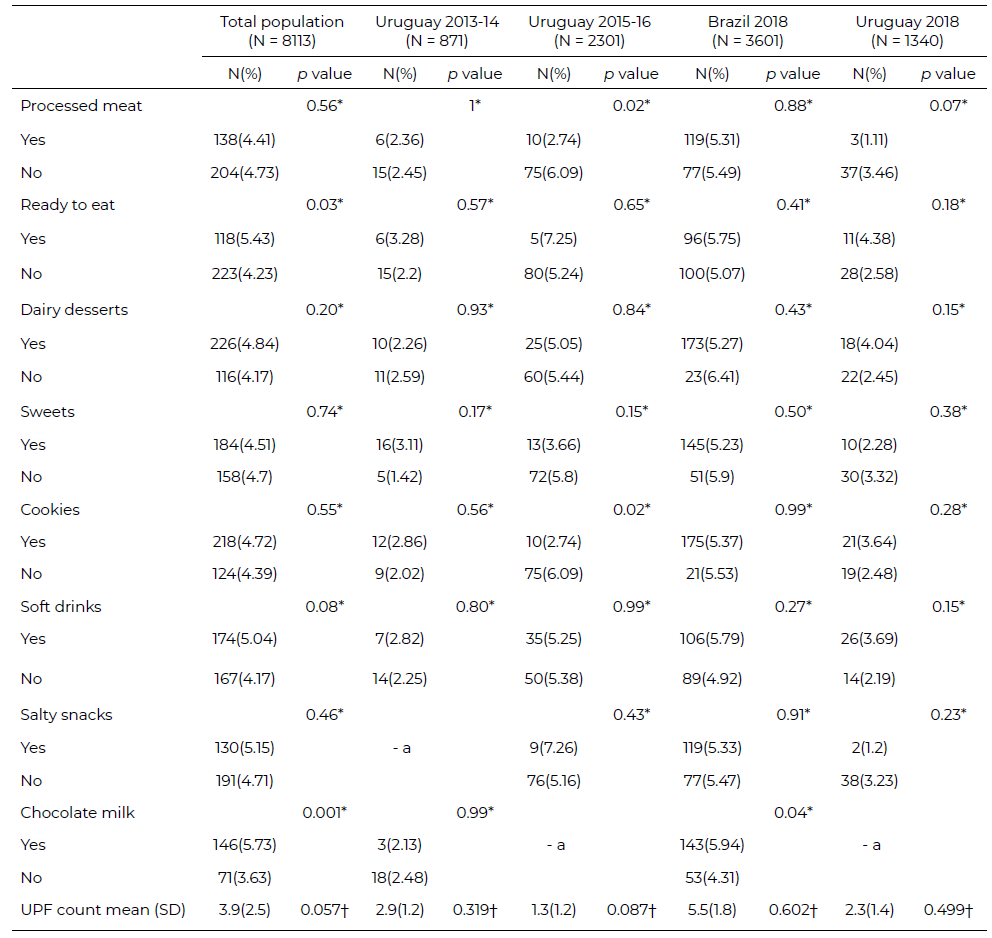
Among the individual UPF groups included in the analysis, the consumption of packaged or ready to heat and eat meals determined a prevalence of obesity of 5.43% in the group of regular consumers compared to 4.23% for those who do not (p: 0.029). The intake of chocolate milk was associated with higher prevalence of obesity in early childhood, 5.73% in the group that consumed this on a regular basis compared with infrequent consumers (3.63%, p: 0.001). No relationship found between the number of UPFs eaten by children with obesity, however, children without obesity consumed less UPF than children with obesity (3.4 and 3.9 respectively) (Table 4).
In table 5 presents the crude and adjusted associations between obesity and the score of UPF consumption. We did not observe a relationship between the score of UPF consumption and obesity, the odds ratio (OR) was 1.04 (95% CI, 1.00–1.09). Adjustments resulted in a modest attenuation of the relationship and lack of statistical significance. Since the associations were similar by sex, the final analysis was not stratified. No association between the score of UPF consumption and obesity was observed in each survey separately.
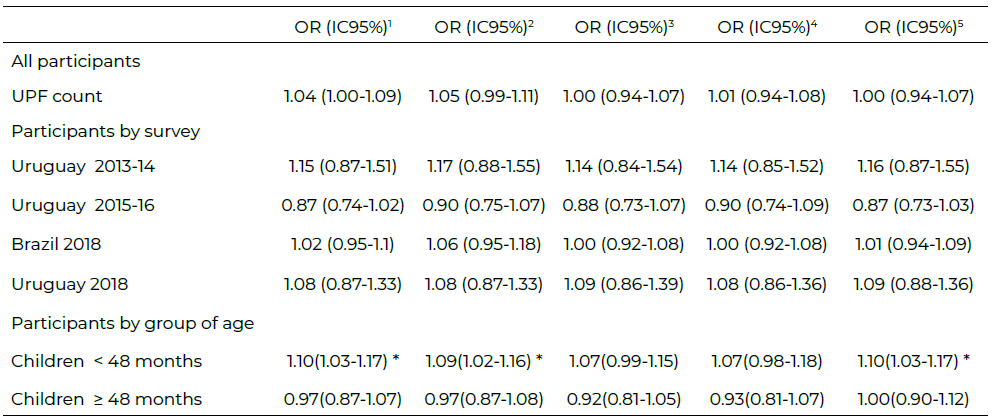
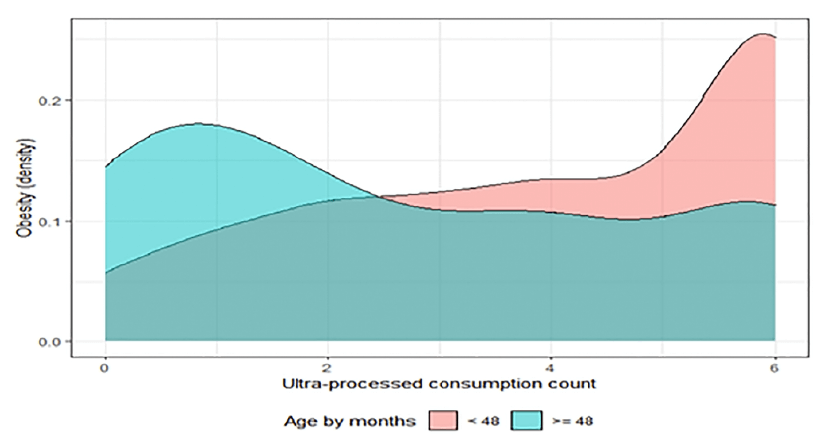
The crude analyses showed that the UPF score consumption was directly associated with childhood obesity in children under 48 months. The likelihood of obesity increased by 10% per each point of the score of UPF consumption. Adjusted models (child sex, birth weight, family income and survey) did not show a difference in results. Further adjustment for the duration of exclusive breastfeeding resulted in a lack of association of obesity with the UPF consumption score. No associations were observed between UPF score and obesity in older children. Additionally, a density plot (Kernel smoothing plot) was performed to display the association based on the analysis by age groups and allow for smoother distributions by smoothing out the noise. The Figure 1 shows the distribution of obesity data over the UPF score. The peaks of the density plot help display where values are concentrated over the interval. In the case of the population under 48 months, the peaks of obesity are focused on the score of 6 or more UPFs.
This study of data of young children, with a mean age of 43 months, shows that for every 100 children assessed, four were obese. Excessive fat in childhood is a risk factor for later adult disease and is associated with impaired health during childhood itself, including chronic low-grade inflammation, increased risk of hypertension, insulin resistance, fatty liver disease, orthopedic dysfunction and psychosocial distress (21,22).
Risk factors for obesity include higher birth weight and shorter breastfeeding duration. In agreement with these findings, another study with the first ENDIS survey published by this same research team demonstrated that high birth weight and childhood obesity are associated (23). The highest obesity prevalence was observed in children of the first quintile of breastfeeding duration; however, it is important to highlight that even with differences among the upper quintiles, the prevalence of obesity was always high (3.38 to 3.98%). The association between breastfeeding and obesity among a sample of the California Women, Infants, and Children (WIC) participating children found that increasing rates of exclusive breastfeeding for at least 6 months would be the most successful at reducing obesity risk (24).
The highest prevalence of obesity was observed in Brazilian children. In Brazil, a meta-analysis of studies conducted between 1986 and 2015 found high prevalence rates of obesity in the southern regions of the country (10.6% [10.2−11.0%]) (25). Meanwhile, a study of Uruguayan preschoolers found that 9.6% of toddlers under 2 years and 11.6% between 2 and 4 years had been overweight or obese (26). However, upon analyzing the Global Burden of Disease estimated attributable mortality, years of life lost, years of life lived with disability and disability-adjusted life- years, obesity is a more relevant risk factor for Brazilian population of the Rio Grande do Sul State in comparison to the Uruguayan population (27-31).
This study demonstrates that higher consumption of UPF is associated with obesity in Uruguayan and Brazilian children younger than 4 years. These results were materially affected by additional adjustment for the duration of EBF, which suggests that associations altered by EBF may partly control for a competing mechanism, i.e. EBF is associated with adequate complementary feeding later in life (32).
Our results agreed with previous studies suggesting that greater UPF consumption predicts large gains in overall and central adiposity and may contribute to the inexorable rise in obesity (33,34). The positive gradient between obesity and UPF is consistent with the high energy density of these products (35– 37). However, some authors have pointed out UPF consumption as an obesity vector, not only due to its energy density. In animal models, high doses of monosodium glutamate (a usual food additive used in ultra-processed manufacturing) are toxic to neurons involved in the regulation of metabolic homeostasis, including secretion and action of insulin, leading to an increase in fasting blood glucose levels and severe visceral fat accumulation (38). Additionally, UPF would provide readily accessible and more easily digestible substrates that can facilitate growth potential and changes of the gut microbiota (8). Lastly, UPF, may alter eating behaviors and eating patterns, promoting snacking and inattentive eating that can interrupt digestive and neural mechanisms that signal satiation and lead to overconsumption (8,39-42).
In the present study, disparities between dietary patterns related to the intake of UPF were observed. Brazilian children were the highest consumers of cookies (i.e. biscuits, cake) sweets (i.e. candy, chocolate, jelly, ice cream), or packaged dairy desserts. What these data show is that the habitual intake of UPF is high in the entire population; furthermore, in the Brazilian cohort, only a small fraction of the population does not regularly include these products. A study carried out in 13 urban primary healthcare units in São Paulo, Brazil, demonstrated that UPFs were largely consumed among children under 1 year of age and the intake of UPF was associated with lower maternal education (43). A study of Brazilians at school-age describes the participation of 25.2% of UPF in the total energy intake in the diet of children (14). A study from Uruguayan schoolchildren found that 28% of calories came from UPF and 18.9% from free sugars, practically equivalent to 100 grams of daily consumption (15). These estimated dietary shares of UPF were similar to that reported in a recent study for Argentina (27.5 % of total energy intake at children 2-5 years of age) (44).
The present study has limitations based on the inherent potential biases when using food questionnaires: underestimating food consumption and differences between the nutritional composition of the consumed foods. Measures were taken to minimize these biases in all the studies, including trained interviewers following standard protocols. As the instrument used to record food consumption was not the same in each cohort, some consumption items may have been misclassified. Finally, the study did not include serving size and no adjustments for energy intake were made, therefore we could not measure specific amounts of energy and nutrient intake.
The present study shows that higher consumption of UPF is associated with obesity in Uruguayan and Brazilian preschool children under 4 years of age. These findings suggest that actions to reduce ultra- processed food consumption could lead to diminish obesity patterns and bring important public health benefits.
The authors would like to thank the participants in this study.
The project has received funding from the National Agency of Investigation and Innovation (ANII/ FSPI_X_2020_1_161855. Uruguay). This article is based on data from the study "Pelotas Birth Cohort, 2015" conducted by the Postgraduate Program in Epidemiology at the Federal University of Pelotas, with the collaboration of the Brazilian Public Health Association (ABRASCO). The 2015 Pelotas Birth Cohort was also funded by the Wellcome Trust (Grant numbers 095582 and 10735_Z_18_Z), the Conselho Nacional de Desenvolvimento Científico e Tecnológico (CNPq), the Fundação de Amparo a Pesquisa do Estado do Rio Grande do Sul (FAPERGS), and the Children’s Pastorate.
None.
Publicado: 29/01/2024