
 ,
Caroline de Oliveira Gallo2 ,
Patrícia Constante Jaime2,3 ,
Larissa Galastri Baraldi2,4
,
Caroline de Oliveira Gallo2 ,
Patrícia Constante Jaime2,3 ,
Larissa Galastri Baraldi2,4
Introduction. Brazil’s health system offers insights into addressing the double burden of malnutrition by proper population monitoring, coupled with local policies and national guidelines. Objective. To investigate the recent temporal trends in nutritional status indicators and its coverage of children aged two to five years from Campinas, a metropolis in the state of São Paulo, Brazil. Material and methods. The analysis of time series from 2018 to 2022 were conducted by accessing data from the Brazilian Food and Nutrition Surveillance System (SISVAN) due to regression analysis. Results. The number of children aged two to five in the SISVAN registry rose from 7,300 in 2018 to 11,171 in 2022, forming the study sample. In 2018, 700 were chronically undernourished, 306 underweight, and 977 overweight; by 2022, 530 showed stunting, 457 were underweight, and 1,084 overweight. Stunting prevalence declined from 9.6% (2018) to 4.7% (2022). Underweight dropped slightly from 4.2% to 4.1% over the years and overweight, consistently the highest indicator, ranged from 13.4% (2018) to 9.7% (2022). SISVAN’s coverage varied between 16.6% (2018) and 26.1% (2022), the lowest at 12.3% in 2020. The trend for stunting decreased significantly (APV: -15.01; CI95% -22.64; -6.62). Adding SISVAN’s coverage variable the model slightly reduced the declining stunting trend (APV: -12.12; CI95% -13.19; -11.04). Conclusions. Coordinated efforts to address nutritional challenges, from adequate population monitoring to the interaction between local policies and national guidelines, have shown positive health outcomes. Arch Latinoam Nutr 2023; 73(3)S2: 65-72.
Palabras clave: food and nutrition surveillance, infant development, nutrition programs and policies.
Introducción. El sistema de salud de Brasil ofrece conocimientos valiosos para abordar la doble carga de malnutrición mediante el seguimiento adecuado de la población y políticas locales y nacionales. Objetivo. Investigar las tendencias temporales recientes en indicadores nutricionales y cobertura en niños de dos a cinco años en Campinas, São Paulo, Brasil. Materiales y métodos. Se analizaron datos del SISVAN de 2018 a 2022 con regresión temporal. Resultados. Niños de dos a cinco años en el SISVAN pasaron de 7,300 en 2018 a 11,171 en 2022. En 2018, 700 estaban crónicamente desnutridos, 306 con bajo peso y 977 con sobrepeso; en 2022, 530 con retraso en el crecimiento, 457 con bajo peso y 1,084 con sobrepeso. La prevalencia del retraso en el crecimiento bajó de 9,6% a 4,7%. El bajo peso disminuyó levemente del 4,2% al 4,1% y el sobrepeso osciló del 13,4% al 9,7%. La cobertura de SISVAN varió de 16.6% a 26.1%, con un mínimo de 12.3% en 2020. La tendencia del retraso en el crecimiento disminuyó significativamente (APV: -15.01; CI95% -22.64; -6.62). La inclusión de la cobertura de SISVAN redujo levemente esta tendencia (APV: -12.12; CI95% -13.19; -11.04). Conclusiones. Coordinar esfuerzos para abordar los desafíos nutricionales, desde el seguimiento de la población hasta políticas locales y nacionales, ha tenido resultados positivos para la salud. Arch Latinoam Nutr 2023; 73(3)S2: 65- 72.
Keywords: vigilancia alimentaria y nutricional, desarrollo infantil, programas y políticas de nutrición.
https://doi.org/10.37527/2023.73.S2.008
Autor para la correspondencia: Luiza Navarro de Azevedo, e-mail: [email protected]
The double burden of malnutrition (DBM), characterized by the coexistence of undernutrition and obesity within the same population, has garnered increasing interest within academic and public health policy spheres (1). The understanding of this phenomenon both requires and propels a comprehensive array of public policies to effectively address it (1, 2). Accordingly, as one of the fundamental underpinnings of these policy frameworks, the food and nutrition surveillance systems play a central role (3, 4, 5). In this context, the Brazilian Food and Nutrition Surveillance System (SISVAN) provides data to monitor the nutritional status and food consumption of the population that accesses public health services, which grounds the development of public policies aimed at enhancing Brazilian food and nutritional security and, consequently, at promoting health (3, 5, 6). However, it is noted that, even with that system in place, the upward trend in the coverage rate of these data remains static and quite low all over the country (7, 8, 9, 10). The absence of comprehensive information regarding food consumption and anthropometric measurements hampers the formulation of effective intervention strategies, which, consequently, can harm the development and nutritional status of the population (2, 11).
Despite the barriers in the national monitoring system, the territorial organization of the national health system (Sistema Único de Saúde / SUS - Acronym in Portuguese) enables local approaches to advance in policies and achieve strategies with favorable outcomes (12). In this sense, Campinas - one of the fifteen metropolises in Brazil - stands as an illustrative city for the exploration of this notion. In 2018, this metropolis established the Campinas Municipal Plan for Early Childhood (PIC - Acronym in Portuguese) an intersectoral plan which is part of the National Plan for Early Childhood (2010) (13, 14). Regarding the health and nutrition guidelines of the PIC, it is of note that there is a foundation in the principles of SUS since in their strategies is included make health professionals aware of the importance of using SISVAN, and also is significantly grounded by the Dietary Guidelines for the Brazilian Population (DGBP), presenting concepts such as to promote consumption of fresh and minimally processed foods over ultra-processed ones (13, 15). Presently, these concepts are recognized as fundamental in safeguarding the Human Right to Adequate and Healthy Food (DHAA - Acronym in Portuguese), an essential guide to healthcare, given that dietary risk factors linked to suboptimal dietary patterns are acknowledged as the principal contributors to global morbidity and mortality in contemporary times, especially in vulnerable populations as infants whose development is significantly impacted by the social and food environment in which they are inserted (16).
Therefore, this study was focused on approaching the DBM by analyzing the recent temporal trends on anthropometric indicators of children from Campinas monitored by SISVAN, as well as its intersectional relationship with local public policies. The selected sample consisted of children aged two to five years, an age group characterized by being especially vulnerable to environmental influences (17, 18). Accordingly, this age range serves as a marker that reflects the impact of environmental conditions, including inadequate nutrition, food insecurity, limited education and precarious healthcare access (19). As a sensitive indicator, changes within this age segment offer essential insights about the efficacy of tailored interventions (17).
This study examined temporal trends in the prevalence of deviations associated to the nutritional status and its recent coverage trends among children, utilizing data from the SISVAN’s database encompassing the years 2018 - year of implementation of the PIC - to 2022 - last year with consolidated annual data in the system. The sample consisted of children aged two to five years old incomplete, being monitored within the Brazilian public health system in the metropolis of Campinas, Brazil, a municipality with a population of 1.138.309 residents.
Campinas is located in the state of São Paulo, in the southeastern region of the country, and has a municipal Human Development Index (HDI) of 0.805, classifying it as very high (20). Additionally, the most recent Infant Mortality Rate (IMR) in the municipality is reported as 7.99 deaths per thousand live births, considered a low rate that reflects the city’s healthcare and maternal support services (20). Moreover, Campinas exhibits a Gross Domestic Product (GDP) per capita of R$53,896.97, classified as a high GDP, which indicates its economic potential at providing quality services and amenities to its population (20).
Annual data regarding the nutritional status of the analyzed sample was obtained from the public reports of SISVAN, considering consolidated information across all months of the observed years and all types of registered follow-ups: SISVAN-Web, Bolsa Família Program Management System, and Basic Attention Information System (e-SUS AB). In this study, the trends of prevalence for three nutritional deviations were analyzed: stunting, underweight, and overweight in children aged two to under five years, aiming to address the DBM.
The prevalence of stunting was obtained by summing the percentage of children classified in the categories: low height-for-age (z-score of height-for-age index less than -2 standard deviations) and very low height- for-age (z-score of height-for-age index less than -3 standard deviations). On the other hand, the prevalence of underweight was calculated by summing the percentage of children classified in the categories: underweight (Body Mass Index-for-Age [BMI/A] less than -2 standard deviations) and severe underweight (BMI/A less than -3 standard deviations); and the prevalence of overweight, in turn, was obtained by summing the categories: overweight (BMI/A greater than +2 standard deviations) and obesity (BMI/A greater than +3 standard deviations) (21).
Additionally, an indicator of SISVAN’s coverage was createdtobeincludedintheanalyses, sincethevariation in the percentage of children covered by the system may be associated with the identified prevalence of malnutrition, which influences the results. This system coverage variable was obtained by dividing the number of individuals with nutritional status records in SISVAN by the total population of children aged two to five years residing in the municipality, multiplied by 100. The total municipal population of children aged two to five years of each year analyzed was obtained from the Estimation of Population Estimates by Municipality study, available at DATASUS, the Brazilian Department of Health System Informatics (22). Since data on the total population for the year 2022 were not available, this was measured based on the average rate of population increase during the period from 2018 to 2021, according to previous work (23).
For the study of temporal trends, the Prais-Winsten regression (24) was used, considering the serial autocorrelation between values during the period, that is, the dependence of a serial measurement with its own values at different time points. The average annual variation of the prevalence of malnutrition and its respective confidence intervals were calculated according to the formula:
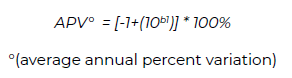
Where b1 corresponds to the Prais-Winsten regression coefficient for the time series of the variable of interest, transformed into the decimal logarithm.
A significance level of 5% was adopted. Therefore, non-significant p-values (p≥0.05) indicated a trend of stability, and significant p-values (p<0.05) indicated increasing or decreasing trends when the annual variation was positive or negative, respectively.
Since the SISVAN coverage variable could explain the variation in prevalence observed over the period, both through increased case reporting (increased prevalence) and improved follow-up of individuals (reduced prevalence), Prais-Winsten regression models were adjusted with or without the system coverage to analytically explore the relationship between these variables. Statistical analyses were performed using Stata version 13.0 for Windows software.
This research is linked to its core project titled “Feasibility and Effectiveness Study of Protocols for the Dietary Guidelines for the Brazilian Population Use: A Pragmatic Trial in the Context of Primary Health Care in the SUS” (Certificate of Ethical Appreciation Presentation - CAAE: 68581023.0.0000.5404), playing a significant role in the support for the execution of interventions aligned with this overarching initiative.
The total number of children aged two to five years from Campinas registered in the SISVAN was 7,300 in 2018 and 11,171 in 2022, constituting the sample included in the analyses. Among these, 700 were classified as chronically undernourished, 306 as underweight, and 977 as overweight in 2018; in 2022, 530 children exhibited stunting, 457 underweight, and 1,084 overweight.
Throughout the analyzed period, the prevalence of stunting decreased from 9.6% in 2018 to 4.7% in 2022 - the maximum and minimum prevalences during the period, respectively. Regarding the BMI/A indicator, it was estimated that 4.2% of the sample had underweight at the beginning of the historical series, decreasing to 4.1% in the final year. Conversely, the prevalence of overweight were higher compared to the other indicators across the entire historical series, ranging from 13.4% in 2018 to 9.7% in 2022. The SISVAN coverage variable, on the other hand, ranged from 16.6% in 2018 to 26.1% in 2022, with the lowest prevalence observed in 2020 (12.3%) (Table 1).
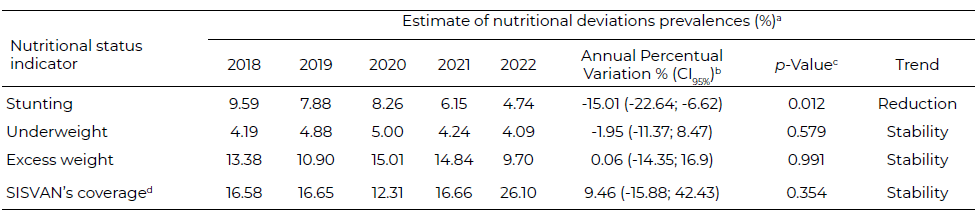
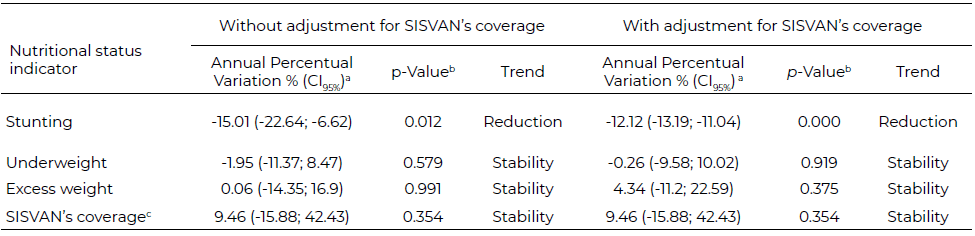
The analyses of temporal trends conducted through the proposed regression models indicated a marked reduction in the prevalence of chronic undernutrition only: APV: -15.01; CI95% -22.64; -6.62. For the other variables analyzed, the observed temporal trends indicated stability, as shown in Tables 1 and 2. Only a slight reduction in the declining trend of stunting prevalence was observed when including the coverage variable in the model (APV: -12.12; CI95% -13.19; -11.04) (Table 2).
This study examined nutritional status and its recent coverage trends among children aged two to five years in Campinas, Brazil. The key findings included a trend of a decline in chronic malnutrition prevalence and a pattern of stability in underweight and weight excess indices, alongside a stability in SISVAN’s coverage. Considering the analyzed years incorporated the emergency of the COVID-19 pandemic, finds on stability and even some improvements in indexes underscored the resilience of local policies, in challenging periods (6, 13, 15, 17).
Some examples on Food and Nutrition Security actions and programs can illustrate the successes in the municipality to ensure the DHAA (25), among them we can mention adaptations existing measures like the National School Food Program (PNAE), the distribution of food and staple food baskets, arrangements on the Food Bank, organization of the Municipal Committee for Breastfeeding and Healthy Complementary Food and the expansion of the Cash Transfer Local Program (NutrirCampinas).
The reduction in chronic malnutrition - reflected by a decrease in the prevalence of stunting - drew attention, as early infancy is the main period of growth for stature, which makes children potentially sensitive to any interventions (17). Thus, changes observed in this indicator reflect the trajectory of the first years of life influenced not by only genetic factors, but mainly due to social determinants of health, including structural and environmental factors, to which the child was exposed during its development (17, 18).
Therefore, the improvement on the chronic malnutrition index may be potentially related to the PIC, which places the figure of children at the center of the municipal public governance, contributing to the identification and embracement of demands related to this audience (13). Considering the intersectoral segments of this municipal program - particularly its axis related to breastfeeding and healthy eating promotion, child’s health promotion and childcare in vulnerable contexts - is important for the understanding of this recent panorama in the municipality, especially because PIC is in a substantial manner based on the principles of the DGBP (13, 14, 15).
Exemplifying these correlations, a recent trend study with the Mexican National Health and Nutrition Surveys investigated ultra-processed food (UPF) consumption in children and adolescents with the DBM at the individual level and found a positive association between UPFs and DBM in lower socioeconomic status (26). This could be justified partially by the imbalance on nutritional profile of UPF designated and consumed by children (27), in which the increase in the dietary share of UPF is associated with increases in energy density, free sugars, saturated fat, sodium and decrement in fiber on children’s diet in different countries including the decrease of dietary quality of complementary food consumed among children under two years old in Brazil (28, 29).
Complementary, UPF consumption seems to be in the opposite way of breastfeeding (31). Studies carried out in primary healthcare units with children assisted in different cities of Brazil showed that breastmilk intake was associated with a reduced consumption of UPF (30, 31). In contrast, when a child’s initial visit to the primary healthcare unit occurred after the first week of life, it was associated with the consumption of UPF (30, 31).
Despite all those studies recognizing the potential impact of food consumption on child development and awareness of the importance of monitoring diet quality indicators, the attempt to analyze child food consumption indicators across all 15 metropolitan areas in Brazil revealed a limitation. Data extracted from 2022 SISVAN’s Public Access Reports (analyzed and presented by the authors at the XX SLAN Congress) revealed a practically non-existent dataset (32); this kind of lack constrains the tracing of the population’s epidemiological profile, since only on side of indicators would not encompass the entire evaluation of the object of study and, consequently, the formulation and implementation of effective national and regional public policies on early childhood (4, 28, 32). In this sense, it is important to discuss the fundamentality that investment on robust indicators and consistent sources of information have for a democratic society (2). The PIC itself has as one of its proposals the awareness of health professionals about the importance of using the SISVAN, within the scope of permanent education (33).
It is important to acknowledge the limitations of this study. As it was mentioned, only consolidated public data and reports of SISVAN on anthropometric indicators were accessed, instead of microdata that could provide more adequate inferences specially in the different micro-contexts of the municipality. Analyzing the nutritional landscape without food consumption data and with insufficient coverage of SISVAN in general hinders a comprehensive understanding of an appropriate evaluation of the evolution of the nutritional status and food practices of children who access the public health network, as well as of the policy impact (4). Future investment and research should aim to expand data coverage, integrating dietary intake and nutritional status information for a more nuanced assessment of interventions (8, 9).
In the field of the implications of the main observed results, the findings underscored the potential of intersectoral policies like PIC, aligned with the official dietary recommendations, to positively influence child nutritional outcomes (33). This study reinforced the need for strengthened surveillance systems like SISVAN to enhance policy evaluation and guide targeted interventions and related challenges of the metropolis (2, 10). Incorporating dietary guidelines into municipal policies has shown promise, but further exploration is necessary to optimize their implementation across diverse contexts. These findings have implications both for clinical practitioners, and also in the macroscopic domain of health promotion, highlighting the importance of collaborative efforts between health and other sectors to monitor, and, consequently, improve child nutrition properly.
This study highlighted the vital role of intersectoral policies in potentially shaping a conducive environment for improved health outcomes. The observed trend of reductions in the stunting indicator prompts a pertinent discussion on how such policies could exert a reciprocal influence on nutritional markers. Simultaneously, the understanding of SISVAN as a gateway to clinical guidance, population interventions, implementation of adequate protocols, and comprehension of both individual and populational nutritional and dietary contexts, emphasizes the gravity that the lag in SISVAN’s data represents. Addressing this issue by stimulating a strong SISVAN framework could not only empower the population with a better understanding of their health, but also pave the way for expanded and more effective nutritional policies related to the promotion of healthy and adequate diets, as well as it contributes to the prevention and treatment of all forms of malnutrition, non-communicable chronic diseases and other aggravating nutritional factors.
The authors would like to express their gratitude to the Campinas City Hall for providing the research cooperation agreement. Additionally, this acknowledgment is extended to all funding sources that supported this study (CNPq process numbers: 103685/2023-5; 443256/2020-9 and 403172/2021-7).
The authors declare that there are no conflicts of interest to be disclosed in relation to this study.
Publicado: 29/01/2024