
The objective of this study was to determine the prevalence of malnutrition and its risk factors in children aged 0-10 years attending outpatient clinics in Manaus, Amazonas, Brazil. A cross-sectional epidemiological study of a population of 347 children was conducted. Data concerning socio-economic levels and food consumption were obtained by interviewing the accompanying guardian of each child. Dietetic evaluation was conducted using a semi-quantitative food frequency questionnaire, and faecal samples were examined by optical microscopy. Anthropometric measurements were transformed into percentiles and z-scores, and nutritional status was evaluated by reference to National Center for Health Statistics (NCHS) and Centers for Disease Control (CDC) indicators. Factors associated with undernutrition were analysed using a random-effects logistic regression model. The overall prevalences of underweight, stunting and wasting were 18.1, 15.5 and 10.7%, respectively, with reference to CDC growth curves, and 14.3, 17.3 and 4.4%, respectively, with reference to NCHS growth curves. The overall prevalence of wasting was statistical higher according to the CDC reference than that estimated using the NCHS reference (P=0.02). The prevalence rate of intestinal parasites was 58.8%. Risk factors associated with malnutrition were: low educational level of guardian respondent (OR=4.55), energy intake <54.5 kcal/kg (OR=4.55), children in age group 6-10 years (OR=3.54), and attendance at outpatient clinic for paediatric visit (OR=2.71). In the studied population, malnutrition (stunting, underweight and wasting) and parasite infection still represent serious public health problems. The risk factors identified in the present study confirm the influence of socio-economic factors on the nutritional status of children.
Key words: Malnutrition, risk factors, children, Brazil.
O objetivo do estudo foi determinar a prevalência de desnutrição e fatores de risco em crianças de 0-10 anos, atendidas em ambulatórios em Manaus, Amazonas, Brasil. Foi conduzido um estudo epidemiológico transversal em uma amostra de 347 crianças. As entrevistas foram realizadas com os pais ou responsáveis, foram coletados dados socioeconômico e de consumo alimentar de cada criança. Para avaliação dietética utilizou-se um questionário semiquantitativo de freqüência alimentar. Amostras de fezes foram examinas por microscópio ótico. Medidas antropométricas foram transformadas em percentis e z-escore e o estado nutricional foi avaliado pelos indicadores do National Center for Health Statistics (NCHS) e do Centers for Disease Control (CDC). Fatores de risco associados à desnutrição foram analisados usando modelo de regressão logística com efeito aleatório. As prevalências de baixo peso, déficit de estatura e déficit de peso foram 18,1, 15,5 e 10,7% pela referência do CDC e 14,3, 17,3 e 4,4% do NCHS. A prevalência de déficit de peso foi maior quando estimada pelo CDC em comparação ao NCHS (p=0,02). A prevalência de parasitoses intestinais foi de 58,8%. Os fatores de risco associados a desnutrição foram: baixo nível educacional dos respondentes (OR=4.55), ingestão calórica <54.5 kcal/kg (OR=4.55), crianças na faixa etária de 6-10 anos (OR=3.54), e consulta pediátrica como motivo de visita ao ambulatório (OR=2.71). Na população estudada, desnutrição (baixo peso, déficit de estatura e déficit de peso) e infecção parasitária ainda representam um problema de saúde pública. Os fatores de risco confirmam a influência dos fatores sócio econômicos no estado nutricional das crianças.
Palavras chave: Desnutrição, fatores de risco, crianças, Brasil.
Departamento de Parasitologia, Instituto de Ciências Biológicas, Universidade Federal de Minas Gerais, Brazil.
Escola de Nutrição, Universidade Federal de Ouro Preto, Brazil. Departamento de Parasitologia, Instituto de Ciências Biológicas, Universidade Federal do Amazonas, Brazil
Energy-protein malnutrition represents one of the main public health problems throughout the world, but most especially in developing countries. According to the World Health Organization (1), malnutrition affects more than a quarter of children worldwide, with an estimated 150 million (26.7%) infants being underweight and 182 million (32.5%) exhibiting stunting.
In Brazil, three nutritional surveys have been carried out at the national level, namely, the National Study of Family Income (2) in 1974/75 and the National Survey on Health and Nutrition (3) in 1989, both organised by the Brazilian Institute of Geography and Statistics (IBGE), and the National Survey on Demographics and Health (4) in 1996 conducted by the Sociedade Civil Bem-Estar Familiar no Brasil (BEMFAM). For children < 5 years of age living in urban areas of Brazil, the mean prevalence values of height-for-age z-scores < - 2 standard deviations (- 2SD) revealed by these studies were 26.6, 15.4 and 10.5%, respectively. Whilst these results indicate a gradual overall reduction in the prevalence of stunting within the country, malnutrition in the northern and north-eastern regions remains approximately twice that of the mid-western area, and four-times greater than in the southern states. Thus in 1996, the northern area presented the highest prevalence (16.2%) of children < 5 years old with stunting. In both the 1989 and 1996 surveys, only 2% of children less than 5 years old presented wasting according to the weight-for-height indicator. However, in the northern states, the prevalence of wasting based on this indicator was 3.1% in 1989, and showed decline to 1.2% in 1996. Additionally, on the basis of weightfor-age Z scores < -2SD, approximately 6% of Brazilian children were found to be suffering from underweight in 1996 with the highest prevalence (7.7%) again being in the northern areas (4).
Environmental and social factors as well as hygiene habits are important risk factors associated with nutritional status, as reported by different authors (5,6,7). Although the prevalence of malnutrition and its determinant factors have been studied across the whole of Brazil, the few recent epidemiological investigations that have been conducted in the Amazon region of the country have failed to consider the concomitant effects on child nutritional status of food consumption, parasitic infections and socio-economic level of the population. Despite its continental dimensions, the Brazilian Amazon region is inhabited by only 17 million people producing an overall population density of only 3.4 inhabitants per km2, which is amongst the lowest in the world. On the basis of the human development index (HDI), the State of Amazonas (HDI = 0.713) was ranked at position 16 out of the 26 Brazilian states according to a United Nations survey carried out in 2000 (8). Manaus, the capital city of the State of Amazonas, comprised 49.9% of the state population in 2000. Interestingly, the HDI of Manaus was reported to be 0.774, a value that is higher than the overall index for Brazil (HDI = 0.757) (8). The objective of the present study was to determine the prevalence of malnutrition in Manaus and to investigate some risk factors associated with malnutrition in a population of children aged 0-10 years attending outpatient clinics in the capital.
The project was approved by the Research Ethics Committee of the Universidade Federal de Minas Gerais, Bello Horizonte-MG, Brazil.
The cross-sectional study was conducted from August 2001 to March 2002, and involved children aged 0-10 years attending four outpatient clinics in Manaus, Amazonas, Brazil (9). In order to encompass individuals living in different regions of the city, participants were recruited from outpatient clinics of the Hospital Universitário “Getúlio Vargas”, Hospital do Servidor Público Estadual “Francisca Mendes”, Fundação de Hematologia e Hemoterapia do Amazonas, and Centro de Referência Doutor “Antônio Comte Telles”.
The required minimum population size was calculated on the basis of the IBGE census of 2000, which showed Manaus to have a population of 323000 children in the age range 0-10 years. Assuming that the prevalence of infantile malnutrition was 16% (4), and allowing for an acceptable variance of 0.04 and a confidence level of 95%, it was estimated that a minimum of 322 children aged 0-10 years would be required for the study. The sampling process was for convenience. Individual children were invited by the research team to participate in the study when they arrived at a clinic to book an appointment for the laboratory examinations recommended by a physician regardless of the symptoms presented. Informed consent was obtained in writing from the parents or guardians of the children prior to entry to the study.
The detailed methodology employed for data collection has been published elsewhere (9), and involved interviews carried out by trained personnel in which questions specifically relating to the infant participants were answered by the accompanying parent or guardian. The data collected were: (i) demographic grouping (sex, age, race, weight, height), (ii) social status (educational level, income, and professional occupation of the parent or guardian), (ii) living conditions (water quality, access to sanitation, garbage disposal), (iv) food intake and (v) motives for seeking medical attention.
A semi-quantitative food frequency questionnaire (FFQ) was developed on the basis of information that had been gathered relating to local dietary intake (with the aim of including culture-specific foods). The final version of the FFQ, which was tested during a pilot study, contained 103 food items. The following information was collected for each item on the list: consumption, frequency of consumption, average routine frequency of consumption, the respective time period of recurring consumption (i.e. daily, weekly, fortnightly, monthly), and the size of the typical individual portion expressed in the form of commonly-used measurements. Information relating to sugar and oil intake was expressed in terms of monthly family consumption. Conversion of commonly-used measurements for foods and beverages into metric units (g and mL) was performed with the help of appropriate tables (10-13).
Recommended energy intakes were determine based on equations for Estimated Energy Requirements (EER) for infants up to the age of 35 months, and from equations relating to specific age and gender groups for physically active children aged 3 years and older (14). Recommended protein intake was based on the Adequate Intake (AI) for infants up to 6 months, and on Estimated Average Requirements (EAR) for children older than 6 months (14).
Anthropometric measurements of participants were acquired with the subjects wearing minimal clothing and no shoes. A Filizola® paediatric balance was used to weigh children up to 23 months old and Filizola® anthropometric balance, capacity of 150 kg and precision of 100 g, was used to weigh children aged 24 months and older. Body length (infants up to 23 months) was measured using a horizontal wooden stadiometer with the infant in recumbent position and height (children = 24 months) was measured using a vertical stadiometer (100-200 cm) coupled to the balance. Body mass index (BMI) was calculated as [weight (kg) / height squared (m2)]. Anthropometric measurements were transformed into percentiles and z-scores with the aid of Epi-Info 2000 software version 3.4 (15), and growth curves published by the National Center for Health Statistics (NCHS) (16) and Centers for Disease Control (CDC) (17) were employed as references. In this article the term undernourished is used as synonymous of underweight.
The z-score values for height-age (HAZ), weight-age (WAZ) and weight-height (WHZ) based on the NCHS indices were calculated in order to allow comparison of the results with the data available for the northern region of Brazil. The cut-off points for stunting, underweight and wasting were HAZ, WAZ and WHZ < -2 SD, respectively (18).
With respect to the CDC index,the cut-off point for wasting was WHZ < -2 SD for children < 2 years old, and less than the 5th percentile of BMI-for-age for children > 2 years of age. Eutrophy was defined as –2 SD < WHZ < 2 SD for children < 2 years old, and between the 5th and 95th percentiles of BMIfor-age for children > 2 years of age. The cut-off point for overweight was WHZ > 2 SD for children < 2 years old, and more than the 95th percentile of BMI-for-age for children > 2 years of age. Children classified as underweight by the CDC index were compared with children classified as eutrophic.
Faecal samples were transported to the laboratories of the institutions where the participants had been recruited and examined on the day of collection using the direct method (with saline and 2% lugol) and the routine Hoffman, Pons and Janer spontaneous sedimentation method (19). Two slides were prepared for each sample and examined, using optical microscopy, by a technician from the unit and by the supervisor involved in the study.
A database containing the collected information was generated using Epidata version 2.1 software (20), and statistical analyses were performed using STATA statistical software, version 9.0 (21).
Fisher exact and ÷ 2 tests were employed in order to evaluate the frequency distribution according to gender and age group. The median values of continuous variables with asymmetric distributions were compared using the Mann-Whitney U test for independent samples and the Wilcoxon signed-rank test for matched-pair samples. Differences were considered significant at the 5% level.
In order to evaluate the risk factors for undernutrition, a response variable was defined according to the CDC dataset and factors associated with this variable were analyzed using a random-effects logistic regression model (22). This model assumed that observations obtained at the same interview location were mutually dependent and that observations between children were independent. Univariate analysis was performed, and Odds ratios (OR) and 95% confidence intervals (CI95%) were used to quantify the association between risk factors and undernutrition. Energy (kcal and kcal/kg) and protein (g and g/kg) intakes were evaluated as continuous values as well as in categorized form as percentiles of consumption (i.e. ≤ 25th, 25th - 50th, >50th - 75th, > 75th): age was evaluated as a continuous variable and as well as in the categorized form as groups (i.e. < 2, 2 – 5, and > 6 years old). Those variables that presented p < 0.25 in the univariate analysis were employed in the multivariate regression model. Variables that presented collinearity or low frequency were excluded from the multivariate model, while variables with more than two categories were transformed into indicator (dummy) variables. The models were constructed using forward selection of the variables, and the likelihood-ratio test (22) was used to define the final model.
The population studied comprised 347 children, 184 (53.0%) of whom were boys. Within each age group there were no statistically significant differences with respect to weight or height between boys and girls. The reasons for attendance at the four selected outpatient clinics were: paediatric medical visit (56.8%), gastrointestinal diseases (19.0%), pulmonary diseases (1.1%), pain (0.9%), visual or auditory problems (0.6%), and other causes (14.7%) including dermatological diseases, infectious diseases such as dengue, and accidents: 6.9% of the participants did not declare a reason for attendance. The paediatric medical visit was understood as the following of the infant’s growth and development.
With respect to the guardians of the participating children, 5.8% were younger than 20 years, 76.4% were between 20 and 39.9 years, and 17.9% were older than 39.9 years. Most of the responding guardians were female (88.5%). With respect the education level 4.0% never had studied, 64.3% had attended school from 1 to 8 years, and 31.7% had attended school more than 8 years. The minimum monthly salary in Brazil relating to the period during which the research was conducted was US$ 72.00. Most of the families questioned (37.5%) received less than 2.9 minimum salaries, although 17.6% families received between 3 and 4.9 minimum salaries, and 13.5% received more than 5 minimum salaries: 31.4% of the participants did not reveal a family income.
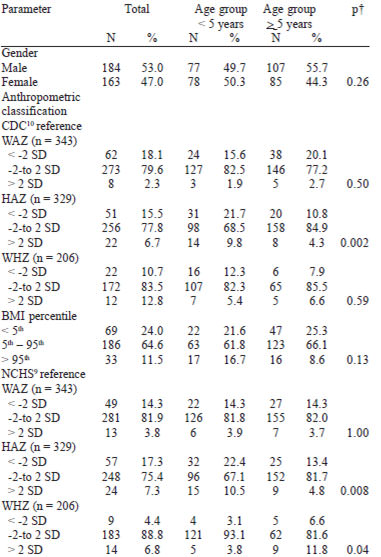
Table 1 shows the demographic characteristics and the anthropometric classification of the studied population of children distributed according to age group. No statistical differences between boys and girls were observed with respect to the distribution of WAZ, HAZ, WHZ or BMI categories. The overall prevalences of WAZ, HAZ and WHZ < -2 SD were 18.1, 15.5 and 10.7%, respectively, with reference to CDC growth curves (14), and 14.3, 17.3 and 4.4%, respectively, with reference to NCHS growth curves (16). With respect to underweight and stunting, there were no statistical differences between the prevalence determined using CDC or NCHS indicators, although the overall prevalence of wasting was estimated to be higher (p=0.02) according to the CDC reference. The prevalence of stunting was observed to be greater for children < 5 years compared with the group aged = 5 years according to both the CDC (p=0.002) and the NCHS (p=0.008) reference datasets.
Among the 347 children studied, 204 (58.8%) presented faecal samples that tested positive for intestinal parasite infection. Children < 2 years of age showed a lower frequency of infection (29.8%) compared with those in the age groups 2 - 5 years (61.1%) (p=0.0002) and 6 - 10 years (65.4%) (p=0.00001). The hypothesis that parasite infection tended to be associated with an increase in age was confirmed by ÷2?2 analysis (p=0.0002). Of the positive faecal samples, 60.8% (n=124) were infected with a single parasite species and 39.2% (n=80) with two or more species. With respect to protozoa, 23.3% (n=81) samples tested positive for Giardia lamblia, 19.6% (n=68) for Endolimax nana, 11.5% (n=40) for Entamoeba histolytica/dispar, 10.4% (n =36) for Entamoeba coli and 3.7% (n=13) for Iodamoeba butschli. In the case of helminths, 14.1% (n=49) samples tested positive for Ascaris lumbricoides, 4.6% (n=16) for Trichuris trichiura, 2.3% (n=8) for Enterobius vermicularis and1.4% (n=5) for Ancylostomids. There was no statistical difference between parasites infection and infant malnutrition.
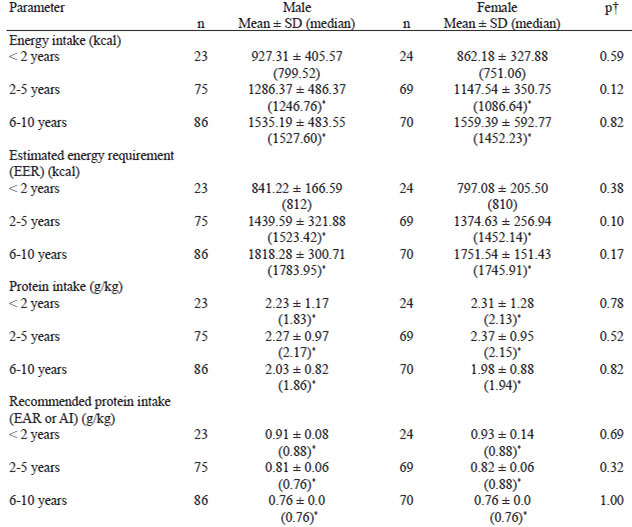
Within the study population, the prevalence of energy intake less than EER was 66.3%, and that of protein intake less than AI or EAR was 2.6%. The prevalence of energy intake less than EER was significantly higher for children aged 2 - 5 years (69.4%) and 6 - 10 years (69.8%) compared with the group of children < 2 years old (44.7%) (p=0.003). There were no significant differences with respect to energy intake (kcal and kcal/kg) or protein intake (g and g/kg) between boys and girls by age group. For groups of children aged 2 - 5 years and 6 - 10 years, the median energy intake for boys and girls was less than the EER. For all age groups, the median of protein intake (g/kg) for boys and girls was higher that that recommended (AI or EAR) (Table 2).
The variables associated with malnutrition as determined by logistic regression univariate analysis were: educational level of the guardian responding (OR=5.99; CI95%=1.70 - 21.05 for those who had never studied compared with those who had attended school > 8 years), reason for attendance at the outpatient clinic (paediatric medical visit OR=2.73, CI95%=1.09 - 6.86; gastrointestinal diseases OR=2.44, CI95%= 0.86 - 6.90), age in years (OR=1.11, CI95%=1.01 - 1.22) and age group (2 - 5 years OR=2.96; CI95%= 0.97 - 9.05; 6 - 10 years OR=3.32, CI95%=1.10 - 9.96). Energy intake categorized in kcal/kg was also selected for inclusion in the multivariate model (intake 25th percentile, p=0.13): protein intake was not associated with nutritional status.
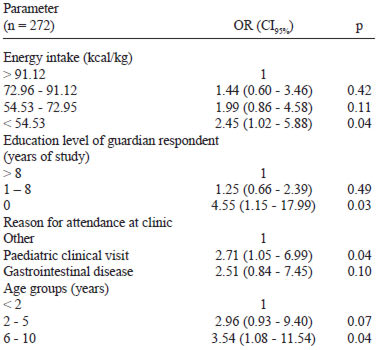
Table 3 shows the final model based on information relating to 272 children containing the risk factors associated with malnutrition. Children whose guardians never studied had a higher risk of presenting malnutrition when compared with those whose guardians had received > 8 years of education. Children whose energy intake was < 54.5 kcal/kg exhibited a 2.45-fold higher risk of being malnourished compared with children who ingested more than 91.12 kcal/kg. The risk of malnutrition was higher among those children attending the outpatient clinic for paediatric medical visit compared with children presenting for other reasons. A higher risk of malnutrition was found in children within the age group 6 to 10 years old compared with children < 2 years old.
Since little information is available regarding infant nutritional status in the studied region, comparisons of the results obtained were restricted to data published in previous national surveys including the National Survey on Health and Nutrition (3) (undertaken in 1989), the National Survey on Demographics and Health (4) (conducted in 1996), and with the Engestron & Anjos (5) study (conducted in 1999). Unfortunately, the 1989 survey recorded anthropometrical indices based on NCHS percentiles (16), while the 1996 survey, although using the standard z-score system to classify nutritional status according to the CDC reference (17), contained information relating only to children younger than 5 years of age. The study of Engstron and Anjos (5),employed the z-score system in order to evaluate the prevalence of stunting in Brazilian children younger than 10 years of age.
The prevalence of stunting observed within the studied population (17.3%) did not differ from that established in the 1989 survey (21.5%) for children younger than 10 years of age in the northern region of Brazil. According to the 1996 survey, the prevalence of stunting, wasting and underweight among children < 5 years of age in the north of Brazil were 16.2, 1.2 and 7.7%, respectively. In our study, the prevalence rates of stunting (22.4%) and wasting (3.1%) observed in children aged 0 - 5 years, estimated according to the NCHS growth curves, were similar to those observed in the northern states of Brazil in the 1996 survey. In contrast, the prevalence rates of underweight (14.3%) observed in children of Manaus were higher (p=0.03) than those reported in the 1996 survey for the north, which were 7.7% (4).
The selection of participants from four different outpatient clinics in the city sought to guarantee a greater representation of the studied population. However, there is no way of ensuring that the children included in the present study were similar to the rest of the children population of Manaus, thus questioning the external validity of the study (23). Although hospitals and health centres receive patients from different localities, one cannot discount the possibility of selection bias. Additionally, recruitment of children already attending outpatient clinics may have increased the probability of selecting children with some degree of nutritional disorder, and may also explain the high prevalence of entero-parasites in the studied population. However, despite the high frequency of intestinal parasites, no association between parasite infection and infant malnutrition was detected in the present study, thus corroborating earlier indications (24,25) that malnutrition is affected more by socio-economic, environment and cultural factors that interfere with nutrient intake.
The following risk factors were found to be associated with malnutrition in the population of children studied:
The risk factors associated with undernutrition that have been identified in the present study confirm the influence of socio-economic determinants on the nutritional status of children. However, it is important to emphasise that a temporal evaluation or the investigation of cause-effect is one of the limitations of sectional studies. The results indicate that stunting, underweight, wasting and parasites infection in the infant population still represent a serious health problem in the northern region of Brazil.
Recibido: 30-01-2008
Aceptado: 05-06-2008