
Some authors have suggested that body weight dissatisfaction may be high in students majoring in dietetics. Therefore, this study was conducted to examine the extent of body weight and image dissatisfaction in a sample of women in dietetics major. Additionally, predictors of magnitude of body weight dissatisfaction were analyzed. Participants were 62 volunteers with normalweight whose mean age was 21.87±1.89 years old (nonrandom sample). The assessment instruments included anthropometric measurements, a somatomorphic matrix test and an eating disorders inventory (EDI-2). Data were analyzed using SPSS vs. 15.0. A larger proportion of students chose an ideal body weight lower than actual weight (67.7%) and body image with less body fat and more muscle mass than actual values (56.4%). The magnitude of body weight dissatisfaction was associated with muscle mass and body fat dissatisfaction, and with the subscale of EDI-2 “body dissatisfaction”. So, from a public health standpoint, we consider important to continue working in this line of research with the aim of better understanding the extent of body weight dissatisfaction in women dietitians, and how this dissatisfaction could interfere with their professional practice.
Key words: Body weight, body image, dissatisfaction, body fat, index of muscularity, dietitians.
Algunos autores han sugerido que los estudiantes de Dietética pueden presentar una elevada insatisfacción con el peso corporal. Por este motivo, se llevó a cabo el presente trabajo con el objetivo de analizar la insatisfacción con el peso y la imagen corporal en una muestra de mujeres estudiantes de Dietética. Además, se analizaron predictores de la magnitud de la insatisfacción con el peso corporal. Las participantes fueron 62 voluntarias con normopeso que tenían una media de edad de 21,87±1,89 años (muestra no aleatoria). La evaluación incluyó medidas antropométricas, el test somatomórfico matrix y el eating disorders inventory (EDI-2). Los resultados se analizaron con el programa estadístico SPSS vs. 15.0. Un elevado porcentaje de estudiantes eligieron un peso ideal menor que su peso actual (67,7%) e imágenes corporales con menos grasa corporal y más masa muscular que la que tienen actualmente (56,4%). La magnitud de la insatisfacción con el peso corporal se asoció con la insatisfacción con la grasa corporal y la masa muscular, y con la subescala “insatisfacción corporal” del EDI-2. Por lo que, desde el punto de vista de salud pública, consideramos de interés seguir trabajando en esta línea de investigación con el objetivo de comprender mejor el grado de insatisfacción con el peso corporal en mujeres dietistas, y cómo esa insatisfacción podría afectar a su práctica profesional.
Palabras clave: Peso corporal, imagen corporal, insatisfacción, grasa corporal, índice de musculación, dietistas.
Department of Nutrition and Food Science. Faculty of Pharmacy, Department of Social Psychology and Methodology of the Sciences of the Behavior. Faculty of Pharmacy, University of the Basque Country. Spain.
The growing rate of obesity in children and adults is a global health concern. In Spain, about 54.7% of adults are overweight or obese (59.6% of males, 50.4% of females) (1). Corresponding to this trend, large proportions of the population are unsatisfied with their weight and trying to lose weight.
Perceived weight does not always reflect actual weight status based on body mass index (BMI). Females in general, are more likely to perceive themselves as overweight than males (2,3). Cash and Green (4) suggest that feminine attractiveness is frequently defined on the basis of thinness. Indeed, the “ideal” female body type has grown thinner over time and the increasing prevalence of eating disorders among females is well documented (5,6).
Students who enroll in food and nutrition courses most commonly offered are predominantly female. It has been suggested that general body weight dissatisfaction (BWD), or anorexia-like behaviour, may be higher in students majoring in dietetics than in students in non-food and nutrition majors (7-10).
This observation may be problematic in a student’s future personal life or professional practice. In Spain approximately 850 students register per year in the degree in Human Nutrition and Dietetic (11) and when they finish the degree supposedly they are prepared to provide effective, evidence based nutritional assessment, dietary advice and support to patients (12).
Crockett and Littrell (13) have suggested that “if a dietitian has a personal eating problem then working with others with similar problems may exacerbate the dietitian’s problem and/or interfere with effective delivery of treatment plans”. Thus, the identification of individuals with an eating disorder needs to begin early. Teachers can identify students and refer them for professional counseling. Educators can also help with the development of intervention strategies that include promoting adoption of appropriate attitudes towards weight status and food.
Since BWD and body image dissatisfaction (BID) have been identified as one of several behavioral patterns associated with eating disorders, a preliminary investigation was conducted to examine the extent of body weight and image dissatisfaction in a sample of women in dietetics major. Additionally, predictors of magnitude of BWD were analyzed.
We hypothesized that a larger proportion of students with normal BMI value will choose an ideal body weight lower than actual weight and body image with less body fat and more muscle mass than actual values. It moreover hypothesized that the magnitude of BWD will be associated with muscle mass and body fat dissatisfaction, and with attitudes and behaviors related to food, weight and body shape.
Many studies in the literature have assessed BWD and BID on women (14,15) and some of them have highlighted the lack of information about dissatisfaction by body compartments (14). Therefore, in the present study we assessed dissatisfaction with an index of muscularity and with body fat.
This cross-sectional research included students of the last year of the degree in Human Nutrition and Dietetic of the University of the Basque Country (Spain) with normal BMI value (18.5-25.0 kg/m2) (16). Participants provided written informed consent and the study was approved by the University Ethical Committee on Human Research. The studied sample consisted of 62 women volunteers. Mean age was 21.87±1.89 y old (20-28). The participants were placed in the intermediate socio-economic level according to the classification of the working party of the Spanish Society of Epidemiology and the Spanish Society of family and community medicine (17).
Participants could not be enrolled if they had one of the following exclusion criteria: pregnancy; diseases impairing perception of body size (blindness); pathological short stature or pathological obesity; clinical evidence of diseases influencing body weight (hypo/hyperthyroidism, etc.); to take part in any competitive sport.
A well-trained anthropometrist performed all the measurements following the protocols of the International Biological Programme (IBP) (18). The measuring instruments employed were a standard beam balance (Añó-Sayol®; Atlántida, Barcelona, Spain) with a precision of 0.1 kg; a Harpender stadiometer (Holtain Ltd, Crymych, Wales, UK) with a precision of 1 mm; a skinfold caliper with precision of 0.2 mm (Holtain Ltd. Crymych U.K.); and a Harpender anthropometric tape.
A total of fourteen anthropometric measurements were taken: weight and height, seven skinfolds (subscapular, abdominal, suprailiac, midaxillary, chest, thigh, and triceps), and circumferences of mid-upper-arm, waist, hip, front thigh and maxim leg. The results were compared to the reference values of the survey of nutrition of the Basque Country (19) and the 5th and 95th percentile are used as cut-point. Reported weights and heights were obtained via questionnaire and these variables were used to calculate the self-reported BMI.
To obtain the ideal weight participants were asked “Ideally, how much would you like to weigh?”. The discrepancy between actual (self-reported) and ideal body weight has previously been validated as a measure of BWD (20). BWD adjusted by height was estimated using the discrepancy between actual and ideal BMI. By taking the absolute value of BWD, we assess the overall magnitude of weight discrepancy accounting for the dissatisfaction experienced by both those who want to weigh more and those who want to weigh less.
Body density was calculated using the equations of Jackson and Pollock (21) (seven skinfolds) and the body density was converted to percentage body fat (%BF) using Siri´s equation (22) The software used to assess the body image includes the formula of Jackson and Pollock as well. The results of %BF were interpreted using the classification of Bray et al. (23). The fat free mass index (FFMI) was estimated including height, weight and %BF, using the equation of Kouri et al. (24) and the data of FFMI were interpreted using the classification of Gruber et al. (25) for women.
After the anthropometric measurements each participant took the somatomorphic matrix test (26). The computer posed two standard questions: 1) choose the image that best represents your own body (actual image), and 2) choose the image that represents the body that you ideally would like to have (ideal image). In each case, the participant scrolled through the images until she chose the image that she felt best answers the question. At that point, she clicked a button entitled “select this image”. The computer then stored her answer to the question, restored the image to the screen, and posed the following question. Thus, for each participant, we obtained four measurements: 1) her actual body fat and muscularity (as expressed by FFMI) and 2) the level of fat and muscularity that she would like to have.
Studies in the literature on body image frequently assume that the difference between actual and ideal image provides a valid measurement of BID (27). In the present study, this statement was also assumed and the differences between actual and ideal FFMI, and between actual and ideal %BF were used to estimate FFMI and BF dissatisfaction, respectively. The degree of dissatisfaction was measured with four categories based on the classification of Casillas-Estrella et al. (28) and the increases of FFMI (1.5 kg/m2) and of BF (4%) between images in the somatomorphic matrix test (26). It was considered that the participant was satisfied when the difference between actual and ideal image was 0. The other categories were: 1 (slight dissatisfaction); 2 (medium dissatisfaction); and 3 (severe dissatisfaction).
Moreover, a subsample with 39 participants completed an eating disorders inventory (EDI-2 version of 91 items; 64 original items plus 27 newer items divided into subscales) (29) which evaluates attitudes and behaviours related to food, weight and body shape as well as pathological traits in eating disorders. The Cronbach´s Alpha is between 0.84 and 0.92 for each scale value. Higher scores mean more negative appraisals. The EDI-2 indexes are recommended for screening purposes and these three specific dimensions in particular: Drive for the thinness, Bulimia and Body dissatisfaction (30).
Data were analyzed using SPSS vs. 15.0. (SPSS Inc., Chicago, IL, USA) and reported as mean and standard deviation (s.d.). The normality of continuous variables was checked (Kolmogorov-Smirnov-Lilliefors test). Logarithmic transformation was used when the test of normality was significant (p<0.05), it is the case for the variables: BF dissatisfaction, FFMI dissatisfaction, BWD and EDI-2 dimensions. The BMI distributions (self-reported, current and ideal) were normal.
The difference between means was estimated by the Student’s t test. The χ2 test was used to compare distributions in contingence tables. The linear relationship between quantitative variables was estimated by the Pearson´ r correlation coefficient; and a multiple linear regression analysis (Stepwise method) was conducted to examine predictors of the magnitude of BWD. Alpha level for all of these analyses was set at p<0.05 (two-tail test).
Table 1 shows mean and s.d. values for anthropometric measurements and index derivatives. In the comparison with the reference values one case (1.6%) with the tricipital skinfold under the Pth5 was recorded. Additionally, 17 cases (27.4%) presented values for height and one case (1.6%) values for suprailiac skinfold upper of Pth95.
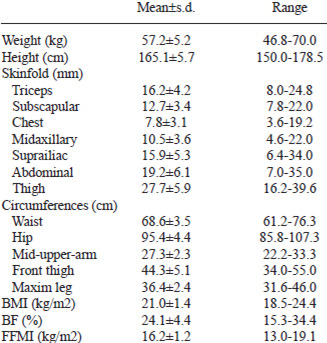
According to the classification for the %BF, 19.4% obtained data lower than normal values, 71.0% were within normal values, 8.1% were considered borderline values and the rest (1.6%) were obese. According to the FFMI, 12.9% of the total was classified as low musculature, 58.1% as normal musculature and 29.0% as high musculature. There were no cases with values for FFMI ≥22 kg/m2.
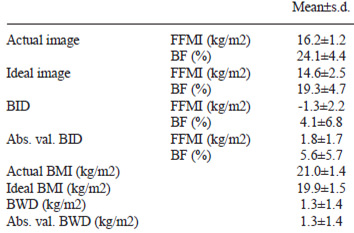
Respect to the prevalence of BWD, all participants expressed some degree of dissatisfaction (BWD: actual weight ≠ ideal weight), 67.7% desired to weigh less (actual weight > ideal weight) and the rest (32.3%) wanted to weigh more (actual weight < ideal weight). In Table 2 the results of magnitude of body image and weight dissatisfaction are presented. BWD (actual-ideal BMI) among participants who desired to weigh less was 1.8±1.56 kg/m2 (95%IC: 1.14; 2.46, p<0.001) and that among participants who desired to weigh more was 0.56±0.73 kg/m2 (95%IC: 0.16; 0.96, p<0.05). BWD was correlated with BMI (r=0.392, p<0.05) and selfreported BMI (r = 0.443, p<0.01).
With regard to the ideal measurements, 10.8% of the sample chose an ideal body weight within the underweight BMI classification (<18.5 kg/m2) and 37.8% chose an ideal %BF under the normal values and none of the participants selected values for %BF above the normal. Ideal FFMI under the considered normal was chose by 21.0% and values for FFMI higher than normal by 11.3%.
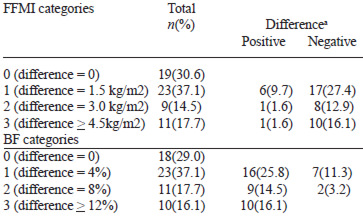
Table 3 shows the prevalence of BID by body compartments. For FFMI, more participants presented dissatisfaction due to low levels than due to high levels of muscle (χ2= 16.953, p<0.001), while for BF more individuals showed dissatisfaction due to high levels than due to low levels of fat (χ2= 15.364, p<0.001). BF dissatisfaction was significantly associated with BMI (r=0.251, p<0.05) and self-reported BMI (r=0.272, p<0.05). These associations were not found between FFMI dissatisfaction and BMI (r=0,076, p>0.05) or self-reported BMI (r=0.054, p>0.05).
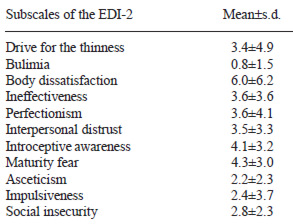
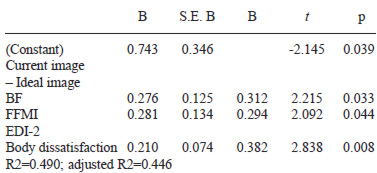
The results obtained in the subscales of EDI-2 are shown in Table 4. The BWD was correlated with BF dissatisfaction (r= 0.381, p<0.05), FFMI dissatisfaction (r=0.341, p<0.05) and several subscales of EDI-2 (body dissatisfaction r=0.339, p<0.05; introceptive conscience r=0.385, p<0.05; impulsiveness r=0.344, p<0.05). The multiple linear regression analysis (Stepwise method) was conducted to examine predictors of the magnitude of BWD (Table 5). BWD was greater among those with higher levels of BF dissatisfaction, FFMI dissatisfaction and higher score in the subscale of EDI-2 “body dissatisfaction”.
The objective of this study was to examine the extent of body weight and image dissatisfaction in a sample of women in dietetics major with normal BMI value. Generally, the results support previous work suggesting that body weight and body image dissatisfaction is felt by women with normalweight, and increases with increasing BMI (31-34). Consistent with our hypotheses, a larger proportion of students with normal BMI values chose an ideal body weight lower than the actual, and a body image with less body fat and more muscle mass than actual values.
With respect to the prevalence of BWD, all participants expressed some degree of BWD, 67.7% desired to weigh less, and the rest (32.3%) wanted to weigh more. Similar results were obtained in Spain where 70% of university women desired to weigh less (35), and in Portugal where the percentage was 66.9% (36). However, our frequencies were higher than those obtained by Bellisle et al. (37) in a study undertaken in 21 European countries, where they identified a 44% of women who desired to weigh less.
In the present study, women who desired to weigh less showed an average weight discrepancy of more than one BMI unit. Other authors registered similar desires of loss of weight (14). Encouragingly, the average desired weight among women of our study was within the normal BMI range. Only 10.8% of women in the present study desired a weight within the underweight BMI range (<18.5 kg/m2).
Additionally, the magnitude of BWD was associated with FFMI dissatisfaction, BF dissatisfaction and the subscale of EDI-2 “body dissatisfaction”. Regarding the BID, 69.4% of participants were dissatisfied with the index of muscularity, and 71% with the %BF. For FFMI, more participants presented dissatisfaction due to low levels than due to high levels of muscle on their bodies, while in BF more individuals showed dissatisfaction due to high levels than due to low levels of fat on their bodies. Thus, a larger proportion of students chose a body image with less body fat than actual values. These results could be related to the ideal of women’s beauty (38). Several studies support the importance of the ideal of thinness in the development of body dissatisfaction (39,40).
A larger proportion of participants choose a body image with more muscle mass than actual too. The idea of well-developed musculature and the desire of higher muscle mass than actual values, are very well documented in males (41,42), while the dissatisfaction with muscularity in women had not been documented. The concept of muscularity in women is relatively new in our society and there are not known publications on the subject.
Several limitations of this research should be noted. First, although all participants were classified as normal BMI, 19.4% had values of BF% lower than normal, and 1.6% higher (obesity). It highlights the limitations of BMI to identify underweight and overweight/obesity cases, as other authors have published (43,44). However the present study included some measurements (anthropometric measurements, self-reported measurements, self-perception of body image, EDI-2) that allowed to compare objective and subjective indices and that allowed to contribute to major construct validity of the body dissatisfaction. The second limitation of the study was the fact than the participants were volunteers and therefore not chosen randomly.
In conclusion, our results suggest that a larger proportion of women with normal BMI value will choose an ideal body weight lower than actual weight. This outcome shows that dietetic students share with general and young people the cultural pressures on body image and the high sociocultural influences in aesthetic body shape that is related with eating disorders (45). In this sense, Merino et al. (46) underlined the fact that girls are the most affected group by the cultural pressure and that this pressure to be slim plays an important role in the origin and maintenance of eating disorders.
In the present study, the magnitude of BWD was associated with FFMI and BF dissatisfaction, and the subscale of EDI-2 “body dissatisfaction”. So, from a public health standpoint, it is vital to increase the sample size and to include other autonomous region to better understand the extent of BWD, and how this dissatisfaction could interfere with their professional practice.
Undue concern or preoccupation with body weight does influence the students´ ability to perform in food-focused courses or impact on future practitioners’ effectiveness. Therefore dietetic educators may develop educational strategies which are better aimed at adoption of appropriate attitudes about personal body image and of healthful weight control procedures by students.
Authors express their gratitude to all participants and to Mariana Briote (dietitian/nutritionist) and Arturo Fernández (translator).
Recibido: 15-12-2009
Aceptado: 20-05-2010