
To investigate the relationship of dyslipidemia with demographic distribution and patterns of body fat and dietary intakes. From a universe of adults clinically selected for a lifestyle modification program 979 subjects (409 males and 570 females, 52.2 ± 9.6 years) fulfilled the inclusion criteria. Overnight-fasting plasma was assayed (dry chemistry) for triglycerides (TG), total (TC) and HDL fraction of cholesterol given the non-HDL (n-HDL) fraction by the difference. Anthropometric assessment included body weight (kg), height (m), fat (bioelectrical impedance) and waist circumference (WC). Food intake was assessed by the 24-hour recall questionnaire and the food groups evaluated through recommendations from an adapted food pyramid. The chances of dyslipidemia from other variable changes were determined by logistic regression with p<0.05. Normal values of BMI and WC were protective against all dyslipidemia markers whereas only hypercholesterolemia was influenced by diet (meat intake >2 servings). Dietary intakes have protective effects against hypertriglyceridemia with whole grains, odds ratio (OR) 0.342 (CI 95%, 0.154-0.760), fruits >3 servings (OR 0.523, 0.290-0.941) and vegetables >4 servings (OR 0.360, 0.176-0.735). In general total body and abdominal adiposity influenced all dyslipidemia markers while dietary intake of fruits and vegetables protected against triglyceridemia.
Key words: Dyslipidemia, body composition, dietary components.
Investigar las relaciones de dislipidemia con distribución demográfica y patrones de masa corporal e ingestión de alimentos. De un universo de adultos clínicamente seleccionados para un programa de modificación de estilo de vida, 979 sujetos (409 hombres y 570 mujeres, 52,2 ± 9,6 años) cumplieron con los criterios de inclusión. Se examinó el plasma cosechado tras ayuno nocturno (química seca) para averiguar si hay la presencia de triglicéridos (TG), colesterol total (CT) y fracción de colesterol dada la fracción no HDL por diferencia. Una evaluación antropométrica incluyó peso corporal (kg), altura (m), grasa (impedancia bioeléctrica) y circunferencia de la cintura (CC). Se evaluó la ingestión de alimentos con el cuestionario de tipo recordatorio de 24 horas y los grupos de alimentos evaluados por la pirámide de alimentos recomendada. Se determinaron las probabilidades de dislipidemia de otros cambios variables con regresión logística p<0,05. Valores normales de BMI y CC protegieron de todos los marcadores dislipidémicos mientras solamente hipercolesterolemia fue influenciada por la dieta (ingestión de carne >2 porciones). El consumo en la dieta protege de hipertrigliceridemia con odds ratio de granos integrales (OR) 0,342 (CI 95%, 0,154-0,760), frutas >3 porciones (OR 0.523, 0.290-0.941) y hortalizas >4 porciones (OR 0.360, 0.176-0.735). En general la adiposidad corporal total y abdominal influenció todos los marcadores de dislipidemia y solamente la trigliceridemia fue protegida por ingestión de frutas y hortalizas en la dieta.
Palabras clave: Dislipidemia, composición corporal, componentes de la dieta.
Department of Public Health, Botucatu School of Medicine, São Paulo State University (UNESP), São Paulo, Brazil
Cardiovascular disease is indicated as the most frequent cause of death in developed and developing countries (1,2), while dyslipidemias represent modifiable risks for coronary diseases (3,4).
Dyslipidemia prevalence in Brazil varies greatly by region, with greater variations occurring in individuals older than 40 years (5). Regarding gender, higher prevalence is observed among males (30.8%) than females (18.1%) (5).
Studies have shown the association between anthropometric indicators and dyslipidemia (6-8). Diet is also a relevant factor in dyslipidemia (9,10). Thus lifestyle change, which includes healthy eating habits and physical exercise as its major measures, plays an important role in primary care and, consequently, in dyslipidemia reduction (11-13).
Given the importance of factors that may influence lipidemia, the present study aimed to evaluate the following major predictors: altered serum concentrations of total cholesterol (TC), triglycerides (TG), non-HDL cholesterol (nHDL-C) and HDL-cholesterol (HDL-C).
A descriptive cross-sectional study was conducted on a subgroup of participants clinically screened for the lifestyle change program “Mexa-se Pró-Saúde [Move for Health]”, Botucatu, SP, from 2002 to 2007. The nine hundred and seventy-nine individuals investigated comprised 409 males and 570 females with a mean age of 52.2 ± 9.6 years and BMI of 28.6 ± 4.9 kg/m2. All the subjects signed a free consent form, and the research project was approved by the Research Ethics Committee (document no. CEP 3271-2009) of the Botucatu School of Medicine (FMB), São Paulo State University (UNESP), Brazil.
The 24-hour recall method was used as a dietary inquiry in order to assess food intake (14). The dietary data obtained from house measurements were converted to grams and milliliters so as to enable chemical analysis of the food consumed. The centesimal composition of the food reported in the recollections was estimated by the software NutWin® (2002), version 1.5. The food types that were not found in the software were added from various composition tables and food labels (15-17).
The food groups were evaluated based on the servings recommended by the Adapted Food Pyramid (18).
Body weight was measured by a platform-type anthropometric scale (Filizola®) with a maximum capacity of 150 kg and an accuracy of 0.1 kg. Height was determined by a portable Seca® stadiometer with an accuracy of 0.1cm (19). Using body weight and height measurements, BMI (weight/height (m)2) was calculated and classified according to the criteria established in the literature (20).
Waist circumference (WC) was measured at the point midway between the last rib and the iliac crest. A steel Sanny® anthropometric tape measure (without a lock) was used for all measurements. Values above 102 cm (40.16 inches) for men and 88 cm (34.65 inches) for women were defined as altered (4).
A bioelectrical impedance device (Biodynamics®, model 450, USA) was used to determine body fat percentage (%BF). Values between 15 to 25% for males, and 20 to 35% for females were considered to be normal (21).
Blood samples were collected by vacuum venous puncture, after a 10 to 12-hour fasting period. The individuals were previously advised to not perform vigorous physical exercises 24-hours and/or consume alcohol 72-hours prior to blood collection. Laboratory analysis of lipid parameters (total cholesterol total, fractions and triglycerides) were performed within 4 hours after blood collection using the dry-chemistry method (Vitros® system, Johnson & Johnson) at the Clinical Biochemistry Laboratory of the Botucatu (SP) School of Medicine – Clinical Hospital. The nHDL-C values were defined as the difference between TC and HDL-C. Concentrations of TG >150mg/dL (22), TC >200mg/dL (23), HDL-C <40mg/dL for men and <50mg/dL for women (22), and nHDL-C >187mg/dL (P75) were considered to be outside of the normal range.
Descriptive characteristics were illustrated by mean and standard deviation. Regression models for data with negative binomial distribution were fitted for food intake characterization. In order to determine the probability of lipidemia alteration by food intakes and anthropometry, logistic regression was adjusted for gender and age (model 1); and gender, age, BMI and total caloric intake (TCI) (model 2). P < 0.05 was adopted as a significant value. The SAS, version 9.1 software package was used for statistical analysis.
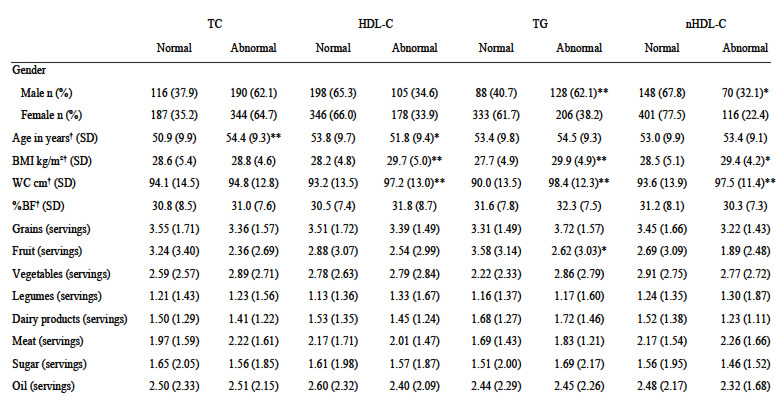
Table 1 shows the demographic, anthropometric and foodintake characterization according to the individual’s lipidemia classification. Males showed greater hypertriglyceridemia and serum nHDL-C concentrations when compared to females. Older individuals showed greater serum-TC concentration variation, and younger persons showed lower HDL-C. Individuals with lower HDL-C, elevated TG and elevated nHDLC had higher BMI and WC values. Those with hypertriglyceridemia had lower fruit intake than individuals with normal TG values.
Normal BMI and WC values showed a protective effect against abnormal HDL-C, TG and nHDL-C concentrations, while normal %BF values tended to protect for normal HDLC and TG concentrations (Table 2).
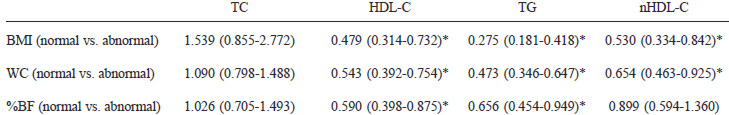
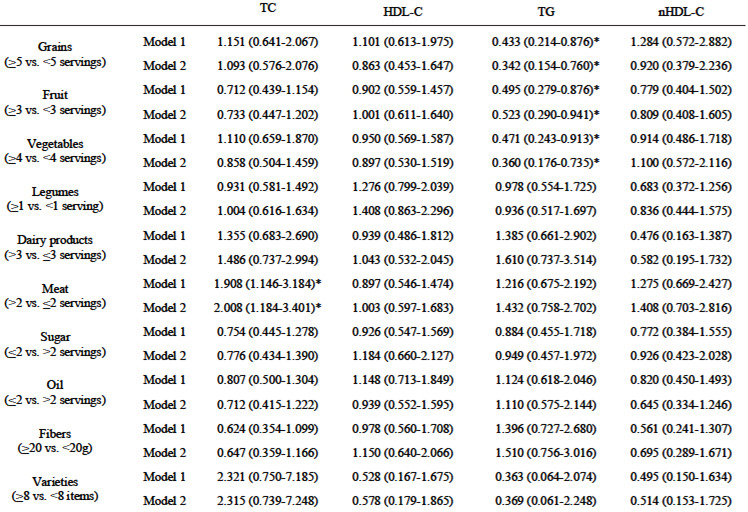
Table 3 shows the odds ratio for dyslipidemias by food intake according to 2 adjusted models (gender + age and gender + age + BMI + TCI). Meat intake above the recommended value (>2 servings) was shown to be a significant risk factor for total cholesterolemia. Intake of recommended values of grains (>5 servings), fruits (>3 servings) and vegetables (>4 servings) produced a protective effect against triglyceridemia. No influence of diet components on HDL-C or nHDL-C was observed (Table 3).
Hence, male gender and high BMI and WC were observed to be risk factors for high TG values; whereas normal BMI, WC and %BF, as well as adequate intakes of fruit, vegetables and grains, were protective factors against hypertriglyceridemia. As for hypercholesterolemia, the risk factors were older age and greater ingestion of meat. Abnormal nHDL-C concentration presented the following risk factors: male gender, age <60 years, and high BMI and WC values. No significant influences from diet on nHDL-C or HDLC variations were observed. The risk factors for HDL-C were age <60 years, and higher BMI and WC values whereas, only normal anthropometric values (BMI, WC and %BF) were found to be protective factors.
In the present study, the influences of male gender on hypertriglyceridemia, old age on hypercholesterolemia and of age <60 years on nHDL-C were observed. Males showed the greatest lipidemic variation.
A study conducted by Kolovou et al (24), in Greece, reported that women showed higher cholesterol concentrations (HDL-C) and lower TG concentrations than males. In Brazilian studies, low HDL-C concentrations are also more prevalent in males (5, 25-27).
The present investigation shows that the population with dyslipidemia is in the age range of approximately 50 years. Those showing elevated concentrations of total cholesterol are older. These findings confirm the results observed in the cities of São Paulo (SP) and Campo dos Goytacazes (RJ) and the state of Rio Grande do Sul, which reported higher prevalences of elevated cholesterol among individuals in the 50-to-59 age range or older (5,27,28). In our study, although the population with lower HDL-C was within a similar age range, the 20% to 60% of subjects that presented dyslipidemia were found to be younger. Martinez et al (29), also reported a hypercholesterolemia prevalence of 40%.
Elevated values of BMI, WC and %BF were the major determinants of dyslipidemias in the present sample, particularly of TG, HDL-C, and nHDL-C.
Chehrei et al (8) observed that BMI and WC were positively correlated with TC, TG and LDL-C while HDL-C was negative correlated with WC. Henriksson et al (6) reported that BMI was positively correlated with TC and nHDL-C and negatively correlated with HDL-C.
Pietrobelli et al (30) observed that the inverse relation of HDL-C to BMI may be partly due to the decreased thin tissue and cellular mass. In agreement with our results, Yu et al (31) observed that triglyceridemia and LDL-C were significantly higher in the group with abnormal values for adiposity (%BF, waist-to-hip ratio and visceral adiposity). Additionally, when studying eutrophic individuals, Ito et al (32) found that WC and %BF were significantly correlated with TC, TG, HDL-C and LDL-C.
In the present study, the dietary components (meat, grains, fruits and vegetables) were observed to exert significant influences on dyslipidemia. Higher meat intake values than those recommended by the dietary pyramid showed a risk effect on TC concentrations.
The Western dietary pattern is characterized by high intake of food rich in hydrogenated fat, refined grains and red meat, which are related to increased cardiovascular risk (33). Other studies have also found evidence of the effects of meat intake on lipidemia (34,35). Azadbakht and Esmaillzadeh found that individuals in the lowest quintile present a probability of approximately 2.3 times for showing lower HDL-C (OR 2.32; CI 95%, 1.33-4.16) and 2.6 times of higher TG concentrations (OR 2.63; CI 95%, 1.42-4.66) (34). When investigating women’s dietary patterns and their association with heart disease risk, Hoffmann et al (35) concluded that high intake of meat and low intake of vegetables and whole grains are associated with reduced HDL-C concentrations.
The types of grains ingested strongly influenced lipidemia. In the present study, whole grains – composed of bran, germ and endosperm – are probably the main grain source. When refined, only the endosperm, which is rich in carbohydrates, is maintained while other components – such as fiber, vitamins, minerals and antioxidants – are removed along with bran and germ (36). These compounds influence cardiovascular risk by means of glycemic homeostasis (37,38), lipids and lipoproteins (39), endothelial function (40) and other mechanisms. It is observed that individuals who consumed >5 servings of grains per day were shown to be protected against hypertriglyceridemia. A study conducted by Esmaillzadeh et al (41) found an inverse association between whole grain intake and metabolic syndrome (MS). The OR association measurement showed the protective effect, among the second quartile, of whole grain intake on glycemia (41).
In the present investigation, the fruit and vegetable intakes showed a protective effect on triglyceridemia, one of the components of MS. Various studies have shown the association of low fruit and vegetable intakes with MS development (42-44). A study conducted in Greece shows that a dietary pattern characterized by higher consumption of grains, fish, legumes, vegetables and fruits is independently associated with reduced MS risk (45).
In the present study, it was observed that dyslipidemias are associated, in varied types and intensities, with demographic, anthropometric and dietary factors. The male gender, older age, and high BMI, WC and %BF values were the common risk factors. Higher meat intake was the only dietary factor implicated in total hypercholesterolemia. The main protective factors found, and therefore recommended to avoid hypertriglyceridemia are the normalization of anthropometric variables (all dyslipidemias, except for TC) and/or greater intake of grains, fruits and vegetables.
The authors are grateful to FUNDAP (Fundação do Desenvolvimento Administrativo do Estado de São Paulo), CAPES (Coordenação de Aperfeiçoamento de Pessoal de Nível Superior), CNPq (Conselho Nacional de Desenvolvimento Científico e Tecnológico) and GAP (Grupo de Apoio à Pesquisa) of the Botucatu School of Medicine, São Paulo State University (UNESP).
Recibido: 18-01-2010
Aceptado: