
We hypothesize that the Ferric Reducing Antioxidant Power (FRAP) assay that follows the reaction of Fe3+-TPTZ at 593 nm underestimates the antioxidant capacity of fruits, since the standardized time of the reaction (4 min) is not enough to titrate all the reducing compounds available. We measured FRAP, total phenolics and anthocyanins content in a variety of Chilean berry fruits (blueberries, blackberries, raspberries and strawberries) and apples (cv. Fuji, Granny Smith, Pink Lady, Red Delicious and Royal Gala). Taking into account the dependence of FRAP on the time course of the reaction, we propose to measure FRAP indexes after 1 min (FRAP-1), 30 min (FRAP-30) and 120 min (FRAP-120) of incubation. Most fruit extracts showed significant correlations between the antioxidant capacity and the incubation time, although in some cases the FRAP indexes did not correlate with the total phenolics and/or anthocyanins content. In fact, in apples and berries the correlation between anthocyanins content and FRAP indexes decreased with the incubation time. It is concluded that the fruit extracts analyzed require an incubation period higher than the established in the original experimental protocol to reach the equilibrium, due to the presence of a complex mixture of antioxidant compounds. In addition, a kinetic profile should be realized in each sample studied to establish the most suitable incubation period to titrate all the reactive antioxidant species.
Key words: FRAP, berries, apples, antioxidant capacity, incubation time
Se plantea que el ensayo de la capacidad antioxidante de frutas, medido según el poder reductor de hierro (FRAP), que sigue la reacción de Fe3+-TPTZ a 593 nm, subestima la capacidad antioxidante, debido a que el tiempo de reacción (4 min) no sería suficiente para que reaccionen todos los compuestos reductores disponibles en las muestras. Se analizó la capacidad antioxidante FRAP, el contenido de fenoles y de antocianinas en diversos berries (arándano, mora, frambuesa y frutilla) y manzanas (cv. Fuji, Granny Smith, Pink Lady, Red Delicious y Royal Gala). Tomando en cuenta la dependencia del tiempo de incubación en el valor FRAP, se propone medir los índices FRAP después de 1 min (FRAP-1), 30 min (FRAP-30) y 120 min (FRAP-120). Diversos extractos de las frutas analizadas mostraron una correlación significativa entre la capacidad antioxidante y el tiempo de incubación; sin embargo, en algunos casos los índices FRAP no se correlacionaron con el contenido de fenoles totales y/o antocianinas. En efecto, en manzanas y berries la correlación entre el contenido de antocianinas e índices FRAP disminuyó con el tiempo de incubación. Se concluye que los extractos analizados requieren un tiempo de incubación mayor al que establece el protocolo analítico original para alcanzar el equilibrio, debido a la presencia de una compleja mezcla de compuestos antioxidantes. Además, el perfil cinético de cada muestra debería ser estudiado para establecer el periodo de incubación más adecuado para titular todas las especies antioxidantes reactivas.
Palabras clave: FRAP, berries, manzanas, capacidad antioxidante, tiempo de incubación
Facultad de Farmacia, Universidad de Valparaíso, Chile. Facultad de Química, Pontificia Universidad Católica de Chile, Santiago, Chile. Instituto de Nutrición y Tecnología de los Alimentos, Universidad de Chile, Santiago, Chile. Centro Regional de Estudios en Alimentos Saludables (CREAS), Valparaíso, Chile
Epidemiological studies and clinical trials have established that a high dietary intake of fruits and vegetables is associated with a reduced risk of developing some chronic diseases, including several types of cancer, cardiovascular diseases, diabetes and other degenerative or age-related diseases (1,2). These associations may be partly attributable to the presence of antioxidant nutrients and phytochemicals, such as various phenolic compounds that contribute to protect cells against the oxidative damage caused by reactive oxygen and nitrogen species (3). Apples and berries are ranked among the fruits with higher antioxidant capacity (4,5), due to the presence of polyphenols (mainly flavonoids) and phenolic acids, among other antioxidants (6-11). Epidemiological studies indicate that the intake of apples and berries is associated with several risk-lowering effects due to the occurrence of these putatively bioactive compounds (8,12-14).
In recent years, several in vitro methodologies have been proposed to determine the total antioxidant capacity of fruits, vegetables and beverages (15). The assays differ in their chemistry (generation of different radicals and/or target molecules) and the end points measured (16). Among the various techniques available, the procedure developed by Benzie and Strain (17) is widely used, rendering a FRAP (Ferric Reducing Antioxidant Power) index related to the capacity of the sample to reduce ferric species. The method evaluates the reduction of Fe3+-tripyridyltriazine complex (Fe3+-TPTZ) by turning it into a blue colored (λ = 593 nm) ferrous form (Fe2+-TPTZ). The methodology was originally applied to determine the antioxidant capacity of plasma, and now it is currently employed in foods and plant extracts (16,18-20). The experimental protocol establishes that an incubation time of 4 min at 37ºC is a suitable condition to assay the total antioxidant capacity of most samples, because the redox reactions proceed so rapidly that they are completed during this period. However, FRAP values may vary enormously, depending on the time scale of the analysis (15,18). We investigated the hypothesis that the standard application of the FRAP assay underestimates the antioxidant capacity because the incubation period is not long enough to titrate all the reducing compounds available in the food samples.
Therefore, the aims of the present study were: 1) to evaluate the antioxidant capacity of various apples and berries using the standard FRAP methodology, 2) to propose and apply new FRAP indexes, depending on the reaction time allowing the formation of Fe2+-TPTZ. In addition, the correlations between the antioxidants content (phenolics and anthocyanins) and FRAP indexes are evaluated.
The berries studied were: blueberries (Vaccinium corymbosum) (cv. Duke), blackberries (Rubus ulmifolius) (cv. Cherokee), raspberries (Rubus idaeus) (cv. Heritage), and strawberries (Fragaria ananassa) (cv. Camarosa). The apple (Malus domestica) cultivars studied were: Fuji, Granny Smith, Pink Lady, Red Delicious, and Royal Gala. All apples and berries were harvested at the ripe stage, in a commercial plantation located in Central Chile (latitude 34º 41’ to 36º 33’ S). All samples were sorted to eliminate damaged, diseased or poor quality fruits, obtaining samples that were uniform in size, ripeness and color. The selected fruits were stored at -20ºC until analysis (within 2 months).
The moisture content of each sample was determined gravimetrically by weight difference after the sample was heated at 70ºC for 16 h in an oven (21).
Apples: Extracts of apple peel and pulp were obtained from a minimum of ten randomly selected fruits that were carefully cut into quarters, eliminating their seeds and core. Peel (portion without pulp) was obtained by cutting the fruit with a stainless steel vegetable peeler. Pulp (portion without peel) was obtained from the peeled fruits cut into small pieces, excluding the core and seeds.
The extractive procedure applied for each assay was as follows (7,22):
In all cases, the mixtures were homogenized for 1 min in an Ultra Turrax homogenizer (OMNI International, GLH-02, Kennesaw, U.S.), and the extracts were shaken in a water bath at 20°C for 60 min. Three samples (1.5 mL) were centrifuged at 2500g for 15 min at 4°C and the supernatants were stored at 4°C until their analysis.
Berries: 5 g of each berry were mixed with 150 mL extraction solvent (acetone:water 70:30) (7,23). The mixture was homogenized for 5 min in an Ultra Turrax homogenizer, and the extracts were shaken in a water bath at 20ºC for 60 min. Three samples (1.5 mL) were centrifuged at 2500g for 15 min at 4ºC and the supernatants were stored at 4°C until their analysis.
All extractions were performed at 0-4ºC to minimize degradation.
The anthocyanins content was expressed as mg anthocyanin standard equivalents per 100 g dry weight (mg anthocyanin/100 g d.w.). Different standard anthocyanins were used depending on the sample analyzed. Thereby, for apple peels cyanidin-3-galactoside (ε530 nm = 34300 M-1cm-1, MW = 502.5 g mol-1) was used. For blueberries, blackberries and strawberries we used cyanidin-3-glucoside (ε510 nm = 26900 M-1cm-1, MW = 449.2 g mol-1), while for strawberries we used pelargonidin-3-glucoside (ε530 nm = 22400 M-1cm-1, MW = 486.5 g mol-1).
All results were expressed as mean + standard error (SE) of three samples taken under every condition evaluated. All the analyses were run in triplicate. The evaluations were performed by one-way analysis of variance and Tukey-Kramer test was carried to establish significant differences among means. Differences among means at 5% level (p<0.05) were considered statistically significant. The correlations between the antioxidant capacity and total phenolics and anthocyanins content were examined using Pearson correlation. All statistical analysis and correlations were made with SAS® (Version 8.0, SAS Institute, Inc, Cary, North Caroline, USA).
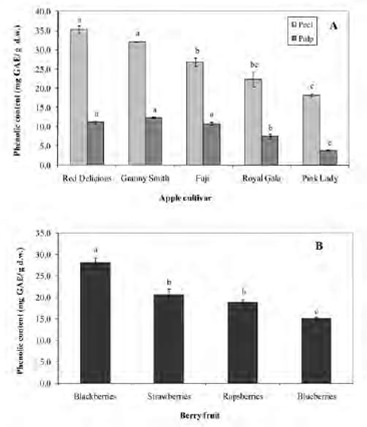
The total phenolics content of peel and pulp of all apple cultivars and berries are shown in Figures 1A and B, respectively. The total phenolics content was dependent on the apple cultivars and the fruit tissue. In apples, peel samples showed 2.5 to 4.8-fold higher phenolics content than pulp samples (p<0.05) (Fig 1A). In berry fruits, total phenolics were dependent on the type of crops (p<0.05) (Fig 1B). Blackberries showed the highest phenolics content (28.1 mg GAE/g d.w.), followed by strawberries, raspberries and blueberries. Blackberries exhibited values near two-fold higher content than the other berries studied.
The anthocyanins content of apple peel and berries are depicted in Figure 2A and B, respectively. Since apple pulp does not contain anthocyanins, these compounds were not analyzed (24). The mean content of anthocyanins in apple peel ranged from 75.9 to 2.5 mg cyanidin 3-galactoside/100 g d.w. (p<0.05). Interestingly, Red Delicious apples exhibited the highest anthocyanins content, almost threefold higher than cv. Pink Lady and Fuji. On the other hand, Royal Gala and Granny Smith showed lower contents (5.2 and 2.5 mg cyanidin 3-galactoside/100 g d.w., respectively). In berries, the anthocyanins content ranged from 939.5 to 397.9 mg/100 g d.w. Blueberries and blackberries showed similar amounts, two-fold higher than the values observed in raspberries and strawberries.
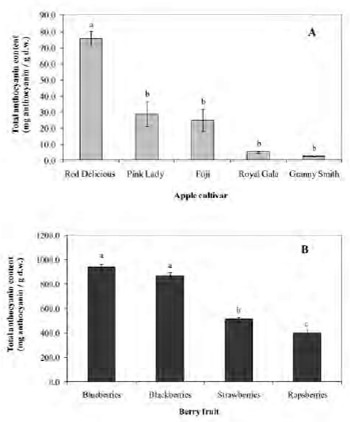
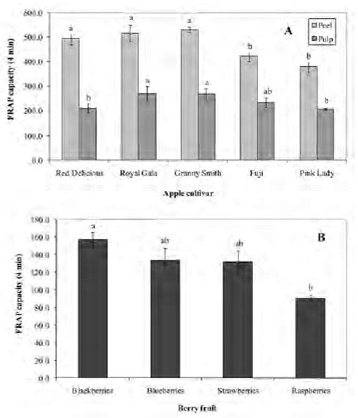
Figure 3 shows the FRAP values of apple peel and pulp samples and berries (A and B, respectively). Apple peel exhibited higher FRAP in all the cultivars studied (p<0.05). In apple peel, FRAP ranged from 493.2 to 379.1 μmol Fe2+/g d.w. The decreasing antioxidant capacity order in the cultivars was: Granny Smith > Royal Gala > Red Delicious > Fuji > Pink Lady. FRAP values of apple pulp ranged from 267.0 to 206.5 μmol Fe2+/g d.w. Depending on the cultivar, the antioxidant capacity of apple peel was 2.4 to 1.8-fold higher than the respective values of the pulp. As shown in Fig 3B, FRAP of berries ranged from 157.5 to 90.8 μmoles Fe2+/g d.w. (p<0.05). The decreasing order of FRAP values was: blackberries > blueberries > strawberries > raspberries.
Figures 4 A and B show the time-course of the Fe2+-TPTZ formation in apples and berries, respectively. As seen in these figures, FRAP increased with the incubation time. Fig 4A (upper) depicts the kinetic profiles of apple peel. The FRAP-120 capacity of Red Delicious peel was nearly 2.6 and 1.2-fold higher than the FRAP-1 and FRAP-30 values, respectively. In the other apple cultivars, FRAP-120 increased in a lower ratio. Fig 4A (lower) shows the kinetic profiles of Fe2+-TPTZ formation in apple pulp. In this case, smaller variations were observed between FRAP values obtained after 1, 4, 30, or 120 min of reaction. Figure 4B depicts the time-dependence of the antioxidant capacity of berry fruits. All berries showed a high FRAP-120 index, doubling the initial values obtained at 1 and 4 min. In addition, at 120 min the results were 1.3 and 1.4-fold higher than the value obtained at 30 min. These results demonstrate that the antioxidant ability, evaluated by the FRAP assay, is dependent on the incubation time. Consequently, we propose the use of different FRAP indexes, depending on the time of incubation. Thereby, from the data shown in Figure 4, a FRAP-1, FRAP-30 and a FRAP-120, evaluated after 1 min, 30 min and 120 min of reaction, respectively, were determined. These indexes for apples and berries are shown in Tables 1.
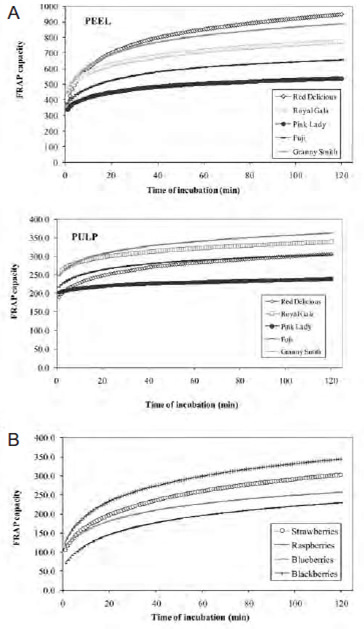
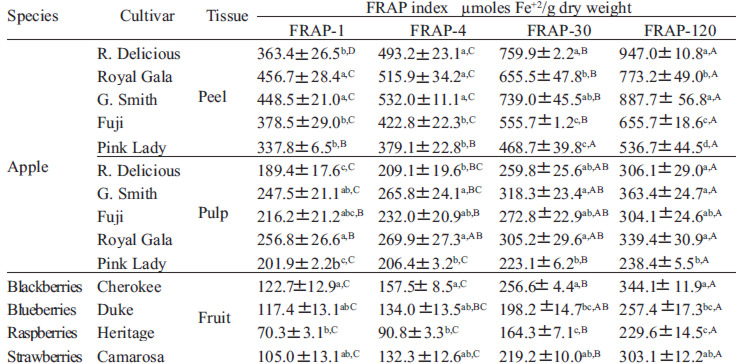
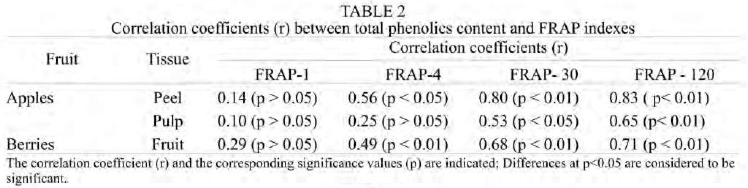
Table 2 shows that FRAP-30 and FRAP-120 were highly correlated with the total phenolics in the apple peel samples (r = 0.80 and 0.83, respectively). However, the standard FRAP value (FRAP-4) showed a weak correlation, indicating that under this condition the dependence on the phenolics is lower (r = 0.56). FRAP-1 showed no relationship with the phenolics content, revealing that the determination at initial times of incubation underestimates the real antioxidant capacity. No relationship was observed between FRAP-4 and FRAP-1 with the total phenolics content in apple pulp. However, when we augmented the incubation time, these correlations increased significantly. Thus, the correlation observed between FRAP-30 or FRAP-120 with the phenolics content was 0.53 and 0.65, respectively. Similar results were observed in berry fruits, since the correlation between FRAP indexes and total phenolics increased with the incubation time.
The correlation coefficients between FRAP at 1, 4, 30 and 120 min values and anthocyanins are shown in Table 3. In apple peel, the correlation was low and not significant at 30 and 120 min of incubation (r = 0.21 and 0.29, respectively). Opposing what was observed with total phenolics, the correlation between anthocyanins and FRAP decreased with the time of incubation. Similar results were observed in berries, indicating that the anthocyanins contained in these fruits are titrated at short reaction times.
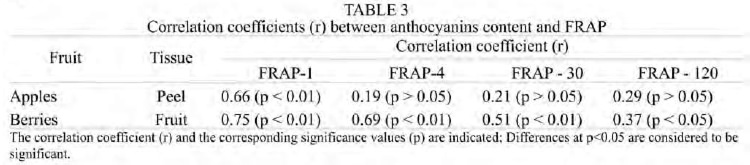
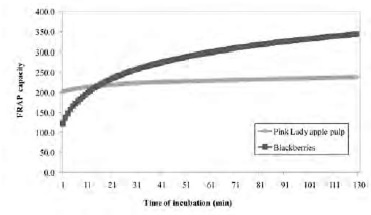
Figure 5 shows the kinetic profile of FRAP of Pink Lady apple pulp and blackberries. The FRAP capacity of apple pulp was 1.6 and 1.3 times higher than blackberries at 1 and 4 min of reaction, respectively. However, when FRAP-120 is measured, blackberries showed values 1.4 fold higher than the apple pulp values. This effect is better illustrated if we consider the FRAP-30 index: in this case, of Pink Lady apple pulp had FRAP-30 values 1.4 times lower than blackberry (Table 1).
The total phenolics measured in various apple cultivars are consistent with previous reports showing that the peel fraction contain higher amounts of these compounds than other edible parts of this fruit (10,26-29). Depending on the cultivar, phenolics in apple peel range from two to five times over the respective pulp fractions (27,28,30). In agreement with Tsao et al. (26), Red Delicious peel exhibited the highest phenolics content. The anthocyanins content of apple peel is associated with their appearance (27), and Red Delicious apples, deeply red colored, exhibited the highest amounts. The color is attributed mainly to the presence of a mix of cyanidin glycosides, of which cyanidin 3-galactoside is the main one, followed by traces of cyanidin 3-glucoside, 3-arabinoside, 3-xyloside, and 7-arabinoside (26,27).
In agreement with our results, Heinonen et al. (23) and Wu et al. (4) showed that blackberries exhibit the highest total phenolics content, while Wu et al. (4) reported that blueberries exhibit a low value in comparison with blackberries and strawberries. On the other hand, the ranking observed in the anthocyanins content in the berry samples is in agreement with Kalt et al. (31). Similarly, Wang and Lin (32) reported that blackberries have higher anthocyanins contents than raspberries and strawberries.
FRAP is a convenient method widely used to estimate the antioxidant capacity of pure compounds as well as complex mixtures, such as fruits and vegetables. As already stated, FRAP assay measures the total capacity of a sample to reduce Fe3+ into Fe2+ after 4 min (FRAP-4) and equates such reducing ability to the total antioxidant capacity of the sample. The results obtained in FRAP-4 indicate that apple peel possess highly reactive antioxidants, which is in agreement with previous results (10,29,30,33). Interestingly, Chinnici et al. (34) associated the antioxidant capacity of apple peel (duplicating those in apple pulp) with a high concentration of phytochemicals such as quercetin glycosides and procyanidins. The apple cultivar exhibiting the highest FRAP value at 30 and 120 min was Red Delicious, which is in agreement with the values reported by Tsao et al. (33) and Lotito and Frei (35) in apple extracts. Depending on the cultivar, the antioxidant capacities of apple peels were 2.4 to 1.8-fold higher than the respective pulp values. These proportions are in agreement with Wolfe et al. (27), Drogoudi et al. (28), and Chinnici et al. (34). Considering the putative health protective compounds found in apple peel, this fraction may be freshly consumed in various forms as a valuable source of natural antioxidant phenolics and has a potential use as a valuable ingredient in the formulation of functional foods (36).
The high antioxidant capacity of blackberries is attributed to their content of phenolic acids and anthocyanins, which possess strong antioxidant activity (16). The ranking order of FRAP-4 values observed in berries is consistent with previous reports (37). However, Pellegrini et al. (16) and Halvorsen et al. (38) reported a different order. This is probably associated with the genetic characteristics (cultivars), environmental factors, agronomic practices, maturity and/or post-harvest conditions, all of which affect their chemical constitution and therefore, their antioxidants content (8,39).
The FRAP methodology has been proposed considering the evaluation of the visible absorption (at 593 nm) of Fe2+-TPTZ complex after 4 min of reaction. This end point has been associated with a stabilization of the absorbance of the ferrous complex (17). However, when these conditions were applied to apple and berry samples, a continuous increase of the absorbance at 593 nm was observed. Thus, FRAP values showed a strong dependence on the time of incubation. In effect, mean initial FRAP-1 and FRAP 120 values ranged from 390 to 760, and 100 to 280μmoles Fe2+/g d.w for apples and berries, respectively. These FRAP-1 values may be related to the presence of very efficient antioxidants such as ascorbic acid, quercetin and catechin (18,20,40). When we applied incubation periods longer than 4 min, FRAP values differed significantly (p<0.05), revealing that the evaluation at short times (1 to 15 min) underestimates the total antioxidant capacity that may be assessed at 120 min. Therefore, it is of major importance to standardize and apply the adequate time of reaction to compare the total antioxidant capacity of fruits and vegetables. If this is not taken into consideration, underestimations of the real antioxidant capacity will occur.
When the reactions are not allowed to reach the equilibrium, FRAP may be underestimated, among other reasons, due to the generation of new antioxidants through polymerization of phenolics that contribute to the total antioxidant capacity (20). Due to the complex mixture of antioxidant compounds present in fruits and vegetables, it is important to allow periods long enough to reach the equilibrium when comparing their total antioxidant capacity. In effect, after 60 min, the FRAP reaction kinetics of gallic acid after 1 and 4 min increased significantly (1.4 and 1.3 times at 1 and 4 min, respectively) since the reduction of the ferric-TPTZ complex was uninterrupted (data not shown). Pulido et al. (18) reported similar results, determining that the antioxidant capacity duplicated after 30 min, while the blank samples showed no modification of the absorbance during this time of incubation, confirming that the increments in the absorbance values were not caused by alterations of the reaction mixture with time. The fact that all assayed samples (apples and berries extracts, gallic acid solution) increased their reducing capacity with the incubation time probably reflects the ability of the antioxidant species to remain active. In food systems this process would offer protection over an extended period and therefore, aid in the prevention of early oxidative deterioration (41). On the other hand, if these molecules maintain an adequate antioxidant status in vivo, they would be able to protect the tissues from the oxidative damage caused by free radicals.
The time dependence of FRAP may be associated to different rates of Fe3+-TPTZ – phenols reaction, due to the presence of phenolics with different reactivity (antioxidant molecules with fast, medium and slow reactivity) that would interact independently, and/or the presence of metabolites that are highly reactive towards the Fe3+-TPTZ complex. Independently of the reasons underlying the time-dependence of FRAP, the values obtained at 4 min of incubation does not show the “total” antioxidant capacity of the samples. This is supported since FRAP-30 and FRAP-120 indexes of apple peel correlated significantly and strongly with the total phenolics content. Therefore, in order to establish a relative ranking of the antioxidant capacity of different samples, it would be necessary to know the kinetic profiles of the Fe2+-TPTZ formation. In addition, the weak correlations observed between FRAP-1 and FRAP-4 and total phenolics of apple peel would indicate that these compounds possess different reactivity. Our results demonstrate that not all antioxidants are able to reduce the Fe+3-TPTZ rapidly enough to complete the reaction in a short time. For this reason, when we increased the time of incubation of these samples with the FRAP reagent, the correlations increased significantly (FRAP-30 and FRAP-120), indicating that these extracts contain a complex mixture of phenolics exhibiting lower reactivity, thus requiring longer time to reduce the Fe+3-TPTZ into the ferrous form. Similar results were obtained in berries. The low correlations observed indicate that compounds other than phenolics, such as vitamin antioxidants, and/or synergism among these compounds and phenolics are contributing to the antioxidant capacity of the samples (18,41).
The FRAP assay should consider periods of incubation long enough to allow the reaction of all the different antioxidants contained in the extracts. Otherwise, the total antioxidant capacity is underestimated. Figure 5 shows that the FRAP-4 value of Pink Lady apple pulp was higher than that the blackberry value, while the opposite is seen in the FRAP-120 index, where the value measured in blackberry is 1.4 times higher than apple pulp. Therefore, extreme care must be taken when conclusions are obtained from FRAP results estimated at a single time of Fe3+-TPTZ – sample reaction.
FRAP values of apple and berry extracts are strongly dependent upon the incubation time. Therefore, the FRAP index evaluated at 4 min (standard method) does not necessarily reflect the “total antioxidant capacity” of these samples. This implies that the determination of the total antioxidant capacity of these fruit extracts, evaluated through the FRAP assay, requires longer periods of incubation. In effect, the FRAP values obtained at different incubation times (so-called FRAP-1, FRAP-4, FRAP-30 and FRAP-120, according to the incubation time used) for different samples produce contradictory results. In consequence, a kinetic FRAP profile should be realized for each type of sample analyzed in order to establish the most suitable incubation period to titrate all the reactive antioxidant species.
The authors wish to acknowledge CONICYT (Comisión Nacional de Investigación Científica y Tecnológica, Chile) for doctorate scholarship to C. Henríquez.
Recibido: 06-01-2011
Aceptado: 08-06-2011