
In Mexico, about one third of school-age population is overweight or obese and the diet is one of the main determinants. The purpose of this study was to identify the dietary patterns of Mexican school-age children and to determine their association with the risk of overweight/obesity. This study included 8252 school-age children who participated in the 2006 National Health and Nutrition Survey (ENSANUT-2006). Dietary data were collected using a 7-day Food Frequency Questionnaire (FFQ). Foods were classified into 25 groups and dietary patterns were defined by cluster analysis. Body Mass Index and prevalence of overweight/obesity were calculated. Logistic regression models were used to evaluate the association between dietary patterns and overweight/obesity. Five dietary patterns were identified: Rural dietary pattern (high intake of tortilla and legumes), sweet cereal and corn dishes pattern (high intake of sugary cereals, tortilla, and maize products); diverse pattern (intake of several food groups); western pattern (high intake of sweetened beverages, fried snacks, industrial snack cakes, and sugary cereals), and whole milk and sweet pattern (high intake of whole milk and sweets). We found that children with sweet cereal and corn dishes and western dietary patterns showed an association with overweight and obesity (prevalence ratio 1.29 and 1.35, respectively, using as reference the rural dietary pattern).
Patterns characterized by high intakes of sugary cereals, sweetened beverages, industrial snack, cakes, whole milk, and sweets were associated with a higher risk of overweight/obesity among in Mexican school-age children.
Key words: Child obesity, dietary patterns, Mexico.
En México la prevalencia de sobrepeso y obesidad es alta en niños escolares, y la dieta es uno de sus principales determinantes. El objetivo de este estudio fue identificar los patrones dietéticos en población escolar mexicana y determinar su asociación con sobrepeso y obesidad. Este estudio incluyó 8252 niños (ambos sexos) de 5 a 11 años de edad de la Encuesta Nacional de Salud y Nutrición 2006 (ENSANUT-2006). Se recolectó información dietética utilizando un cuestionario de frecuencia de consumo de 7días. Los alimentos se clasificaron en 25 grupos y por análisis de conglomerados se obtuvieron patrones dietéticos. Se calculó el índice de masa corporal (IMC) y la prevalencia de sobrepeso y obesidad. Se evaluó la asociación entre los patrones dietéticos y el sobrepeso y obesidad. Se identificaron 5 patrones dietéticos: Patrón rural (caracterizado por tortilla y leguminosas); patrón de cereales dulces y preparaciones con maíz; patrón diverso (con la mayor cantidad de verduras, frutas y carne en relación a los demás patrones, y alto en bebidas azucaradas); patrón occidental (caracterizado por bebidas endulzadas, frituras, pastelillos y cereales dulces) y patrón de leche entera y dulces). Se encontró que los niños con patrones dietéticos de cereales dulces y preparaciones con maíz y el patrón occidental se asociaron con sobrepeso y obesidad (Razón de prevalencias 1.29 y 1.35, respectivamente, usando como referencia el patrón rural). Patrones caracterizados por alto consumo cereales dulces, bebidas azucaradas, frituras, pastelillos, leche entera y dulces, se asociaron con sobrepeso y obesidad en niños escolares mexicanos.
Palabras clave: Obesidad infantil, patrones dietéticos, México.
Centro de Investigación en Nutrición y Salud, Instituto Nacional de Salud Pública.
Cuernavaca, Morelos, México.
Over the past decades, several countries have experienced a significant increase in obesity prevalence (1, 2). Around 17.6 million children worldwide are overweight (3). In Mexico, between 1999 and 2006, there was a dramatic increase in the prevalence of obesity in the entire population, particularly in school-age children. The prevalence of obesity among school-age children increased 6.5 and 3.3 percentage points in boys and girls, respectively, such that almost one third of that age group is overweight or obese (4).
Obesity in children is associated with non-communicable chronic diseases (diabetes, glucose intolerance, hypertension, high lipid concentration) (5,6), depression (7) and discrimination (8).
Risk factors associated with obesity are multiple and complex; among them are psychosocial issues, sedentary lifestyles as well as availability of energy-rich foods (9) and intake of sweetened drinks (10). Currently, efforts carried out in countries like the United States aimed at decreasing obesity focus on promoting physical activity (11) and healthy dietary pa.3.213tterns (12,13), given that those behaviors are modifiable (14,15).
One approach to evaluate the relationship between diet and risk for chronic diseases has been to analyze individually nutrients and foods. This approach, however, often ignore the potential interactions between dietary components and risk for choric diseases (16). A more useful approach to examine diet and chronic disease is dietary pattern analysis, where foods are combined into one or more composite variables (16,17).
Currently, few studies have studied the association between dietary patterns and obesity in children (18). Dietary patterns characterized by high intake of sweets and fried snacks, together with low physical activity, were positively associated to overweight; conversely, a dietary pattern characterized by a wide variety of foods and increased physical activity was negatively associated to overweight in preschool and school-age French children (19).
To our knowledge, there are no studies that evaluate the association of different dietary patterns with overweight or obesity in Mexican school-age children. Therefore, the aim of this study was to identify the dietary patterns of Mexican school-age children and to determine their association with being overweight or obese.
Study design: We analyzed data from the 2006 National Health and Nutrition Survey (ENSANUT-2006, its abbreviation in Spanish), a probabilistic, cross-sectional, stratified cluster sample study representative of the national, regional, and state levels, and of urban and rural areas. A detailed description of sampling procedures was published by Olaiz et al (20).
Study population: Subjects included a subsample of children 5 to 11 years of age (54.6% of the national sample), boys and girls, from whom detailed information of diet and anthropometry were available.
Ethics: Written informed consent was given by the mother or guardian of the child before participation in the survey. The protocol of ENSANUT-2006 was approved by the Ethics, Research, and Biosecurity commissions of the National Institute of Public Health (INSP, per its abbreviation in Spanish). Confidentiality was guaranteed by giving an identification number to each participant in the study.
Data collection: Dietary information was obtained through a 7-d Food Frequency Questionnaire (FFQ). The questionnaire was previously validated in another study (21). Also, this FFQ was tested in a pilot study to evaluate its application and to correct coding errors. The questionnaire included a list of 102 food items, and it was administered by field workers trained and standardized in data collection (22). The field workers asked for the days of the week, times of the day, portion sizes and total of portions consumed for each items. A conversion of food quantity to energy and nutrients was made using a table of food nutrition value compiled by the INSP (23). Details on dietary data processing (data collection, building of database, cleaning and handling of data) are described elsewhere (24). Food items were classified into 25 food groups according to characteristics of the food (type, macronutrient and dietary fiber content). Some food items, like soft drinks and eggs, made up their own group. The classification of food groups is presented in table 1. Percentage of energy contributed by each food group to total energy intake by day for each individual was obtained as shown in the following equation.
% of energy by food group =
Energy percentages derived from each food group were transformed to Z-scores in order to conduct the cluster analysis. To obtain the Z score variable, we used the sample mean.
Analysis of dietary patterns: A cluster analysis was performed to derive dietary patterns (by the k means method). This analysis avoids correlation problems of the dietary variables (25-27). Subjects were classified into non-overlapped groups. Two to six solutions were tested which maximized the Euclidian distance between clusters, and finally, the solution of five clusters was chosen, as they better characterized dietary intake according to energy contribution of each food group.
Intake of energy, carbohydrates, protein, fats, saturated fat, fiber and cholesterol was analyzed by cluster or dietary pattern because it has documented that these dietary components are related with overweight risk (18, 28).
Anthropometry: Weight and height of the children who participated in the survey were measured by a trained and standardized field team (29). Height was measured with a stadiometer (Dynatop, Mexico City, Mexico) with measure capacity of up to 2 m and 1-mm precision. Weight was obtained using an electronic scale (Tanita, Tokio, Japan) with 100-g accuracy. Body Mass Index (BMI, kg/m2) was calculated to identify school-age children with overweight or obesity, and the classification was made according to criteria proposed by the International Obesity Task Force (IOTF) (30).
Areas: Urban areas were considered as those with 2500 inhabitants, and rural areas those with <2500 inhabitants. A detailed description has been reported (20).
Dietary data from 9383 children were available. Of them, 667 were excluded from the analysis, as they were 5 standard deviations (SD) away from the sample mean of consumption and adequacy percentage (data not plausible overall energy and macronutrient distribution) (31,24). Although some researchers recommend not taking into account dietary observations >3 SD, in this analysis, observations between 3 to 5 standard deviations were taken into account because their values were plausible (24). Also, 77 observations were eliminated because they included non-plausible information on specific food items; therefore, the sample consisted of 8639 children with available dietary data. When the database was checked to detect observations with either missing weight and height values or implausible values (BMI values <10 or >38) (32), 387 observations were excluded. The final sample comprised 8252 children with plausible dietary and anthropometric data.
Statistical methods: Statistical analysis started with descriptive statistics and simple tabulation for categorical variables. Percentage of energy derived from each food group was assessed. Energy and nutrients by each dietary pattern were calculated as well, as median and interquartile range (p25, p75). Linear regression models were used to analyze mean differences between dietary patterns and contribution to energy and nutrients. We used logistic regression models to analyze the association of dietary patterns and prevalence of overweight and obesity, with and without adjustment for age and geographic region. Taking into account the odds ration data, we calculated the prevalence ratio, which is more appropriate for cross-sectional studies, as the odds ratio is not suitable for events where prevalence is above 10% (33). Differences were considered statistically significant at p<0.01 because of the Bonferroni adjustment, which takes into account the number of simultaneous comparisons performed. The p value considered for including variables in the logistic regression models was p<0.05.
Analysis were performed using Stata SVY (Stata Statistical Software, Release 9.2, Stata Corporation, College Station, Texas, USA, 2006), so that the expansion factor and the survey design effect could be adjusted. Because we excluded records without data on diet and anthropometry, it was necessary to recalculate the expansion factors to ensure that our sample was representative of the national level data.
Table 2 shows overall characteristics of school-age children by dietary pattern. The average of age was 8.21±1.9 years. Approximately the half of the population was male and more than 70% of children lived in urban areas and 25.5% of children were overweight or obese.
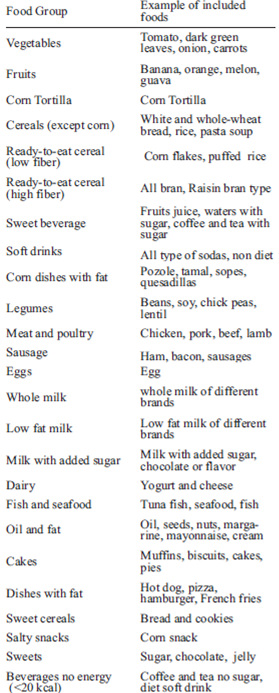
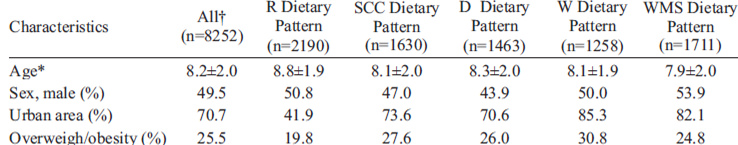
Table 3 presents the identified dietary patterns and the contribution (median and percentiles 25 and 75) of energy percentage for each food group by dietary pattern. We identified five dietary patterns: Rural (R) dietary pattern, which was characterized by the highest corn tortilla and legume intakes, and a low intake of sweets and some cereals like white bread, whole-wheat bread, rice, and noodles. Sweet cereal and corn dishes (SCC) pattern, which was characterized by the highest intake of sweet cereals, corn dishes and low fat milk, as well as an important intake of sweets, cereals in general, and dairy products. Overall, this pattern was characterized by sweet foods. The diverse (D) pattern presented the highest intake of the sweetened beverages, meat and poultry, dairy products, vegetables and fruits compared with the other patterns. Also, this pattern had an important contribution from corn tortillas. Western (W) pattern showed the highest consumption of cereal in general, soft drinks, cakes, dishes with fat, and salty snacks. This pattern had the lowest intake of corn tortilla, compared with the other patterns. Whole milk and sweet (WMS) pattern included the highest intake of whole milk and sweet groups, and a lower proportion of corn tortilla, cereals, sweetened beverages, and low-fiber cereals. With respect to dietary pattern distribution, a higher percentage of children had a WMS pattern (24.5%) and R pattern (21.3%), (Data adjusted by survey design, and not shown in table).
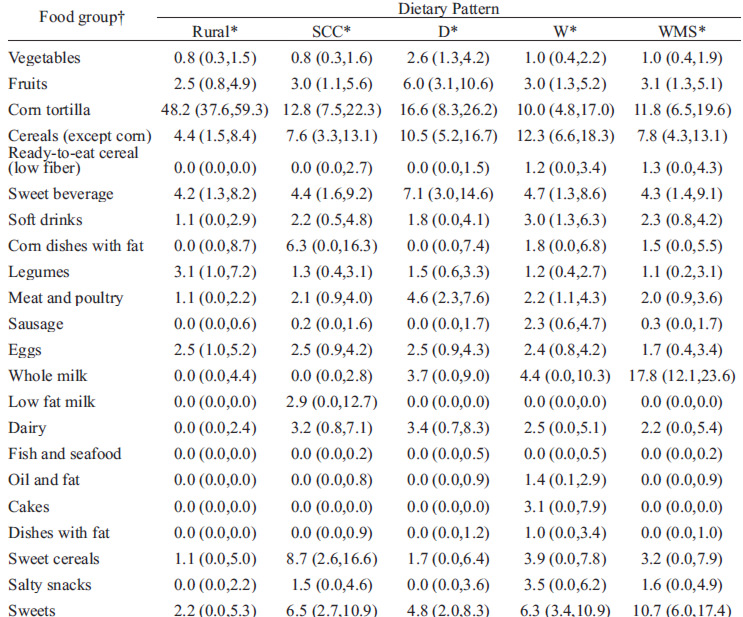
Table 4 describes the characteristics of energy, macronutrient, dietary fiber, and cholesterol consumption in school-age children by dietary pattern. Children with WMS pattern had the highest intake of energy (1626 kcal, compared with R dietary pattern; p<0.01), and the highest protein intake (48.4 g; compared with R and D dietary patterns, p<0.01). R dietary pattern had the highest fiber intake (18.2 g) and the lowest total fat intake (28.9 g), compared with other patterns. The lowest fiber consumption was noted in WMS dietary pattern (12.5 g).
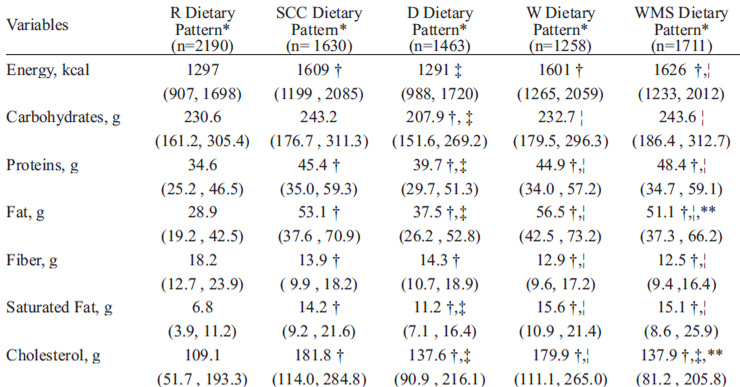
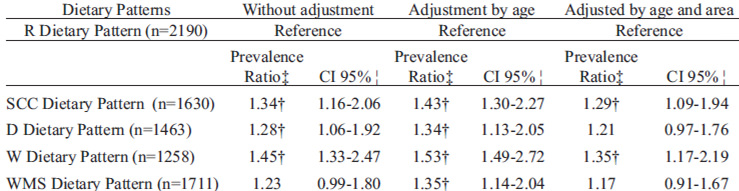
Table 5 presents the results of the regression models for the association of dietary patterns with overweight and obesity without adjusting for other variables; adjusting only for age, and adjusting both for age and area, using R dietary pattern reference. We found that in the three models the children with SCC, D, W and WMS dietary patterns were associated with being overweight or obese than those with R dietary pattern. In the age and area-adjusted model, children with SCC and W dietary pattern had a prevalence ratio of being overweight and obesity of 1.29 and 1.35, respectively, compared to the reference R dietary pattern.
This study identified, by cluster analysis, five dietary patterns in school-age children who participated in the ENSANUT-2006, which was representative of more than 15 million Mexican children aged 5 to 11 years.
We analyzed the association of five dietary patterns with overweight and obesity. In comparison with the R dietary pattern, the other dietary patterns showed an increase in the prevalence ratio for overweight and obesity. We found that SCC and W dietary patterns, characterized by a higher consumption of sweetened drinks, fried food and salty snacks, and cakes, had the highest fat intake (saturated fat and cholesterol) and the highest associations with overweight and obesity.
Children with R dietary pattern had the highest dietary fiber intake, the lowest cholesterol and fat consumption, and the lowest prevalence of overweight and obesity (19.8%). However, no dietary pattern could be labeled as healthy, since the energy contribution of fruits and vegetables was low in all patterns. Also, fiber intake was lower (between 11.5 and 18.9 g) than 25 to 31 g that is recommended for this age group (34). In addition, all patterns exhibited an important contribution to the energy intake from corn tortillas (3 patterns as their greatest contribution of energy and the other 2 patterns as the second greatest contributions), sweet cereals and beverages and sweets.
The dietary patterns defined in this study were similar to those described in previous studies in children and adolescents. For instance, SCC and WMS dietary patterns, which included sugar-rich foods, is similar to the “Snack” pattern (characterized by higher consumption of bakery products like buns, cakes and biscuits) identified in Spanish children by Aranceta and others (35). Ritchie and others (36) in their study examined black and white girls recruited at 9-10 y of age from the United States, and found dietary patterns characterized by high consumption of sweetened drinks, sweets, and fried food. Those patterns were similar to the ones identified in our study.
Similar to the present analysis, other studies have found dietary patterns with high intake of corn snacks, cakes, sweet cereals, and sweetened beverages associated with being overweight and obese children. A study in school children in Colombia found that a snacking dietary pattern was associated with overweight and obesity (37). A study conducted in French children reported that physical inactivity and a dietary pattern characterized by high intake of fried snacks was associated with a high prevalence of overweight and obesity (19). Other studies carried out in school-age children found that those patterns characterized by energy dense foods, which are low in fiber and high in fats, were associated with larger amounts of fat mass and adiposity (18, 38).
There are some limitations to this study that should be considered when interpreting the results. Because of the cross-sectional and observational nature of the study, causality between overweight and obesity and dietary patterns cannot be determined. Also, pattern analysis is an empiric technique, so cluster selection is subjective. Nevertheless, this is a technique broadly used by other researchers as a valuable tool for the analysis of the relation between diet and disease (16,17). We did not obtain information on physical activity, so we do not know how inclusion of physical activity would have changed the results.
Despite excluding subjects without anthropometric data (5% of the sample), we found no statistically significant differences in characteristics like sex, age, and area between subjects included and those not included in the analysis, so we do not believe that this is a potential source of bias. Although 24-hour food recalls and diet records are preferred for this type of study, because of repeated measures (39), the questionnaire employed in ENSANUT-2006 provided information on different portion sizes, specific for the age group under study, which were used to quantify gram weight of individual food items. In addition, by recording the frequency of consumption we are able to know variations between meal times, so we have more accurate information on the habitual diet of a study population (40). Moreover, the FFQ has an acceptable validity and reproducibility to identify dietary patterns (41).
Despite these limitations, this study makes a significant contribution to the literature in understanding how dietary patterns are associated with overweight and obesity in representative population of school age children in Mexico. Since relatively few studies have examined that association in school-age children (18,19,37,38), the results from this study are relevant for public health practitioners seeking to understand how to prevent and reduce overweight and obesity among school-age children.
In conclusion, we found that dietary patterns characterized by sugar-rich food and sweetened beverages significantly increased the risk of overweight or obesity, compared with a pattern characterized by high intakes of legumes and corn tortilla in a representative sample of school-age children. Future research should investigate the factors leading to the choice of specific dietary patterns and their relation with overall health or non-communicable chronic diseases. Furthermore, the development of culturally specific dietary interventions should be promoted to address the rapid increase of overweight and obesity in Mexican school-age children.
We would like to acknowledge the collaboration of Lisa Goldman Rosas and Eva C. Monterrosa Bazzaglia for their remarks.
Recibido: 12-04-2011
Aceptado: 26-07-2011