Introduction
Dietary intake assessment is a critical component when determining the effect of nutritional factors on several health issues, specifically on chronic diseases. Such assessment requires tools for estimating long-term nutrient intakes, as chronic diseases evolve during many years. In particular, lack of calcium intake has been positively related to osteoporosis, as well as to hypertension, cancer, obesity and kidney stones (1). In addition, it has been recently suggested that a low calcium intake (<660 mg/d) is a marker of poor overall diet quality in women (2). The ability to accurately assess current, as well as retrospective and longitudinal calcium intake at the population level, is essential for establishing the potential role of calcium in preventing and treating chronic diseases.
With respect to osteoporosis, lifelong adequate calcium intake has been proposed as crucial (3). Adequate calcium intake is referred to the levels of consumption necessary for maximizing peak bone mass during childhood and adolescence, maintaining bone mass during the adult years, and preventing bone loss in later in life (4). Since calcium is the nutrient to be most likely deficient in the diet (5), an easy, rapid and valid method for estimating calcium intake is needed.
The Food Frequency Questionnaire (FFQ) consists of a list of foods and the frequency in which these foods are consumed in a specific time frame (6). It has emerged as a tool that precisely allows the assessment of long-term nutrient intake in large number of individuals. The FFQ is usually short, easy to complete and relatively inexpensive compared to other methods, such as 24-h dietary records, dietary history, weighed-food records and food diaries. These methods may also under-represent usual intake and are inappropriate for the assessment of past diet (7), which in the case of calcium is important because current calcium intake is not a good estimator of past intake (8). FFQs have also been largely used in population studies because they are more accurate for estimating a limited number of nutrients rather than the total diet (9) and it can be develop to specifically focus on one nutrient. However, before using this tool, a FFQ must be created and validated for the population under investigation, usually against dietary records or weighed records as the independent standard (7).
There are several validated FFQ to estimate calcium intake in different populations, such as in different groups within the United States (US) (10-13) and in other countries (14-17). However, these FFQ may not be valid to estimate calcium intake in other populations, such as in Puerto Ricans. Because this method depends on a predetermined list of food items, it may be appropriately used only with the population for which it was developed or subsequently validated. At present, there is no validated calcium specific FFQ designed for the Puerto Rican population. Tucker and colleagues (18) have shown several differences in the dietary patterns of Puerto Rican adults compared to the general US population, which precludes the use of the validated calcium specific FFQs developed in the US for this group. Therefore, the present study assessed the validity and reproducibility of a short semi-quantitative calcium specific FFQ in a convenience Puerto Rican sample.
Materials and methods
Subjects
Participants included a convenience sample of students, employees and faculty of the Medical Sciences Campus of the University of Puerto Rico. Potential participants replied to study announcements posted on campus and sent by email. Inclusion criteria were 21 years of age or older and being a student, employee or faculty at this academic institution. Exclusion criteria, assessed with a screening form,were: declining to provide consent, inability to make the visits or complete a food record; major diet changes or major changes in weight over the past months, mental health conditions and health conditions that affect food selection. We aimed for a convenience sample (non-randomly selected) size of 100 individuals. The sample size was selected based on similar studies (17, 19). The power calculation resulted in 90% power to detect statistical significance between the FFQ and the dietary records with this sample size, which then was increased by 10% to allow for drop-outs.
The study was approved by University of Puerto Rico-Medical Sciences Campus use of Human Subjects Research Committee; all subjects signed a consent form before enrolling.
Design
Participation in this study consisted of three visits; during the first visit participants read and signed the consent form, completed a socio-demographic questionnaire, underwent anthropometric measurements and completed the FFQ. The second visit was performed 30 days later; in this visit participants repeated the FFQ and received detail instructions on how to complete the 6-day diet records (DR) at home. The last visit was a week later, in which participants handed in their completed diet records. Diet records were carefully reviewed for completeness and precision of the information. Half of the participants finalized the study during the January-Mayacademic semester and the other half during the August-December academic semester. All subjects completed a socio-demographic questionnaire at the first visit, which included: age (in years), gender and level of education (years of education).
Anthropometric measurements
Height of participants was obtained using a portable stadiometer (Chorder HM200P Portstandstadiometer, Taiwan) and recorded in centimeters (cm). Weight (kg) and percent body fat were obtained using a bio-electrical impedance scale (BF-350 TANITA Body Composition Analyzer, Illinois, US), while wearing light clothes and no shoes. Participants were asked to avoid the following: alcohol use 48 hours before the test, intense exercise 12 hours before the test, eating or drinking (especially caffeinated products) 2 hours before the test and, when possible, to avoid the use of diuretics for 7 days before the test. Participants were also asked to empty their bladder 30 minutes before the test. BMI was calculated as weight in kilograms divided by the square of height in metres (kg/m2), and the following categories were used: underweight (<18.5 kg/m2), normal weight (18.5–24.9 kg/m2), overweight (25.0–29.9 kg/m2), and obese (≥30.0 kg/m2)(20). Subjects were classified by % body fat as high risk (>39% if 20-39 y, >40% if 40-59 y and >42% if 60-79 in women; and >25% if 20-39 y, >27% if 40-59 y and >30% if 60-79 y in men) or low risk (if below these percentages) (21).
Semi-quantitative FFQ for estimating calcium intake
We developed a semi-quantitative FFQ for estimating calcium intake on the basis of past research(22). Foods were selected based on examination of 3 24-h dietary records completed by Puerto Rican subjects from a previous study; from these, we identified the most commonly consumed foods that are important sources of calcium (22). We also included other typical Puerto Rican foods rich in calcium. The FFQ was composed of 22 items and was divided into 3 sections. The first section asked the frequency of milk, hard cheese, soft cheese, yogurt, calcium-rich vegetables, fortified juice, grains and ready to eat breakfast cereals. In addition, each category provided an open-ended question regarding the type or brand of such products consumed. The second part provided a list of 16 food preparations rich in calcium commonly consumed by Puerto Ricans, such as pizza, pasta dishes with cheese, oatmeal, cheeseburger, Mexican dishes with cheese and dairy based desserts. The third part asked the frequency of the use of vitamin and mineral supplements, herbs, tea and other supplemental foods, providing open-ended questions regarding the brand and amount of the supplements consumed. Each food item included a fixed commonly used portion size in Puerto Ricans (22). The frequency of each item was assessed for the past month, and included 8 frequency responses: daily (1 to 3 or more times), weekly (2 to 6 times), monthly (1- 3 times) or never, based on the indicated standard portion. The FFQ was interview-administered with the help of 3-D Life-Form Food Models replicas (Nasco, CA) for estimating portion sizes of the items included in the FFQ. The calcium content for each item was derived using the USDA National Nutrient Database for Standard Reference (23). If there were several versions of the same item, an average for the calcium content was calculated.
We assessed the validity of the instrument in a pilot sample of 18 obese Puerto Rican adults that participated in a clinical study at the Medical Sciences Campus of the University of Puerto Rico (results not published). Preliminary results showed that average calcium intake for the food records was 545±179 mg/d and from the FFQ was 458±233 mg/d, with a Pearson correlation of 0.52 (p=0.029). Based on those results, the FFQ was further improved.
Diet records
A 6-day diet records was chosen based on the average days needed to assess calcium intake in adults (24) and therefore included weekday and weekend days. The diet records were divided in breakfast, morning snack, lunch, afternoon snack, dinner, night snack, with the times of consumption for each meal. In addition, the following columns were included: place of consumption, foods and beverages, quantity and preparation. Participants received detailed instructions on how to report the amounts of food and beverages consumed during the day. We also instructed the participants to record brands, quantity, cooking methods, ingredients used, any seasoning, gravy, dressing, sauces, butter and sugar added in the preparation of the foods consumed, with their respective amounts consumed. Lastly, we instructed participants on how to record foods eaten at restaurants. Participants received written instructions, a sample of a completed diet record, a ruler and the 6-day diet record forms to take home. The participants also received a portion size booklet with black and white drawings of actual serving portions, including images of spoons, bowls and cups and serving sizes of commonly eaten foods. These models aided participants to avoid over or underestimation of the portion sizes.
Statistical Methods
The normality of the data was assessed by the Shapiro-Wilk test (25). Calcium intake was not normally distributed; therefore, square root transformations were performed. Descriptive statistics included means, standard deviations and percentages. Calcium intake from both methods was compared between students, faculty and employees by Analysis of Variance. Reproducibility was assessed comparing mean dietary calcium intake using the paired t-test and by Pearson correlation between the first and second administration of the FFQ. These tests were done overall and by semester (January-May and August-December). Several analyses were performed for validating the FFQ. Comparison of the daily mean calcium intake from the FFQ and from the 6-day diet records were done by means of Pearson’s correlation, paired t-test, Bland and Altman test, crossclassification and analysis of surrogate categories. The Bland and Altman test was used to assess agreement between the two methods (26). Cross-classification analysis assessed the percent of agreement and the ability of the FFQ to reliably and accurately classify subjects into similar quartiles of calcium intake based on the results from the FFQ and the 6-day diet records. To evaluate the discriminative power of the FFQ, actual values for surrogate categories were calculated as proposed by Willett (7). The values of specificity, sensitivity, positive and negative predictive values were calculated using the current Dietary Reference Intake (DRI) for this age group as the cut-off point (1000 mg/d of calcium) (27). Sample size calculations were performed by Epi Info (version 7.0.5, 2009, Centers for Disease Control Prevention, Druid Hills, GA). The statistical analyses were done using the Statistical Package for the Social Sciences (version 17.0, 2008, International Business Machines, NY).
Results
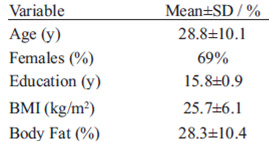
Subjects’ characteristics are presented in Table 1. A total of 108 subjects were initially recruited to participate in the study; 15 participants did not complete the 6-day diet records or the FFQ and were excluded from the analyses. Therefore, 93 participants completed all aspects of the study. Most subjects were females (69%), young adults and all participants had a bachelor degree. Mean BMI corresponded to the overweight classification (25-29.9 kg/m2) and mean body fat percentage corresponded to the high risk for being overweight classification in both females (26.6%) and males (20.7%). Most were students (84%) and only a small proportion was faculty (3%) or employees (13%). No significant differences were observed in calcium intake from any of the methods between students, faculty and employees.
TABLE 1 Characteristics of the studied sample in Puerto Rico (N=93)
Results for the reproducibility analyses are shown in Figure 1. There was no statistical difference between overall mean calcium intake calculated from the FFQs (first FFQ 846.4±356.9 mg/day and repeated FFQ 801.1±423.7 mg/day; p=0.17). The overall Pearson correlation coefficient was moderately high (0.70, p<0.001). When analyzed by semester, the FFQ also showed good reproducibility during the January-May semester (first FFQ 843.0±449.0 mg/day and repeated FFQ 834.0±466.0 mg/day; t-test p-value=0.82; r=0.84, p<0.001) and August-December semester (first FFQ 848.5±356.9 mg/day and repeated FFQ 775.1±389.9 mg/day; t-test p-value=0.16; r=0.54, p<0.001).
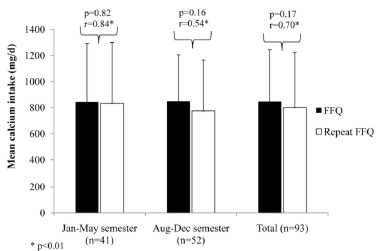
FIGURE 1 Estimated calcium intake of the sample according to both FFQ and repeated FFQ (mean and SD).
To validate the FFQ, mean calcium intake from the first FFQ was compared to the mean calcium intake from the 6-day DR (Figure 2). There was no statistical difference in the mean calcium intake between the first FFQ and the 6-day DR (845.4±377.5 mg/day; p=0.98).
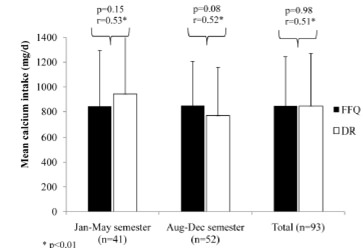
FIGURE 2 Estimated calcium intake of the sample according to FFQ and 6-day DR (mean and SD).
Similar results were found in the January-May semester between the first FFQ and the 6-day DR (943.1±445.9 mg/day; p=0.2) and August-December semester between the first FFQ and the 6-day DR (768.4±294.6 mg/day; p=0.08).
To analyze how well both methods agreed, the correlation coefficient between mean calcium intakes from both methods were calculated (Figure 3). There was a significant correlation between mean calcium intake from both methods overall (r=0.51, p<0.001), in the January-Maysemester (r=0.53, p≤0.01) and in the August-Decembersemester (r=0.52, p≤0.01). Overall, the mean difference between calcium intake from the FFQ and the diet records was 0.9 mg/d. Therefore, the two methods agree. However, when considering if the methods agree for an individual, the differences between the 6-day DR and the FFQ were plotted against the average of the two methods (Bland-Altman plot; Figure 4). The FFQ could provide estimates of calcium intake in a range of -754 to 756 mg/day, which is unacceptable to estimate an individual’s calcium intake because the range is too broad.
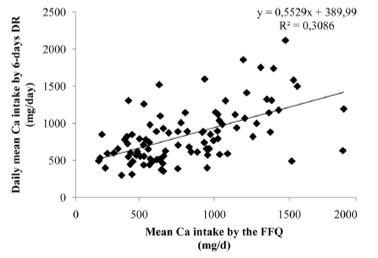
FIGURE 3 Scatter plot of mean calcium intake from the 6-day DR vs mean calcium intake from the FFQ overall.
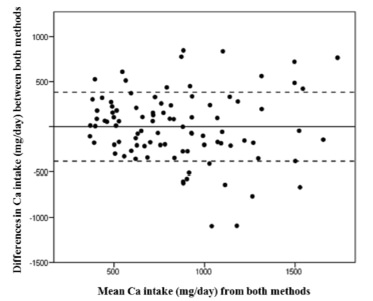
FIGURE 4 Bland-Altman plot for the differences against meanCa intakes for the 6-day DR and the FFQ.
NOTE: The cut-off points were set at 2 standard deviations (SD) (±383.29 mg/day, cut lines) of the mean (-0.93 mg/day, solid line).
Comparisons of quartiles of daily calcium intake by each method were used to assess the degree of misclassification (Table 2). Most participants (84%) were correctly classified into the same or adjacent quartile by both calcium assessment methods, while 16% were grossly misclassified (lowest quartile for one method and highest quartile for the other). Actual values of surrogate categories of FFQ quartiles are shown in Table 3. The result show an increase in mean calcium intake with increases in quartiles, with significant differences among quartiles (p<0.001). However, post hoc analysis showed that mean calcium intakes between the first (calcium intake <460 mg/d) and second (calcium intake 460-654 mg/d) quartileswere not significantly different among them. Also, no differences were observed between second (calcium intake 460-654 mg/d), third (calcium intake 655-892 mg/d) and fourth quartiles (calcium intake 893-1383 mg/d). This suggests that the FFQ has a good discriminative power at the lowest and highest quartiles, in other words, between the lowest and highest calcium intakes, but not between the calcium intakes within the middle quartiles.
TABLE 2 Cross-classification of the sample into quartiles by the mean daily calcium intake assessed by the first FFQ and the 6-day DRa
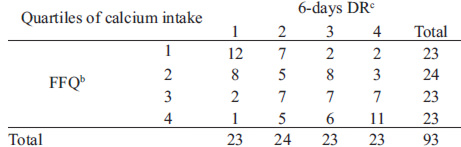
aData is shown in number of subject classified into the respective quartiles; bFFQ quartiles were: Q1: <511.66 mg/d; Q2: 511.67-776.18 mg/d; Q3: 776.19-1163.50 mg/d and Q4: >1,163.50 mg/d; cDR quartiles were Q1: <564.54 mg/d; Q2: 564.55- 779.92 mg/d; Q3: 779.93- 1,053.20 and Q4: >1,053.21 mg/d.
TABLE 3 Actual values for surrogate categories (FFQ)
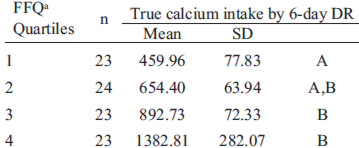
aTrue ‘mean’ values based on the 6-day DR were assigned to the categories defined by the surrogate method and compared by ANOVA p<0.0001 Bonferroni post-hoc tests, p<0.05. Quartiles not sharing the same letter are statistically significantly different from each other.
The FFQ correctly classified participants with a calcium intake less than the cut-off point (1,000 mg/day) with a specificity of 65.2%, a sensitivity of 73.5%, a positive predictive value of 86.2% and a negative predictive value of 45.4%.
Discussion
Several calcium-specific FFQs have been developed and validated to be used in children and in adults in the US (10-13). However, due to differences in Puerto Rican’s dietary patterns compared to the general US population, we designed a questionnaire culturally sensitive with respect to food intake patterns of this population. Some of these differences include the consumption of larger portions of certain fruits and fruit juices, rice, beans, beef, pork, chicken, bread, and sweet baked goods but smaller portions of some vegetables, coffee, and milk in Puerto Ricans (18).
Comparisons among studies can be difficult due to differences in sample size, age, sex, racial composition, educational background, design of the FFQ (for example the number of food items, the amount of open and closed questions and the length of reference period of the recall) and the method used as the gold standard (12). Nonetheless, results of our study can be comparable with a few studies.
Our study showed that there was no statistically significant difference in the overall daily mean calcium intake obtained from the 6-day diet records and the FFQ (p>0.05). An overall modest correlation coefficient was obtained between methods (r=0.51; p<0.001). Therefore, both methods apparently agreed since correlation coefficients obtained in our study are similar to the typical ranges in the coefficients (0.5 to 0.7) found in other validation studies (7). This range is usually affected by the sample size and certain design features and instructions associated with the instrument (6). Our study showed that there was no statistically significant difference in the overall daily mean calcium intake obtained from the 6-day diet records and the FFQ (p>0.05) or when analyzed by semester (p>0.05). Another study also found little variation in calcium intake due to season (10).
Although no difference was observed in our study between the two methods (0.9 mg/day), the Bland-Altman plot showed that the FFQ could provide estimates of intake in a range of 1,510 mg/day, which is not considered acceptable for quantitative assessment of individuals’ actual nutrient intake (16). This is not of our concern since FFQs are not an appropriate method to assess individuals’ actual calcium intake (28), nor this was the purpose of this FFQ. Although the FFQ developed is not valid for assessing an individual’s calcium intake, it is useful in ranking individuals into categories of intake correctly in the clinical setting. This was evidenced by the good agreement between methods in the cross-classification analysis according to quartiles of intake, with only a low proportion of subjects grossly misclassified (16%). This is comparable to the results in another study (15), in which their calcium-specific FFQ correctly classified 82.1% of the participants into the same or adjacent quartiles.
The FFQ could identify subjects with actual daily calcium intakes less than 1000 mg/d with a 73.5% sensitivity, which means that 73.5% who really had low calcium intake were correctly classified by the FFQ.
With respect to specificity, 65.2% who really had high calcium intake were correctly classified by the FFQ. The predictive value of our FFQ was high, since 86.2% of the subjects were identified as having an intake below 1000 mg/d from the FFQ whom also had actual intakes below this level. These results are similar to others studies (29, 30). However, when using the surrogate categories, the FFQ had good discriminative power in identifying subjects at high intakes but it cannot differentiate between the first 2 quartiles and the middle quartiles, which is comparable to other studies (16,17), but less efficient compared to other FFQs for the estimation of calcium intake (29).
Finally, the FFQ developed in this study had good reproducibility when tested 1 month apart. The correlation coefficient showed good overall agreement (0.70, p<0.001). Our results are in accordance to other reproducibility studies, in which coefficient correlations ranged from 0.75 to 0.93 when validating calcium specific FFQs (14,15).
There are some limitations to be considered in the present study. We used a convenience sample of healthy adults in the present study, which was not randomly selected. Most were women and there could be a biased towards a higher educated group, which may not be representative of the Puerto Rican population. The dietary record is considered the gold standard for dietary assessment, but it may have presented a burden to the participants, since it included 6 days of intake. These records required many details and discipline to accurately complete them. Although participants were given booklets with portion sizes of different foods and were taught how to record these, some misreporting of portions may have occurred. Recall bias was another source of error when completing the FFQ but this error was minimized by reviewing the FFQ after completion with the participant. Some participants had trouble estimating the amount of food or the frequency of intake of some items based on the portion size that was presented to them. Two trained interviewers where available to help the participants. This method guaranteed wholesomeness of the data collected since the investigators were available to answer any question the participants could have in regards to portion sizes, such as the nature of foods or the type of food. This study has also several strengths. The FFQ was validated against a 6-day dietary record, rather than a one time 24-hours diet recall. As mentioned before, several days of diet records are more accurate in providing information on usual intake in comparison with the 24-hours diet recall. Therefore, better calcium estimates were calculated for validation purposes. We collected the data during two different time points, which allowed for seasonal dietary changes to occur and to be recorded in the study. Our results showed good reproducibility and validity during both time points.
In conclusion, this short calcium-specific semiquantitative FFQ is a valid and reproducible method that offers dietary calcium estimates for the studied sample. It could be used in the assessment of calcium intake in other similar groups.
Acknowledgements
This project was supported in part by grants from the National Center for Research Resources (2G12-RR003051) and the National Institute on Minority Health and Health Disparities (8G12-MD007600) from the National Institutes of Health.
References
- Heaney RP. Calcium intake and disease prevention. Arq Bras Endocrinol Metabol. 2006; 50:685-93.
- Rafferty KA, Barger Heaney J, Lappe JM. Dietary calcium intake is a marker for total diet quality in adolescent girls and women across the life cycle. Nutrition Today. 2011; 46:244-51.
- Heaney RP. The importance of calcium intake for lifelong skeletal health. Calcif Tissue Int. 2002; 70:70-3.
- NIH Consensus Statement. Optimal Calcium Intake Optimal Calcium Intake. 1994; 12(4):1-31.
- Weaver CM. The growing years and prevention of osteoporosis in later life. Proc Nutr Soc. 2000; 59:303-6.
- Gibson RS. Principles of Nutritional Assessment. Oxford University Press, Second Edition. United States, 2005.
- Willett WC. Nutritional Epidemiology. Oxford University Press, USA, 2. New York, 1998.
- Heaney RP, Davies KM, Recker RR, Packard PT. Long-term consistency of nutrient intakes in humans. J Nutr. 1990; 120:869-75.
- Haraldsdottir J & Van Staberen WA. Methods for data collection at an individual level; Food frequency. In: Cameron,M.E.; Van Staberen,W.A. Manual on Methodology for Food Consumption Studies (Oxford Medical Publications). 1988; 284.
- Musgrave KO, Giambalvo L, Leclerc HL, Cook RA, Rosen CJ. Validation of a quantitative food frequency questionnaire for rapid assessment of dietary calcium intake. J Am Diet Assoc. 1989; 89:1484-8.
- Sebring NG, Denkinger BI, Menzie CM, Yanoff LB, Parikh SJ, Yanovski JA. Validation of three food frequency questionnaires to assess dietary calcium intake in adults. J Am Diet Assoc. 2007; 107:752-9.
- Osowski JM, Beare T, Specker B. Validation of a food frequency questionnaire for assessment of calcium and bone-related nutrient intake in rural populations. J Am Diet Assoc. 2007; 107:1349-55.
- Cummings SR, Block G, McHenry K, Baron RB. Evaluation of two food frequency methods of measuring dietary calcium intake. Am J Epidemiol. 1987; 126:796-802.
- Xu L, Porteous JE, Phillips MR, Zheng S. Development and validation of a calcium intake questionnaire for postmenopausal women in China. Ann Epidemiol. 2000; 10:169-75.
- Khan NC, Mai le B, Hien VT, Lam NT, Hoa VQ, Phuong TM et al. Development and validation of food frequency questionnaire to assess calcium intake in postmenopausal Vietnamese women. J Nutr Sci Vitaminol (Tokyo). 2008; 54:124-9.
- Magkos F, Manios Y, Babaroutsi E, Sidossis LS. Development and validation of a food frequency questionnaire for assessing dietary calcium intake in the general population. Osteoporos Int. 2006; 17:304-12.
- Wilson P & Horwath C. Validation of a short food frequency questionnaire for assessment of dietary calcium intake in women. Eur J Clin Nutr. 1996; 50:220-8.
- Tucker KL, Bianchi LA, Maras J, Bermudez OI. Adaptation of a food frequency questionnaire to assess diets of Puerto Rican and non-Hispanic adults. Am J Epidemiol. 1998; 148:507-18.
- Sebring NG, Denkinger BI, Menzie CM, Yanoff LB, Parikh SJ, Yanovski JA. Validation of three food frequency questionnaires to assess dietary calcium intake in adults. J Am Diet Assoc. 2007; 107:752-9.
- World Health Organization (WHO). Obesity: preventing and managing the global epidemic. 2000; Technical Report Series, No 894.
- Gallagher D, Heymsfield SB, Heo M, Jebb SA, Murgatroyd PR, Sakamoto Y. Healthy percentage body fat ranges: an approach for developing guidelines based on body mass index. 2000.
- Palacios C, Bertran JJ, Rios RE, Soltero S. No effects of low and high consumption of dairy products and calcium supplements on body composition and serum lipids in Puerto Rican obese adults. Nutrition. 2010; in press.
- U.S. Department of Agriculture, Agricultural Research Service. USDA National Nutrient Database for Standard Reference. 2011; Release 24.
- Nelson M, Black AE, Morris JA, Cole TJ. Betweenand within-subject variation in nutrient intake from infancy to old age: estimating the number of days required to rank dietary intakes with desired precision. Am J Clin Nutr. 1989; 50:155-67.
- Henderson AR. Testing experimental data for univariate normality. Clin Chim Acta. 2006; 366:112-29.
- Bland JM & Altman DG. Statistical methods for assessing agreement between two methods of clinical measurement. Lancet. 1986; 1:307-10.
- Institute of Medicine (IOM). Dietary Reference Intakes for Calcium and Vitamin D. The National Academy Press, Washington, DC, 2010.
- Taylor RW & Goulding A. Validation of a short food frequency questionnaire to assess calcium intake in children aged 3 to 6 years. Eur J Clin Nutr. 1998; 52:464-5.
- Green JH, Booth CL, Bunning RL. Assessment of a rapid method for assessing adequacy of calcium intake. Asia Pac J Clin Nutr. 2002; 11:147-50.
- Clover E, Miller M, Bannerman E, Magarey A. Relative validation of a short food frequency questionnaire to assess calcium intake in older adults. Aust N Z J Public Health. 2007; 31:450-8.