
Adequate nutrition is critical to child development and institutions such as day-care centers could potentially complement children’s diets to achieve optimal daily intakes. The aim of the study was to describe the full-day diet of children, examining and contrasting the relative contribution of home-derived versus institutional energy and nutrient sources. The present comparison should be considered in the domain of a case-study format. The diets of 33, 3-6 y old children attending low-income day-care centers serving either 3 or a single meal were examined. The home-diet was assessed by means of 3 non-consecutive 24-hr recalls. Estimated energy and nutrient intakes at the centers and at home were assessed and related to Recommended Nutrient Intakes (RNI). Nutrient densities, critical densities and main sources of nutrients were computed. We observed that in children attending the day-care center serving three meals, home-foods contributed less than half the daily energy (47.7%) and between 29.9% and 53.5% of daily nutrients. In children receiving only lunch outside the home, energy contribution from the home was 83.9% and 304 kcal lower than for children receiving 3 meals. Furthermore, between 59.0% and 94.8% of daily nutrients were provided at home. Daily energy, nutrient intakes and nutrient densities were well above the nutrient requirements for this age group, and particularly high for vitamin A. The overall dietary variety was superior in the situation of greater contribution of home fare, but overall the nutrient density and adequacy of the aggregate intakes did not differ in any important manner.
Key words: Guatemala, institutional fare, 24-hr recalls, nutrient adequacy, children
Una adecuada nutrición es crítica para el desarrollo infantil. Los centros de cuidado infantiles (CCI) podrían jugar un papel fundamental en la complementación de la ingesta de alimentos y nutrientes. El propósito de este estudio fue describir la dieta de niños, comparando la contribución relativa de energía y nutrientes de la dieta-hogar e institucional. El presente estudio debe ser considerado como una presentación de caso. Se examinó la dieta de 33 niños de 3-6 años que asisten a dos CCI utilizados por familias de escasos recursos y con diferencias en número de comidas servidas. Se determinó la dieta-hogar utilizando 3 recordatorios de 24-horas en días no-consecutivos. Se calculó la ingesta estimada de energía y nutrientes en las instituciones y en casa y se comparó con las Ingestas Recomendadas de Nutrientes. Se determinó la densidad de nutrientes y principales fuentes. Se observó que los alimentos consumidos en el hogar contribuyeron 47.7% de la energía diaria y entre 29.9% y 53.5% de los nutrientes diarios requeridos para los niños con 3 comidas en el CCI y de 83.9%, 59.0 y 94.8%, respectivamente, para los niños que consumen únicamente el almuerzo en el CCI. La ingesta diaria de energía fue 304 kcal mayor en los niños que consumieron 3 comidas fuera del hogar. No hubo mayor variación en las dietas cuando mayor era el consumo de alimentos en el hogar, sin embargo la densidad nutricional y la adecuación de la dieta completa fue adecuada en ambos centros, y particularmente elevadas para la vitamina A.
Palabras clave: Guatemala, dieta institucional, recordatorio de 24 horas, adecuación de nutrientes, niños
Center for Studies of Sensory Impairment, Aging and Metabolism (CeSSIAM), Guatemala City, Guatemala. Department of Public Health and Community Medicine, Tufts University School of Medicine, Boston, MA. Health Sciences Institute, Vrije Universiteit, Amsterdam, The Netherlands. Dublin Institute of Technology, Ireland
Childhood is the most critical time in the human lifespan with regard to the need to assure appropriate nutrition through a nutritious and healthful diet (1,2). When it comes to the feeding of young children, they have only a modest proactive control over what they eat. Adults are generally those who do the menu planning, and adults or older children invariably do the meal preparation. Young children express their preferences for food within the family sphere, but issues of availability, affordability and family dynamics will ultimately determine how much affirmative control a young child can have on what he or she eats. Children can exercise some control and determination of their intake insofar as they can refuse and reject food offered to the degree that their adult or sibling servers permit them to exercise their will (3).
When we speak of eating in the present era, even regarding young children, we are talking of a mix of foods prepared in the home and foods prepared away from home (4). A trend throughout the entire world in recent years has been the shift from the classical pattern of home as the base for most repasts to out-ofhome sources of foods and beverages (5). This latter includes outings to restaurants or foods purchased from food vendors, but it also includes food served by institutions, educational centers, attended during the weekdays throughout much of the year. The classical example is the school lunch. Day-care centers for preschool children, however, present an interesting panorama, as children are younger and more nutritionally vulnerable, and may spend more of their day in the institution, consuming up to 2 main meals and several snacks. Nutritionally-informed selection and preparation of foods for a day-care center could guarantee adequate nutrients and provide leverage toward a healthful eating, independently of how it might be diluted by poor choices from home.
The prevalence of stunting in Guatemala is amongst the highest worldwide. According to the last national survey 49.8% of children aged 3-59 mos old are stunted (6). In specific localities, such as Totonicapán in the Western Highlands, this prevalence can reach 82.2%. In Guatemala City, stunting rates are amongst the lowest in the country at 26.3%. A high prevalence of both stunting (27%) and overweight (18%) has been reported in a sample of 583 8-10 yrs old urban schoolchildren from Quetzaltenango, with notable contrasts between social classes (7). Amongst a convenience sample of middle-class, urban children aged 6-11 yrs old in Guatemala City, the prevalence of overweight was 20.1% for boys and 15.8% for girls (8). The evidence illustrates that Guatemalan children attending day-care centers are potentially faced with the dual burden of undernutrition and overweight as the country undergoes a nutrition transition (8,9). This transition is characterized by a shift from traditional foods such as corn tortillas, to processed industrial foods such as white bread and high-sugar cereals (10). On the positive side, we previously observed that daycare centers mainly provided traditional and non-fortified plant-based foods (11), thus providing an opportunity to conserve healthy traditions. On the negative side, modern foods contributed more energy due to their high energy density (11). The controlled environment could provide an opportunity to reduce the intake of high-sugared processed foods.
We previously presented findings and comparisons of dietary and nutrient intakes from the menus of 4 diverse day-care centers serving low-income urban children in Guatemala City (12). This represented only a portion, and differential portion, of the complete daily fare. Here we complete the dietary story. We averaged the results of 3 non-consecutive days' parental recalls of foods and beverages prepared at home for consumption by their children for the available children aged 3 to 6 y in two of the four the previously studied daycare centers. One center served 3 meals (breakfast, a morning snack, and lunch) and provided a mean daily energy contribution of 925±172 kcal, whereas the other center only served lunch with an average energy contribution of 233±59 kcal (12). We present here the description of the diet of children, examining and contrasting the relative contribution of home-derived versus institutional sources and the resultant overall dietary situation. We view this as a case-study approach to documenting the constraints and possibilities for preschool children to achieve adequate diets when consuming their daily fare partly from public institutions and partly from private homes.
In this study, 2 non-profit, low-income child-care centers from underprivileged zones of Guatemala City were recruited. A day-care center was qualified as ‘lowincome’ if all children attending those day-care centers came from low-income families, defined by a monthly family income <150 US$. One day-care center selected, labeled B for its homology with the prior publication (12), was state-run and received financial support from the government, national and international originations as well as donations from parents. A total of 20 children (11 boys and 9 girls), ranging in age from 3 to 6 y, attended the center and all were invited to participate. Monthly fees were ≈4 US$ and the average daily time spent at day-care was 8.5 h. Cyclical menus were designed by specialized nutritionist and included breakfast, a morning snack and lunch. The second daycare center selected, labeled D (12), was church-run and received financial support from religious organizations. A total of 45 children (24 boys and 21 girls), ranging in age from 0 to 6 y, attended the center, of these, 20 were invited to participate at random. Monthly fees ranged from nothing to ≈12 US$ depending on the family income and the average daily time spent at day-care was 7 hr. Cyclical menus were designed by a staff member and included lunch only.
The study was approved by the Human Subjects Committee of the Center for Studies of Sensory Impairment, Aging and Metabolism (CeSSIAM), Guatemala City and the local education authorities. Only children with a signed consent form from their legal guardians were included in the study.
The data collection procedures at the day-care centers was described in detail elsewhere (12). In brief, direct recording of menus, observations of the ingredients used and the preparation of dishes and drinks were undertaken by the same group of 4 nutritionists. All ingredients were recorded separately and weighed with a kitchen scale before preparation. The total weight of each recipe was recorded and the number of portions was determined to obtain average portion sizes served. The same portion sizes were used for all children aged 3-6 y. Food waste in the kitchen and plate leftovers were recorded and taken into account.
The nature of the study was explained to the staff members. No incentives to participate were given. Each day-care center was visited 5 times. All visits were previously scheduled and not necessarily on consecutive days, but all days of the week were equally represented. Data collection took place from May to July 2008.
The nature of the study was explained to the legal guardian of the infant and an informed consent form was signed. No incentives to participate were given. A total of 3 non-consecutive 24-hr recalls were collected from the parents of the children attending the daycare centers. Household measures were used as visual aids to assess portion sizes. Probes such as time of meals, activities and questions such as “did your child have a second helping” were used. Foods and drinks prepared at home, or bought from street vendors, but consumed at the day-care centers were included in the 24-hr recalls and considered as “home” foods. All interviews took place at the day-care center at the time of child pick-up or drop-off from Tuesday to Friday; no data for weekend days was collected. Data collection took place from August to October 2008.
All food and drink items offered to the children at the day-care centers and at their homes were entered separately by day and by meal-time into an Excel spreadsheet. All ingredients and corresponding portion sizes of recipes were entered separately and a conversion factor was used to account for weight changes during cooking. Data were cleaned by checking missing values and outliers against the original data collection tool. Few outliers were found and they were included in the analysis as reported.
Estimated energy, macronutrients and 8 selected micronutrients (vitamins A, B1, B2, and B6, niacin, calcium, iron and zinc) were calculated for the foods and drinks served at the day-care center and at home, separately using the Food Composition Table for Central America and Panama (13) and the US Department of Agriculture (USDA) National Nutrient Database for Standard Reference for a few missing items (14). An ‘average’ day was compiled from the average intake of 5 observation days at each day-care center and the average intake at home based on 3 24-hr recalls.
Estimated energy and nutrient intakes were computed separately by meal-time, i.e. breakfast, morning snacks, lunch, afternoon snacks and dinner. Night snacks were not considered as a meal-time because they represented a very small proportion of the daily intakes, they were, however, included as part of the total daily intake.
Energy and protein requirements for children proposed by the Institute of Nutrition of Central America and Panama (INCAP) were used to assess nutrient adequacy of the 24-hr combined diet (15). The WHO RNI values (16) were used as the standard when evaluating nutrient intakes of selected micronutrients. Values for children aged 3 to 5 y and 11 mo were used for the entire sample. Because of the high intake of unrefined corn in the Guatemalan diet (10), iron bioavailability of 10% and a “moderate” zinc bioavailability were assumed.
Nutrient density has been advanced as a simple index to describe and compare the nutritional quality of individual food products or diets (17,18). Nutrient intake relative to the total energy contributed by that meal was assessed. The nutrient consumed at each meal was divided by the total kcal provided in the same meal. The resulting measure, the meal’s nutrient contribution expressed per kcal consumed, was then multiplied by 1000.
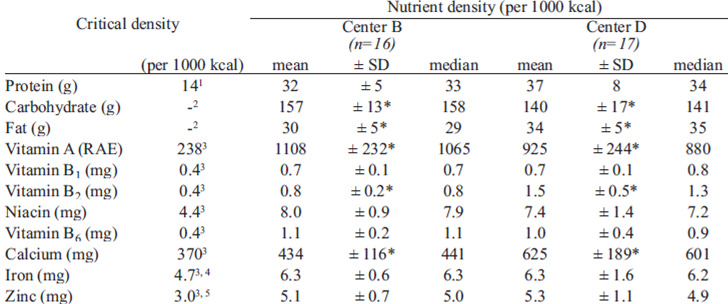
A final measure was used to compare nutrient densities against estimated nutrient intakes, using a new measure we call “critical densities”. Critical densities were defined as the estimated recommended nutrient intakes, expressed per 1000 kcal, and representing the amount of the respective nutrients that would achieve the recommended intake when an individual consumed the normative daily energy intake for his or her age and gender group. They were computed for selected micronutrients based on RNI for 4-6 y olds (16) and INCAP energy requirements for children (15).
Main source of energy, macronutrient and 8 selected micronutrients were identified by ranking all food items.
Data were analyzed with the SPSS statistical software package version 17.0 (SPSS Inc., Chicago, IL, USA). Since estimated nutrient intakes were normally distributed, independent Student t-tests were used to examine difference in nutrient intake and nutrient density of the 24-hr combined diet between the 2 day-care centers by day and by mealtime. Independent Student t-tests were used to compare the percentage contributions of nutrient derived from home between the 2 day-care centers. P-values <0.05 were considered to be statistically significant.
Participation rate was high in both day-care centers, namely 80% in center B and 85% in center D. Only 4 of 20 children in center B could not take part in the study because their parents did not have time to complete the interviews, and 3 of 20 parents in center D were not able to complete all 3 24-hr. In center D, 25 of 45 children fell outside the required 3-6 y age range. The final sample was comprised of 16 (7 girls and 9 boys) in center B and 17 (9 girls and 8 boys) in center D. The age distributions in both centers were different; the number of 3, 4, 5 and 6 yrs olds was 3, 3, 7 and 3, respectively in center B and 9, 5, 3 and 0, respectively in center D.
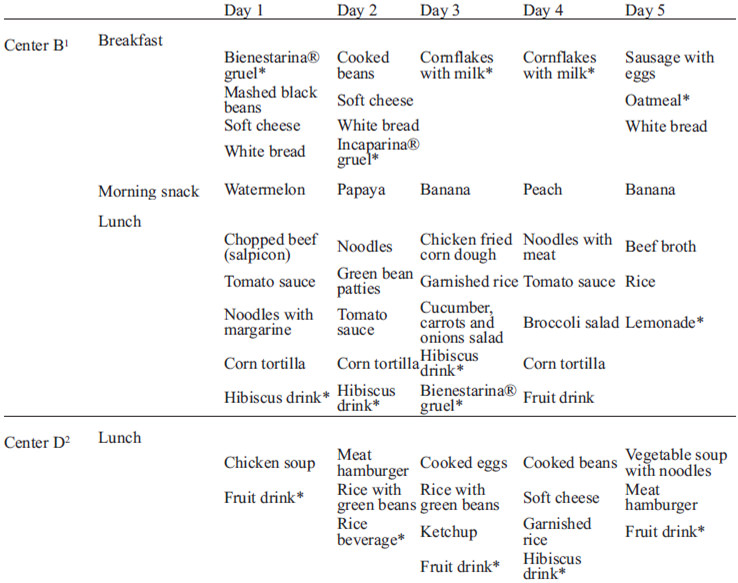
The quantity and quality of food items provided at the 2 day-care centers examined varied greatly. Center B provided breakfast, lunch and an afternoon snack, whereas center D only served lunch (Table 1). It is important to note that all day-care centers reported a 4-weeks cyclical menu. As such, the day-to-day variability is limited to a set number of menu plans. In both centers no plate leftovers were observed, therefore all children consumed equal portion sizes.
As would be expected from the differential offering of meals between the 2 centers, the absolute and relative contribution from home-derived and institutional foods and beverages were markedly different as well (Table 2). More interesting, however, is the fact that home diets do not complement the day-care center menus to produce a common full day’s caloric intake in an equivalent manner; total estimated energy intake was 304 kcal lower in the site (p=0.04) where only one meal was offered (center D). This, in turn, is associated with lower intakes of protein, carbohydrates, and fat and 6 of 8 micronutrients examined, namely vitamins A, B1, niacin and B6, and iron and zinc in the sample from the latter institution (Table 2).
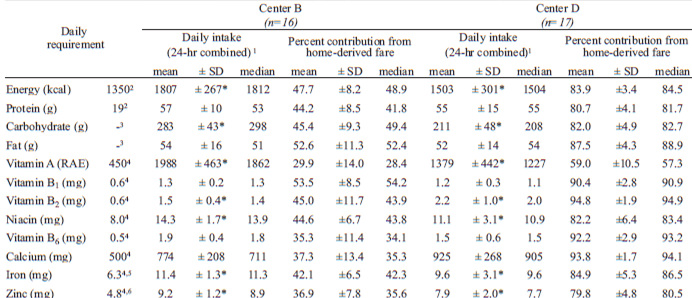
The pattern of relative contribution from home and institutional fare was, of course, vastly different. For the population attending center B, where breakfast, lunch and snacks were offered, only 47.7% of energy was consumed at home; this contrasts to 83.9% for those cared for in center D, where only a lunch was provided. The amounts of specific nutrients provided by home foods varied from 29.9% of total for vitamin A to 53.5% of total for vitamin B1 among center B preschoolers. In center D, 59.0% of all vitamin A was provided at home, whereas 93.8% of daily calcium and 94.8% of daily vitamin B2 came from home source.
Since total energy was significantly different across the samples studies, nutrient-density transformations were made to provide a more systematic and quantitative comparative framework (Table 3). Nutrient densities for fat, vitamin B2 and calcium densities were lower in center B, whereas carbohydrates and vitamin A densities were lower in center D. No differences were observed for protein, vitamins B1, and B6, niacin, zinc and iron.
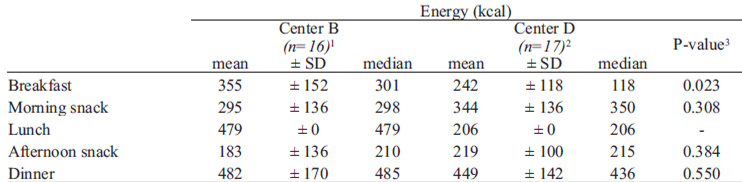
With respect to specific repasts (Table 4), in center B breakfast contributed one-fifth of the children’s daily energy and the remaining energy was contributed uniformly by snacks (27%), lunch (27%) and dinner (27%). In center D, snacks contributed 38% of the daily energy, dinner 30%, and the remaining energy was contributed uniformly by breakfast (16%) and lunch (16%). Differences in nutrient contributions were observed between the 2 day-care centers for breakfast and snacks, but not dinner. In center B, for example, breakfast supplied more energy, carbohydrates, fat, vitamin A, niacin and zinc than in center D. When examining the differences in nutrient densities of breakfast between the 2 centers, these differences disappeared while others emerged, namely for vitamins B1, B2, and B6 and calcium (data not shown).
In relation to the recommendations for daily micronutrient intakes (Table 2), estimated intakes greatly exceeded the daily requirement in both centers across the whole day. Nutrient-density transformations were made to adjust for differences in energy intakes between the 2 centers (Table 3).
The top leading sources of energy and nutrients were remarkably similar for children attending both centers; the top 8 sources are illustrated in Table 5.
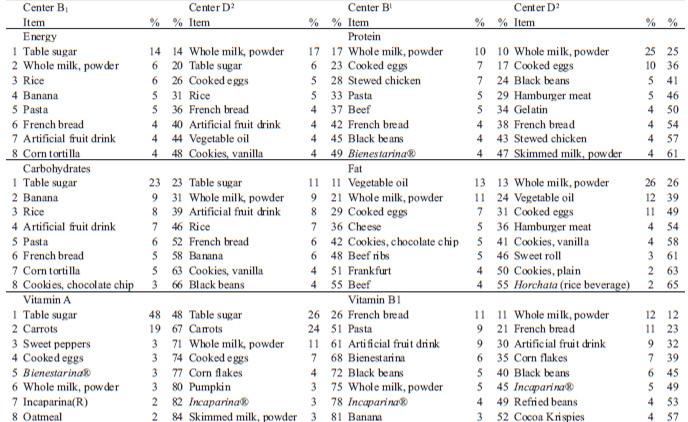
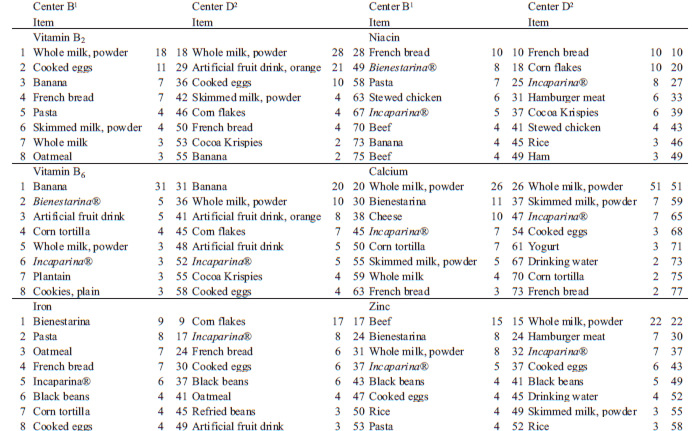
Milk powder and white sugar were the main sources of energy of the diet of the children attending both day-care centers examined. Fortified white sugar was also the main source of carbohydrates and vitamin A. Milk powder was either the main source or among the main sources, of protein, fat, vitamin B1, B2, calcium and zinc. Overall, for energy, niacin, iron and zinc, the 10 leading food sources contributed less than 60% of their total intakes, whereas for calcium and vitamin A, the top 10 sources provided more than 70%. Perhaps the most marked contrast is the contribution of fortified granulated table sugar to the vitamin A intake. population of center B, serving 3 repasts, where it is only around 25% in the children from the center C, serving only daily one meal. In both settings, however, the 10 main sources of this vitamin comprise over 85% of all of the vitamin A that is consumed. Fortification is an important source of iron in this population. In center B, 7 of the top 10 sources of food were iron-fortified or enriched. In center D, 5 of the 10 had iron added in the processing of the basic ingredient, e.g. wheat flour in white rolls, or of the finished product.
Nutrition is one of the most critical determinants of child well-being (1). The consumption of insufficient or excessive macro- or micronutrients has adverse consequences in childhood (1,2). For the children we examined, 24-hr energy intake estimated from the combination of direct weighing in centers and parental recall exceeds the recommended energy intake for children in the age-group of interest in both sample populations; by 33.8% for center B and by 11.3% for center D. As no anthropometric data were gathered in the present study, no effect of greater than normative energy consumption on body composition could be assessed. However, the day-care centers had structured recreational activities and there would be no adverse consequences in this age-group if superior energy intakes if it were offset by increased average energy expenditures.
Children being provided either 3 meals or a single meal at the day-care centers had adequate nutrient intakes, both when expressed as absolute and when adjusted for differences in energy intakes between the 2 centers. A particular concern may be the excessive consumption of preformed vitamin A. Guatemala was in the forefront of public health action to reduce endemic hypovitaminosis A when it initiated voluntary fortification of table sugar with retinyl palmitate in 1987 and mandated fortification from 1992 to the present. The recommended fortification level is 10 mg/kg of active vitamin A. This means that each gram of refined sugar provides 10 RAE with the preformed vitamin. Sugar is a prominent contributor to total carbohydrates and total energy for the institutional menu and the home fare, as well as a top source of vitamin A. Daily intakes of vitamin range from 890 to 2074 RAE. It is possible that the intake of preformed vitamin A exceeds the Upper Tolerable Level (UL) for preformed vitamin A of 900 ug/day (19) in the diets of some of the children.
The patterns of main food sources of nutrients are remarkably similar in the 2 centers examined, despite the number of meals being provided varying between a single meal and three. This suggests that center B’s institutional menus reflect what household of the same social class would otherwise choose for the remaining meals in the home. However, when comparing the main sources of energy and nutrients in the total daily diet of the children (Table 5) with the main sources provided at the day-care centers (12), differences can be observed. Table sugar, for example, is not amongst the top 10 sources of energy at the day-care centers, but it is the main and second largest source of the total diet. The emergence of “junk foods” such as cookies, as well as healthful foods such as meat and tortillas can be noted. Given the traditional role played by lime-treated corn in Guatemalan cuisine (20), it is surprising to see that tortillas are only the fifth and seventh leading sources, respectively, of calcium (Table 5).
The present study has several caveats and limitations. Firstly, a portion of the findings used in the analysis have been presented in an isolated context of day-care center menus papers only in a separated publication (12). They have been reanalyzed and combined in an aggregated presentation in this study. The limited number of days for the institutional portion (5 days) and home portion (3 days) may fall short of a representative estimate for both day-care and home setting. On the day-care center side, however, it is unlikely that the average day is too far outside of the normative range at both centers. With less than 20 children of the target age attending either center, we run into an intrinsic constraint to exploring diversity and variance. However, given the lack a dietary variety in these children, we would not expect a greater sample to significantly change the findings of the study. Furthermore, the methodology was different in the day-care centers in which all items could be accurately observed and measured than in the homes in which we relied on self-reports. The greatest limitation of the study is that the data collection periods at the centers and in the homes took place at different times of the year. Although the menus remained mostly unchanged, some seasonal variation would be expected. Children may have been ill on one or more of the three day of data-collection. The framework, finally, covers only week-day intakes, excluding weekends. Hence, rather than a generalizable assessment of principles, the present description and comparison should be considered in the domain of a case-study format. It would obviously provide different magnitudes of contrasts if day-care center pairs had been randomly included. Since the 2 situations chosen, however, were opposites within the selection of the original 4 centers studied (12), this case-study tries to frame an example of the contrast.
A strength within the study is the exactness of the assessment of institutional menus having direct recording of ingredients in preparations and weighing of portions served in cups and plates. This is not matched, of course, in the estimations of home consumption in which direct observation was not feasible, as 24-hr recall is inherently less accurate (21), and somewhat more doubtful when it is parent reporting for a child (22,23). Additional acknowledged inaccuracy is introduced here, as in any diet study using reference food composition tables, by any non-representative reflection of the nutrient data-base for the actual foods consumed.
Recent scientific insights allow the maximization of health benefits in the selection of dietary constituents (24). The choices of foods and beverages have implications for chronic disease, that have recently been found to emerge from childhood dietary patterns. The emergence of consuming foods away from the home may pose either an additional hazard to nutritious and healthful eating or an opportunity to leverage improvement. Several studies reported better nutritional status in children attending day-care centers versus those that were not (25,26). An institutional setting is a prime situation to establish healthy eating patterns. This can be achieved through the promotion of healthful, culturally appropriate foods such as the corn tortilla and the limitation of table sugar consumption. The present descriptive analysis provides the basis for suggesting possible reforms, and contributes to the understanding of the challenges and opportunities for children attending low-income day-care centers in Guatemala City.
As stated above, we view this as a case-study approach to documenting the constraints and possibilities for achieving diversity in preschool diets for children who attend day-care centers and receive part of their daily fare from the institution and another part from the home. Although the case-study involves only two centers and covers less than 40 children, perhaps from the good fortune of having polar contrasts regarding the number of meals served in the two settings, a panorama of the range of possibilities has been developed. In this examination, the overall dietary variety was superior in the situation of greater contribution of home fare, but overall the nutrient density and adequacy of the aggregate intakes did not differ in any important manner. Finally, a cautionary tale for the potential of achieving excessive vitamin A intake in the preschool sector of the Guatemalan population from the nationally-mandated sugar-fortification program emerges from the quantitative findings.
This project was supported by Hildegard Grunow Foundation of Munich, Germany and, Sight & Life Task-Force of Basel, Switzerland.
Recibido: 13-09-2012
Aceptado: 11-01-2013