
Most childhood obesity research has classified participants by normative standards for Body Mass Index (BMI) through population percentiles or values corresponding to overweight adults (World Health Organization (WHO), Centers for Disease Control and Prevention (CDC) and the International Obesity Task Force (IOTF)). In 2006, criterion-referenced standards (FitnessGram®) were developed (revised in 2010) which directly associate BMI values with adverse health outcomes. This study assessed agreement between normative and criterion-referenced standards. Participants included 653 Mexican American 3rd to 5th graders living in the U.S.-Mexico border area who participated in a health promotion project. At baseline, agreement was compared between normative and criterion-referenced classifications. At follow-up, agreement between classifications on changes (e.g. from overweight to healthy weight) was assessed. According to FitnessGram® standards, 53.0% of participants were overweight or obese at baseline. Compared to FitnessGram®, the IOTF and CDC standards classified 15% fewer participants as obese/high risk. The WHO standards were closely related to FitnessGram® (kappa=.925) and showed significantly greater agreement with FitnessGram® than the CDC (kappa=.925 versus 0.722, p<.001) and IOTF standards (kappa=.925 versus .682, p<.001). Compared to the FitnessGram® (8.9%), the WHO and CDC (8.6%) were similar, but IOTF standards lower (6.5%) in how many children improved following the health program. Despite acceptable agreement between the different indices, several normative classifications may underestimate the proportion of children who are at risk for BMI-related adverse health consequences.
Key words: Obesity, Overweight, BMI, FitnessGram®
Muchos de los estudios sobre la obesidad infantil clasifican a los participantes por índices normativas para el índice de masa corporal (IMC) usando valores de percentil de población o valores correspondientes a adultos con sobrepeso (Organización Mundial de la Salud (WHO), Centros para el Control y Prevención de Enfermedades (CDC) y la Comisión International Sobre la Obesidad (OITF)). En 2006, índices con referencias a criterios (Fitness-Gram®) fueron creados asociando valores de IMC directamente a valores de impacto de salud adversos. Este estudio determino las equivalencias de los índices normativos y los con referencias a criterios. Los participantes incluyeron estudiantes (N=653), niveles 3°-5, viviendo en la frontera EEUU-México. Al inicio, se comparó la equivalencia entre el IMC basado en las clasificaciones normativas y los con referencias a criterios. La equivalencia entre las clasificaciones de los cambios fue evaluada. Según las normas Fitness-Gram®, 53.0% tenían sobrepeso o eran obesos aunque las normas OITF y CDC indicaron menos de 15% fueron clasificados con obesidad/alto riesgo. Las normas WHO fueron más cercanamente relacionadas con las de FitnessGram® (kappa=.925) y mostraron significativamente mayor equivalencia con las de FitnessGram® que a las del CDC (kappa= .925 V .722, p<.001) e IOTF (kappa=.925 V .669, p<.001). Los índices FitnessGram® (8.9%), WHO y CDC (8.6%) fueron similares en cuanto el número de niños que mejoraron siguiendo el programa, pero el índice IOTF fue menor (6.3%). Aunque había un acuerdo aceptable entre los índices diferentes, varios pueden subestimar la proporción a riesgo y las consecuencias adversas relacionadas al IMC.
Palabras clave: Obesidad, Sobrepeso, IMC, FitnessGram®
Physical Therapy and Orthopaedic Manual Therapy Practice de Heer, Voorburg, The Netherlands University of Texas at El Paso, Department of Psychology, El Paso, Texas
Northern Arizona University, Department of Physical Therapy and Athletic Training, Flagstaff, Arizona Northern Arizona University, College of Health and Human Services, Flagstaff, Arizona
Over the past decades, rates of obesity and being overweight have increased strongly for children and adolescents (1). Children are becoming overweight at a younger age, as almost a quarter of pre-school children are currently obese or overweight (1). Given that about 70% of overweight children continue to be overweight in adulthood (2), and that rates of overweight and obesity are higher among rapidly growing minority populations (3), obesity is expected to continue to be a major public health challenge.
The outcome variable most commonly used in studies addressing childhood overweight/obesity has been Body Mass Index (BMI). Although BMI is not a direct measure of body fat, it has been found to be strongly associated with the most accurate body fat measures (r = 0.80-0.90) (4). Further, BMI is easy and inexpensive to measure. Importantly, BMI has been found to be positively associated with risk factors for cardiovascular diseases such as elevated blood pressure, adverse lipoprotein profiles and diabetes (5). Different classification methods have been developed that classify children according to their BMI.
The Centers for Disease Control and prevention (CDC) (6) and World Health Organization (WHO) (7) use ‘normative reference standards’ to classify children according to their BMI relative to their peers. According to the CDC and WHO BMI growth charts, being overweight is defined as having a Body Mass Index of over the 85th percentile and obesity is defined as having a BMI of over the 95th percentile.
A key difference between the two is that the CDC growth charts are a reference of how a population has developed over a certain period. The CDC standards published in 2000 (6) are based on the growth of a population of children in the U.S. from the 1960s through 1994. In contrast, the WHO values for BMI are standards, aimed to ‘describe the growth of healthy children who grew up under optimal conditions.’ A criticism of both the CDC and WHO percentiles are that the 85th and 95th percentile cut-offs are arbitrary, and that constructing growth references based on populations that longitudinally trend toward overweight and obesity will lead to an underestimation of overweight/ obesity and an overestimation of underweight (8).
The International Obesity Task Force (IOTF) standards have been developed (and updated in 2012) incorporating data from six different countries including the United States and classify children by different levels of ‘thinness’, normal weight, overweight and obese (9,10). Instead of population percentiles, the standards were developed as the children’s equivalent of adult overweight (BMI≥ 25kg/m2) and obesity (BMI≥30kg/m2). Since adult overweight and obesity have been associated with adverse health consequences, these international standards are likely to relate children’s BMI with health consequences. However, similar to the limitations of the CDC and WHO standards, the IOTF cut-offs were not designed to define what BMI cut-off points are the strongest predictors of future adverse health consequences.
While adverse health consequences of childhood obesity have long been known, only recently have researchers begun to directly associate classifications of obesity with adverse health consequences (5). In this context, Flegal and Ogden (11) have pointed out that instead of debating how to define overweight and obesity, it might be more important to consider what BMI cut-points best predict future health risks and how to efficiently screen for such risks.
In 2006, ‘criterion-referenced’ standards called ‘FitnessGram® standards’ were developed and revised in 2010 (12). The unique feature of these standards is that they classify a child according to their health risk, rather than their status as overweight or obese. Categories based on a child’s BMI include a BMI that is a) ‘very lean’, b) in the ‘healthy fitness zone’, c) at ‘some risk’ or d) at ‘high risk’ for adverse health consequences such as cardiovascular and metabolic conditions. The complete FitnessGram® measurement protocol includes measures of body composition, aerobic capacity, strength and flexibility and is currently implemented state-wide in several states including Texas, the site of the current study.
Several studies reported the extent of agreement or discrepancies among the WHO, CDC and IOTF standards (13-17). Most studies found moderately high agreement (kappa coefficients >. 60) (13, 14), although some reported that the odds of classifying a child as obese or not obese varied substantially across these classifications (15-17). To date, however, there is little knowledge about the extent to which the most commonly used normative-referenced standards (CDC, WHO and IOTF) are in agreement with criterion-referenced standards that directly associate BMI with health consequences such as the FitnessGram® 2010 standards. Examining whether the most commonly used standards indeed classify children as healthy whose body composition may be associated with adverse health consequences can have important implications for health promotion efforts.
Using data from a randomized after-school project conducted among a population of predominantly Hispanic elementary school children (18), we assessed the extent of agreement between for classification of children’s BMI across most commonly used normative standards (CDC, WHO, IOTF) to the newly develop criterion-referenced standards (FitnessGram®). We further assessed whether choosing a classification influenced conclusions about the obesity prevention program’s impact (change in BMI from baseline to follow-up).
The health promotion project was initiated in 2008 in El Paso, Texas a major city located directly on the U.S.- Mexico border. The health promotion project consisted of a 12-week after-school physical activity and nutrition education program (18). The after-school program was based on physical activities developed by the Coordinated Approach to Children’s Health (CATCH) (19), a comprehensive child health program widely implemented. The health education was based on the bilingual (English-Spanish) Bienestar program (20). Bienestar is a health education program developed in response to the rising diabetes rates among underserved Hispanic youth and consists of 16 modules on for example healthy eating, exercise, drinking water and diabetes (20). The current study sample included a total of 653 participants across 70 classrooms and 6 schools. The mean age of the participants was 9.3 years (SD=1.0) and 50% were boys. In 4 of the 6 schools, over 80% of children were of Hispanic descent, over half were socio-economically disadvantaged and had limited English proficiency (21). Parental consent and children’s assent at appropriate reading levels in Spanish or English was acquired before program implementation. The institutional review board of the University and the school district approved all procedures and measures.
The FitnessGram® protocol was measured during Physical Education classes. The FitnessGram® protocol consists of a test battery of multiple measures indicative of physical fitness including body composition, aerobic capacity, muscular strength and flexibility (12). Each of these measures has been independently associated with risk for chronic conditions. For each FitnessGram ® measure, an individual receives a score which is then classified as being in a healthy range or in an unhealthy range (associated with adverse health consequences, for example, high BMI or low aerobic capacity). FitnessGram® does not, however, provide a comprehensive risk score, and although completing all measures provides a more complete picture of an individual’s health status, each measure in itself is associated with health consequences. For the current paper, we will only present the measure used for body composition: BMI, calculated as weight in kilograms divided by height in meters. Height and weight were measured using a Tanita BF 215 portable digital scale. Participants were instructed to empty their pockets, take off their shoes and if applicable, their jacket. They were then asked to step on the scale, and stand up straight. During that time, the height rod was pulled up and placed gently on the top of their head. Their height was recorded to the nearest 0.25 inch. Their weight was read and recorded from the digital scale to the nearest 0.1 pound. Their BMI was calculated using standard formulas of (Weight in Pounds) x 703 / [(Height in inches) x (Height in inches)].
Five classifications were compared for weight or health status based on BMI (Table 1): three were normative reference standards 1) the CDC growth charts, 2) the WHO growth charts, 3) the IOTF standards, which classify children either as underweight (-1), normal weight (0), overweight (1) or obese (2). These classifications were compared to the criterion-referenced FitnessGram® 2006 and revised FitnessGram® 2010 standards for BMI. The ‘FG06’ BMI standards include categories (-1) below healthy fitness zone, (0) in the healthy fitness zone and (1) ‘needing improvement.’ The FitnessGram® 2010 (‘FG10’) BMI categories include very lean (-1), in healthy fitness zons (0), at some risk for adverse health consequences (1) and at high risk for adverse health consequences (2).
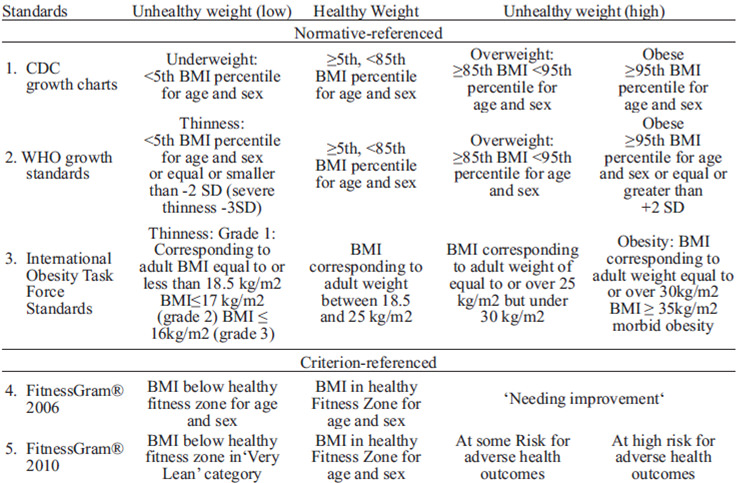
An example of agreement is a 10-year old boy with a BMI of 18.5 kg/m2, who is considered normal weight according to the IOTF standards, and at a healthy weight according to the FitnessGram® 2010 standards. An example of a discrepancy is a 10-year old boy with a BMI of 19.5 kg/m2, who is considered normal weight according to the IOTF standards, but according to the FitnessGram® 2010 standards, this child is at some risk for adverse health consequences.
We first assessed the proportion agreement and kappa-coeffcients across approaches, calculated with SPSS 17.0 frequencies and crosstabs. Secondly, we assessed whether each of the kappa-coefficients were significantly different from the other kappa coefficients following procedures by Barnhart and Williamson (22). Based on these procedures, a macro in SAS (SAS Institute Inc., Cary, NC) using the SAS PROC CATMOD procedure was used (22) to test for the equality of two kappa statistics, with a significant pvalue indicating a statistical difference between the two values. The rationale behind testing this was to assess whether, for example one normative classification (e.g. WHO) agreed better with the criterion-referenced standards (FitnessGram®) than the other normative classifications.
Finally, we compared the proportion agreement across different classification systems regarding the change in health status following participation in the study. So, if a participant reduced their at-risk status from overweight to healthy weight by CDC, WHO or IOTF standards, did they also change from unhealthy to healthy according to the FitnessGram® values?
These analyses were conducted with SPSS 17.0 and included McNemar tests for paired proportions.
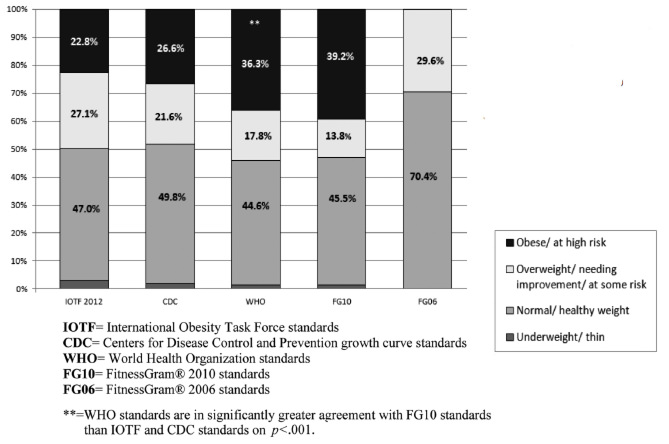
The proportion of children that could be classified as overweight or obese ranged from 29.6% (the FitnessGram ® 2006 standards) to 54.1% (the WHO standards; Figure 1). The FitnessGram® 2010 standards classified 53% of participants as at some or high risk for adverse health consequences.
We compared agreement across the FitnessGram® 2010 and CDC, WHO and IOTF classifications (FitnessGram ® 2006 standards were not included in this comparison as this classification did not have the same categories as the other classifications and coefficient kappa could not be calculated).
The WHO standards showed the highest agreement with the FitnessGram® 2010 standards (kappa=0.925), followed by the CDC and FitnessGram® 2010 (kappa=0.722) and IOTF and FitnessGram® 2010 (0.682). The kappa statistics were significantly different from each other: the agreement between the WHO and FitnessGram® 2010 (kappa=0.925) was significantly greater than the agreement between the CDC and FitnessGram® 2010 (Kappa of 0.925 vs. 0.722; χ2(df=1)=21.03, p<.001 for the test of equivalence of kappa’s. Further, both the WHO (kappa 0.925 vs. 0.682; χ2(df=1)=35.16, p<.001) and CDC (kappa 0.722 vs. 0.682; χ2(df=1)=5.85, p=.012) showed better agreement with the FitnessGram® 2010 scores than the IOTF values.
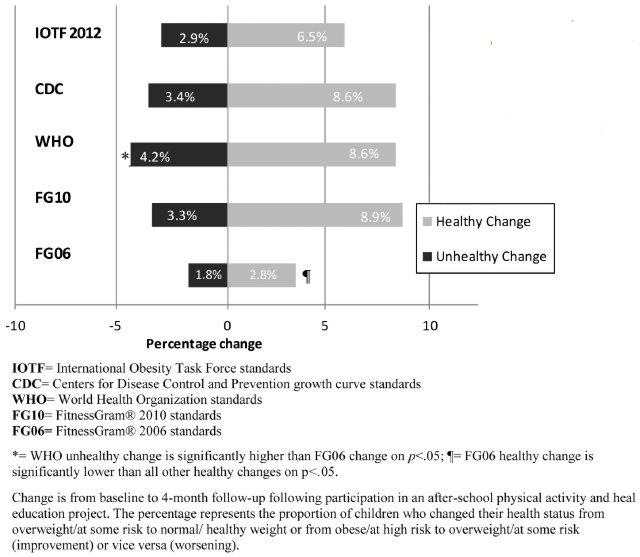
We assessed the change in BMI classification from baseline to 4-month follow-up among all participants (Figure 2). A healthy change occurred if the participants’ weight status changed from overweight/some risk to healthy weight or from obese/high risk to overweight/some risk. The proportion of children improving their BMI weight or health status category ranged from 2.8% (FitnessGram® 2006) to 8.9% (Fitness-Gram® 2010), whereas the proportion of participants worsening their health or weight status ranged from 1.8% (FitnessGram® 2006) to 4.2% (WHO). The proportion of participants improving or worsening their BMI health status according to FitnessGram® 2010 were significantly different from the change according to the FitnessGram® 2006 standards (χ2 (df=3) = 28.29, p<.001), but not significantly different from the normative reference standards: the CDC (χ2 (df=3) =1.41, p=.702), WHO (χ2 (df=3) = 1.97, p=.374) or IOTF (χ2 (df=3) =2.44, p=.487).
The current study compared classification methods of childhood weight and health status in a sample of of predominantly Hispanic elementary school children living on the U.S.-Mexico border. Particularly, we compared the most commonly used normative standards including population percentiles (by the CDC and WHO) and the childhood equivalence of adulthood overweight (IOTF) to health-related or criterionreferenced standards (the FitnessGram® 2010 standards). The study population was a high-risk population, which is reflected in all classifications indicating that approximately half of the participants are at risk for adverse health outcomes. The average agreement between all classifications was moderately high, although the CDC population percentiles and IOTF standards classified fewer children as at high risk/obese than the WHO and the FitnessGram® 2010 standards. Of the most commonly used standards, the WHO standards were most closely related to the criterion-referenced standards.
The current study found moderately high agreement across all classifications, which is consistent with prior research (13,14). However, put into perspective, the CDC and IOTF standards classified approximately 5% of children as having a normal or healthy body weight, whereas they may actually be at risk for adverse health consequences. Although this percentage may seem small, this represents 33 children in this study alone. In addition, the proportion of children classified as obese or high risk based on their BMI was approximately 15% higher with the FitnessGram® 2010 (39.2%) and WHO (36.3%) classifications compared to the CDC (26.1%) and IOTF (22.8%) classifications. This means close to 100 children in this study would be classified as overweight/at some risk instead of obese/at high risk for adverse health consequences. These findings thus suggest that the WHO standards may be the most accurately predictive of health-related body composition outcomes such as high blood pressure, cholesterol and glucose. These findings are consistent with prior research by Ramirez and colleagues (17) who found that among children in Northwest Mexico, the WHO standards classified about twice as many (39% vs. 20% for CDC and 17% for IOTF) children as obese or overweight. These findings are further consistent with a large cohort study in Brazil by Vieira and colleagues (14), who reported that the IOTF standards had high sensitivity in terms of classifying overweight, but may underestimate the prevalence of obesity compared to the WHO standards.
Impact of the health promotion program was fairly consistent across classifications (with the exception of the original FitnessGram® 2006 standards), with proportions of children improving their BMI status (from obese to overweight or overweight to healthy weight) ranging from 6-9% and 3-4% worsening. Although not significantly different, the IOTF classification was over 2% lower than the other classifications. According to the IOTF classification, 42 children improved their health status from obese to overweight or from overweight to healthy weight, whereas the CDC, WHO and FitnessGram® standards would have concluded that approximately 55 or 60 children improved their health status. Thus, choosing a classification system can make the difference in drawing a conclusion that a program is about 30% more or less effective in improving children’s BMI status.
The largest differences were found between the FitnessGram ® 2006 and 2010 standards. Interestingly, the original FitnessGram® protocol (2006) was used during the intervention time of the study (in 2008), but the reivsed version (2010) was published during the study analysis phase. For the current study, while the FitnessGram® 2006 would have classified fewer children as having an unhealthy weight, it would have also led to the conclusion that the impact of the after-school program was smaller.
Several important issues have to be noted when interpreting the findings of the current study. For example, prior research among children in Bolivia has found that none of the three major standards (CDC, WHO and IOTF) were applicable to a population of Bolivian adolescents (23). The authors indicated that all major growth references are based on populations from Caucasian ancestry, and that South America, the Middle East, the African Continent, and Central America have not been represented in these references (23). Although the current study was conducted in the United States, almost all children were of Mexican ancestry, which may have impacted the classification.
Another issue that has to be taken into account is that other indicators of body composition were not measured in the current study, such as waist circumference or body fat percentage. This is important, as for example waist circumference has been shown to have a stronger association with obesity-related health risk and recent research has shown that the health risk of children may be classified differently based on their BMI or waist circumference (24).
An important strength of the current study is that it is the first to compare normative BMI-based reference standards with comparative reference standards. This study further included a relatively high-risk population, for whom health consequences can be potentially identified at an early age. Limitations of the study include that the sample was fairly small and the setting of the study was unique to the U.S.-Mexico border. As a result, findings of the current study may not generalize to other populations. Other limitations include that the current study did not take into account pubertal development, which may impact the validity of the BMI classifications. Future studies may look at the predictive value of a comprehensive risk score (such as taking into account all FitnessGram® measurements or other indicators of body composition such as waist circumference) and other factors including sex, age, ethnicity and family history (11).
Comparing different classifications of childhood weight showed that several normative classifications may slightly underestimate the proportion of children who are at risk for adverse health consequences as a result of their BMI. Of the currently most frequently used classifications, the WHO standards are most closely related to criterion-referenced standards that associate weight status with adverse health outcomes. Accurately classifying children with respect to adverse health consequences may be particularly important in areas with a large number of high risk children with limited access to primary preventive services such as the U.S.-Mexico border area.
This project was supported by pilot research grants from the Center for Border Health Research through the Paso del Norte Health Foundation and by the pilot research grant mechanism of the National Institutes of Health Hispanic Health Disparities Research Center (grant P20MD002287-01).
Recibido: 13-01-2013
Aceptado: 06-08-2013