
The purpose of this work was to establish predictive equations for the digestibility of proteins of animal and vegetal origin by correlating in vitro and in vivo methods. Proteins sources for animal and vegetable were used. To calculate in vitro digestibility, we used pH values obtained 10 min after a solution of enzymes was added to a protein solution (pH-drop method). We also used the pH-static method, which measures the volume of additional NaOH that is necessary to maintain a pH of 8.0 after the addition of an enzymatic solution. In vivo digestibility was measured in newly weaned male rats that were fed a diet of AIN-93G for growth with a modified protein content of 9.5% for 14 days. The equations developed using the pH-drop method allowed us to predict in vivo digestibility amounts that were more closely correlated with real in vivo digestibility than those obtained with equations using the pH-static method. In vitro techniques are less expensive, require less manpower and physical space, and use a smaller quantity of protein
Key words: Protein, in vitro digestibility, in vivo digestibility, pH.
O objetivo deste trabalho foi estabelecer equações de predição para a digestibilidade das proteínas de origem animal e vegetal, correlacionando métodos in vitro e in vivo. Foram utilizadas proteínas de origem animal e vegetal. Para o cálculo da digestibilidade in vitro foram utilizados os valores de pH obtidos em 10 min após a adição da solução de enzimas (método de queda de pH). Também foi utilizado o método de pH estático, o qual mede o volume de NaOH adicionado, necessário para manter o pH em 8,0 após a adição de uma solução enzimática. A digestibilidade in vivo foi medida em ratos machos recémdesmamados que foram alimentados com uma dieta AIN- 93G para crescimento com teor de proteína modificada de 9,5% durante 14 dias. As equações desenvolvidas utilizando o método de queda de pH permitiram prever em quantidades digestibilidade in vitro que foram mais estreitamente correlacionadas com a digestibilidade in vivo do que aqueles obtidas utilizando equações do método de pH estático. As técnicas in vitro são menos dispendiosas, exigem menos mão-de-obra e espaço físico, e utiliza uma menor quantidade de proteína.
Palavras chave: Proteína, digestibilidade in vitro, digestibilidade in vivo, pH.
Federal University of Viçosa, MG, Brazil. Federal University of Espírito Santo, Brazil. Federal University of São João Del Rei Campus of Sete Lagoas, Brazil. Federal University of Viçosa Campus of Rio Paranaíba, Brazil.
Classical methods to determine the protein efficiency ratio (PER) include measuring nitrogen balance, biological amount, chemical score, and digestibility and protein digestibility corrected amino acid score (PDCAAS). PDCAAS was introduced by FAO/WHO in 1985 and is the accepted measure for evaluating protein quality. PDCAAS is defined as the relationship between the content of the first amino acid limiting protein (mg/g) and the content of that amino acid in a reference protein (mg/g) multiplied by true digestibility. The standard of reference is based on the necessity of essential amino acids for children between 2 and 5 years old, as defined bythe FAO/WHO (1985) (1,2).
The digestibility of protein is determined as a function of the ingested nitrogen fraction that the animal absorbs. True digestibility is obtained by measuring the difference between the amount of ingested nitrogen and the amount of nitrogen in faeces. This figure is corrected by examining the quantity of fecal nitrogen that an individual excretes when consuming a diet free of protein (3, 4).
Several factors may influence the digestibility of a protein, including the presence of compounds within the aliment, such as anti-nutritional factors, or external factors, such as processing and storage (5). The reduction of anti-nutritional factors by different methods of food processing or by genetic improvement may change protein digestibility. However, performing in vivo tests to evaluate the digestibility of each processing change in foods or to evaluate each new difference in processing are both expensive and time-consuming. In vitro methods may predict digestibility variations due to changes in food processing more quickly and economically than in vivo methods.
The majority of methods for determining in vitro digestibility are based on the digestion of samples by proteolytic enzymes under standard conditions. The number and nature of enzymes used for the final measurement of digestibility vary among methods (6).
The purpose of this work was to determine the in vivo digestibility of different proteins and to perform equation adjustments to establish their in vitro digestibility according to different methods.
The following protein sources were used: commercial casein (Rhoster Indústria e Comércio Ltda, Araçoiaba da Serra, SP, Brazil), bovine meat, pork meat (SearaAlimentos, Rio Grande da Serra, SP, Brazil), chicken meat (PifPafAlimentos, Visconde do Rio Branco, MG, Brazil), fish meat, frog meat without bone, mechanically separated frog meat, frog meat with bone (Criação Experimental da Universidade Federal de Viçosa, Viçosa, MG, Brazil), instant powdered milk (NestléBrasilAlimentos, Araçatuba, SP, Brazil), whey protein (Pura Maximus 80%, Viçosa, MG, Brazil), rice, beans, soya bean, quinoa, textured vegetable protein, oat, maize (ground), and wheat (flour) (SupermercadoEscola, Viçosa, MG, Brazil).
Meats from chicken (chest without skin), pork (hind leg without apparent fat), and fish (hake filet) were boiled in water in saucepanmoist heat to 100°C in a proportion of 1:1 (p/v), for about 40 min, until they absorbed all of the water. After cooking, the meats were frozen at -18ºC, dehydrated in a freezedrying machine for 24 h, grinded in a food processor, and sifted in a 1-mm sifter.
Grains of polished white rice, were cooked in water in a saucepan. Bean cv. ‘Pérola’ were cooked in a pressure cooker for 40 min. After cooking, both grains were dried at 60ºC in a sterilizer with air circulation (Tecnal brand, TE-394/2 model, Piracicaba, SP, Brazil) for 24 h. The grains were then ground in a food processor (Arno brand, FP15 model, São Paulo, SP, Brazil), and sifted in a 1-mm sifter to produce rice flour.
Soya beans were submitted to thermal treatment by dry heat at 89°C in a sterilizer with air circulation (Tecnal brand, TE-394/2 model, Piracicaba, SP, Brazilfor 5 min. The grains were ground in a food processorand then sifted in a 1-mm sifter to produce soya flour.
Quinoa, textured vegetable protein and oat was ground in a food processor(Arno brand, FP15 model, São Paulo, SP, Brazil) and sifted in a 1-mm sifter.
In vivo digestibility data for bovine meat, frog meat without bone, mechanically separated frog meat, frog meat with bone, beans, maize (ground maize), textured vegetable protein, and wheat (flour) were obtained according to Pires et al. (6).
The protein content of each sample was determined using the Kjeldhal semi-micro method according to the AOAC (7). Different factors were used in the calculation of nitrogen conversion to protein: instant powdered milk factor 6.38; rice factor 5.95; soya factor 6.25; oat and wheat (flour)factor 5.83; and other protein sources factor 6.25 (8).
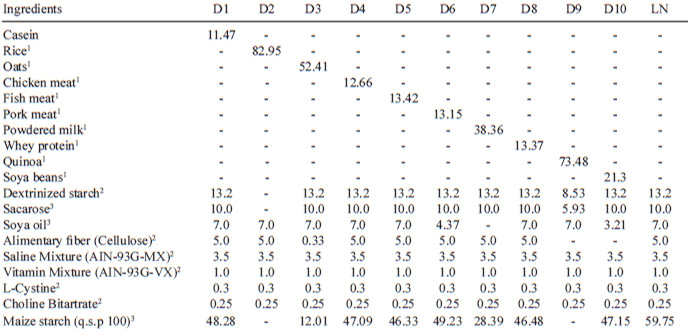
Non-protein diet, casein diet (standard), and test diets were prepared with the studied protein samples, as shown in Table 1. The composition of the diets was based on AIN-93G for growth, according to Reeves et al. (9), with an adjusted protein content of 9% to 10% for all diets, except the rice diet, which contained 7% protein. The quantities of other diet ingredients (starch, dextrinized starch, sucrose, oil, and cellulose) were also amended based on the composition of the tested foods to determine which diets were iso-caloric and iso-protein (Table 1).
After preparation, which was determined by the protein content of each diet, diet samples were placed into polyethylene bags, appropriately labeled, and stored in a refrigerator. A total of 66 newly weaned male Wistar rats were used. The average age of the animals was 23 days, with a weight of 50 to 60 g. The animals were obtained from the Health and Biological Sciences Center (CBB) nursery of the Federal University of Viçosa, Viçosa, MG, Brazil.
The animals were assigned to 11 groups, with 6 animals in each group. The average weight among these groups did not exceed 10g. The rats were allocated to individual cages, where they received water and food ad libitum for 14 days. The animals were maintained at 22 ± 3ºC, with 12 h of day and night. Their alimentary consumption was monitored weekly.
At the end of the experiment, the animals were euthanized with carbon dioxide and buried in a designated location at the Veterinary Medicine Department of the Federal University of Viçosa. The experiment was performed in accordance with the rules of the Brazilian College for Animal Experimentation (COBEA) and international rules described in Handbook of Laboratory Animal Science (10). Ethical and methodological aspects of this study were submitted to the Ethics Committee for Animal Research and recorded at the Federal University of Viçosa under number 50704454851.
To determine digestibility, the diets were dyed with indigo carmine at 100 mg/100 g and offered to the animals on the 7th and 10th days of the study. Their faeces was collected in individual pots on the 8th through 11th days and refrigerated. On the 8th day, only the dyed faeces was collected. On the 9th and 10th days, all faeces was collected. On the 11th day, only not dyed faeces was collected.
At the end of the experiment, the fecal samples were dried in a sterilizer with air circulation at 105°C for 24h. The fecal samples were then cooled, weighed, and ground in a processor (Arno brand, FP15 model, São Paulo, SP, Brazil) to determine their nitrogen concentration using the Kjeldahl semi-micro method, with triplicate samples (7).
True digestibility was calculated by measuring the quantity of nitrogen that was ingested through the subjects’ diet, the quantity that was eliminated through faeces, and the metabolic loss at faeces, which corresponds to the fecal nitrogen of the group with a non-protein diet, using the following equation (4):
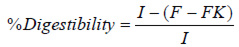
I = Nitrogen ingested by the test group.
F = Fecal nitrogen of the test group.
FK = Fecal nitrogen of the group with a non-protein diet
Two methods of in vitro digestibility analysis were investigated using an enzymatic system of trypsin enzymes and pancreatine, obtained from Sigma-Aldrich, Saint Louis, Missouri, USA. The obtained equation was used to correlate the in vitro studies with the in vivo tests and predict the true digestibility through techniques that did not demand the use of animals and that yielded results with less time and cost.
An enzymatic solution of bovine trypsin enzymes (2.5 mg/mL) and pork pancreatine (1.6 mg/mL) was placed in purified water and subjected to both methods to form a solution of protein hydrolysates. The enzymatic solution was immediately prepared before each series of tests and maintained in an ice bath.
The pH-drop method is based in the correlation between the initial velocity of proteolysis and digestibility, measured via pH, using an enzymatic solution to digest the sample. The method described by Hsu et al. (11) uses trypsin enzymes, chymotrypsin, and a peptidase. In the current study, an enzymatic solution of trypsin enzymes and pancreatine was used for protein hydrolysis.
A 50-mL volume of protein suspension was prepared in distilled water (6.25 mg of protein/mL), adjusted to pH 8 with a solution of NaOH, and placed under agitation in a water bathat 37ºC. A 5-mL aliquot of enzymatic solution wasthen added to the protein suspension, which was maintained at 37ºC in the water bath. The decrease in pH was measured after the addition of an enzymatic solution at 15 s and every minute for a period of 10 min using a digital potentiometer (Tecnal brand,TEC-2MP model, Piracicaba, SP, Brazil). Enzymatic digestion was characterized by a decrease in pH that occurred 10 min after the enzymatic solution was added. Decreases in pH after 10 min and parameter equations were used to describe the correlation between the in vitro digestibility andthe in vivo true digestibility.
To determine in vitro digestibility through the pH-static method, trypsin enzymes and pancreatine were used to prepare an enzymatic solution. This is a modification of a method described by Cruz et al. (12), which used trypsin enzymes, chymotrypsin, and pancreatine.
A 50-mL volume of protein suspension was prepared in distilled water (6.25 mg of protein/mL), adjusted to pH 8.0 with a solution of NaOH, and incubated with agitation by thermostatic bath (Tecnal brand, TE-184 model, Piracicaba, SP, Brazil) at 37°C. A 5-mL aliquot of enzymatic solution was then added to the protein suspension. Next, NaOH0.1 mol/L was added in sufficient quantities to maintain the pH at 8.0 such that the pH did not vary by more than 0.03 units in 1 min. The 0.03 factor is based on the hydrolysis of casein, during which the pH decreasesafter 9 to 10 min. At this point the difference in pH isvery small but not significant (12). The volume of NaOH added during the test was measured and related to enzymatic digestion by an equation that describes the volume of NaOH required to maintain a pH of 8.0. The volume of NaOH expended during the test and the equation of parameters were used to describe the correlation with in vivo true digestibility.
The pH amounts in the pH-drop method and the volume of NaOH used to maintain a pH of 8.0 in the pH-static method were obtained from Pires et al.(6) for samples of bovine meat, frog meat without bones, mechanically separated frog meat, frog meat with bones, beans, maize (ground maize), textured vegetable protein, and wheat (flour) and from Sant’Ana et al. (13) for samples of oats, chicken meat, fish meat, pork meat, powdered milk, quinoa, and soya beans.
For both methods, several samples were analyzed to verify the effect of each protein source on digestibility. For each method, in vitro digestibility was compared to a) the true digestibility of all samples; b) the true digestibility of all samples except casein; c) the true digestibility of protein samples of vegetal origin; and d) the true digestibility of protein samples of animal origin.
For the pH-drop method, the true digestibility was described as the decrease in the pH of the samples 10 min after the addition of an enzyme solution. For the pH-static method, the true digestibility was described based on the volume of 0.1 mol/LNaOH added to maintain a pH of 8.0 in the protein solution after the enzymatic solution was added.
Non-linear regression was used to obtain equations for in vitro digestibility using the Sigma Plot program Version 8.0 (14).
To determine equations for in vitro digestibility, pH levels were recorded 10 min after the addition of a solution of enzymes. These amounts were correlated with the in vivo digestibility of the respective samples, and the best mathematical model to describe the system was chosen based on significant levels of r2 (the behavior data are represented by an equation) and correlation with the biological model of digestion. The equations developed based on the pH values measured after 10 min of exposure to an enzyme solution are shown in Figure 1.
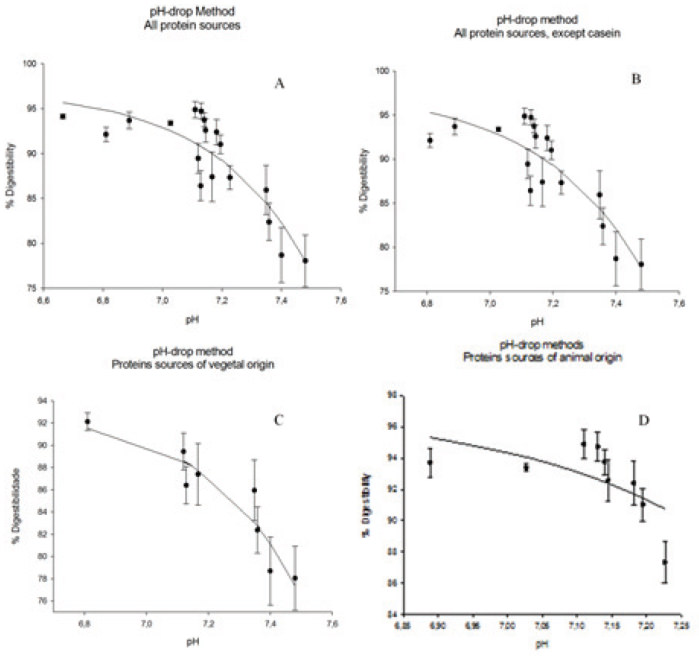
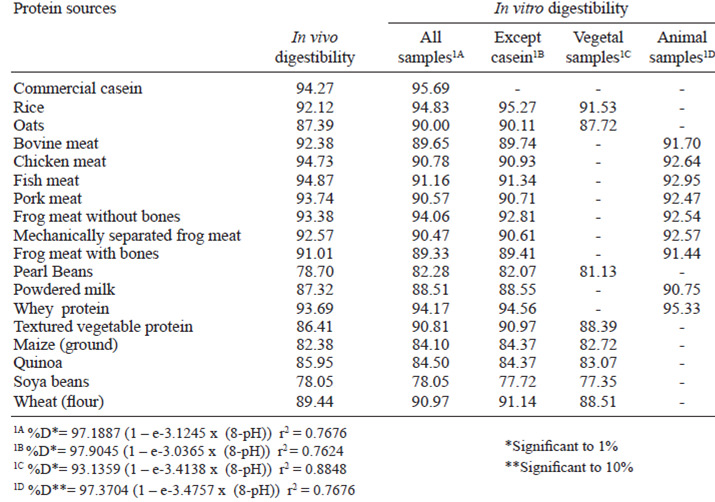
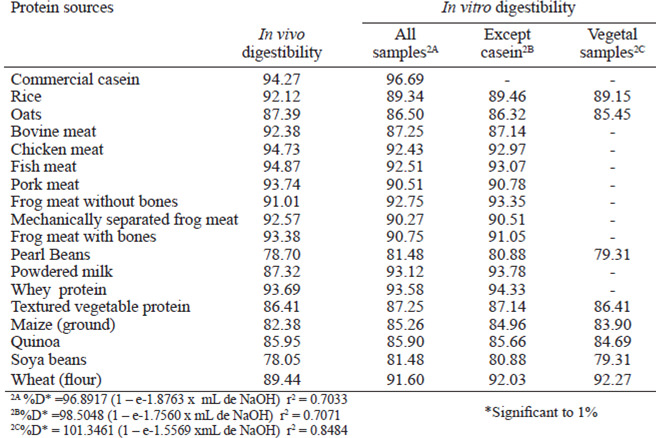
Figure 1A shows the equation that was obtained based on the in vivo digestibility data and the pHdrop of all protein sources. The obtained equation is exponential and has an r2 of 76.76% of the variability of digestibility in vivo is explained by the adjusted model. In Figure 1B, all protein sources were used except casein, and thus an equation with an r2 of 76.24% was obtained. Figure 1C shows only the proteins of vegetal origin, which permitted us to obtain an exponential digestibility equation that takes pH into account with an r2 of 88.48%. The equation shown in Figure 1C, offered the best explanation of digestibility given the drop in pH. However, the equation shown in Figure 1D, in which only proteins of animal origin were used, yielded the worst adjustment, with an r2 of 41.61%. This equation offered the least compelling correlation of in vitro digestibility behavior with in vivo digestibility. The in vitro digestibility’s obtained from the equations shown in Figure 1, compared with their respective in vivo digestibility’s, are shown in Table 2.
To determine the in vitro digestibility using the pH-static method, the volume of a solution of 0.1 mol/L NaOH needed to maintain a pH of 8.0 after a solution of proteins and a solution of enzymes were added was measured. The equations prepared based on the amounts of NaOH expended to maintain a pH of 8.0 after the addition of an enzyme solution is shown in Figure 2. Figure 2A shows the equation obtained from the in vivo digestibility data and the amount (in mL) of NaOH that was expended to maintain a pH of 8.0 forall protein sources. The obtained equation is exponential and has an r2 of 70.33%. Figure 2B shows the equation for all protein sources, except casein, for which we obtained an equation with an r2 of 70.71%. The curve with the highest r2 value for the pH-static method was obtained for proteins of vegetal origin (r2= 84.84%, Figure 2C). Figure 2D shows the equation for samples of animal origin, for which the obtained digestibility amounts and the volume of NaOH did not permit an exponential adjustment to the other three curves (Figures 2A, 2B, and 2C) because the in vivo digestibility were very similar, with the exception of the powdered milk sample. The equation makes a square polynomial adjustment and has a very low r2 value (8.45%), and both parameters and regressions are not significant (p>0.10). However, this only occurs with the data from samples of animal origin.The curve was not made to correlate the digestibility with the volume of NaOH expended to maintain a pH of 8.0. For samples of animal origin, the equations obtained from Figure 2A or Figure 2B should be used. Using the pH-drop method, we observed a linear behavior for samples of animal origin, with an average digestibility of 93.24% when powdered milk was omitted.
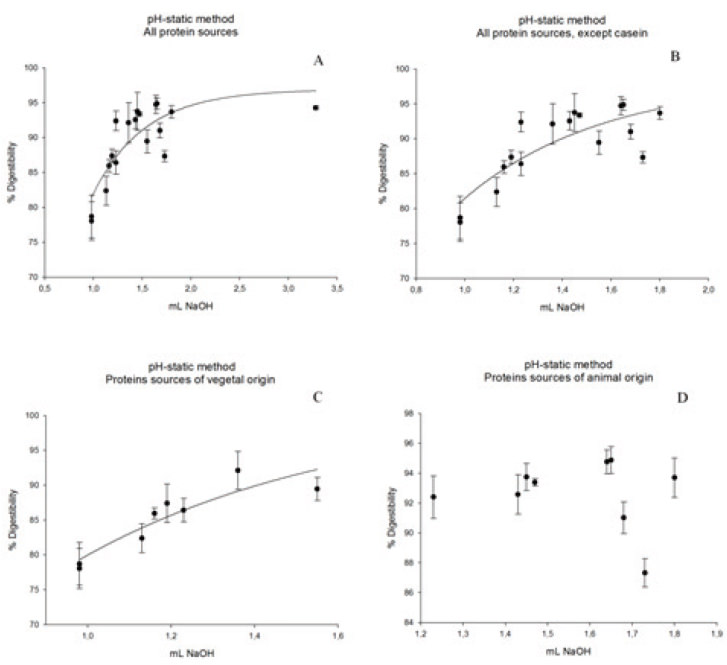
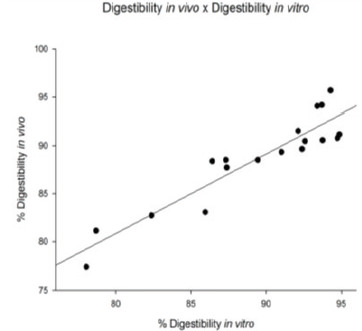
The results for in vitro digestibility as calculated by each one of the equations obtained by the pHstatic method are shown in Table 3. Table 3 shows the in vitro digestibility obtained using equation 1A for samples of animal origin and equation 1C for samples of vegetal origin. Using the amounts obtained for in vivo digestibility and in vitro digestibility calculated using equations 1A and 1C (Table 4), we obtained a linear relationship with an r2 of 86.12% (Figure 3). Thus, from the equation obtained in Figure 3, we can predict in vivo digestibility.
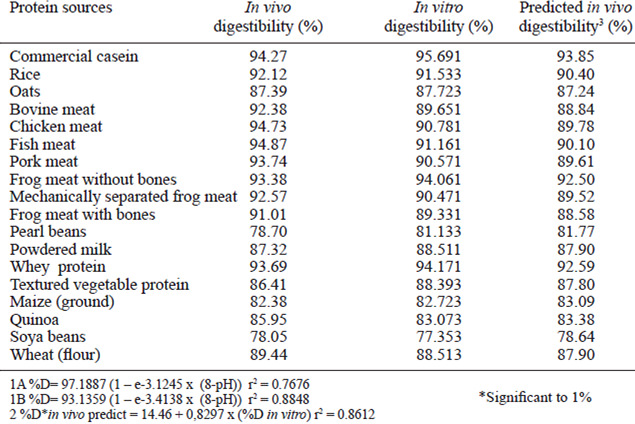
The equations obtained in Figures 1A and 1B have similar r2 values. Thus, the presence of casein does not influence curve adjustments. Pires et al.(6) adjusted a square polynomial model to describe digestibility as a function of the pH-drop amounts and observed that in the casein sample, the r2 level decreased because the reference point to the casein was very distant from the others, which compromised the equation. This phenomenon was not observed in the exponential model because a large increase in the pH-drop creates a small increase in the digestibility at pH levels down to 6.8. An exponential model was chosen because it better adapts to the studied biological model. As pHdrops increase, the digestibility also increases, but after a certain threshold, the increase in the pH-drop levels are related to increases in the digestibility amounts. In this case, the pH-drop level observed for the casein sample does not change as the curve adjusts. Through exponential adjustments, we observed that for an infinite pH-drop amount, a digestibility of 97.19% can be obtained from the equation found when using all samples (Figure 1A), 97.90% from all the samples except casein (Figure 1B), 93.14% from only the samples of vegetal origin (Figure 1C), and 97.37% from only the samples of animal origin (Figure 1D). The equation obtained by Figure 1D presented worst adjustment because the in vitro digestibility of the proteins of animal origin yielded more variable results than those obtained for in vivo digestibility.
The in vitrodigestibility’s obtained from the equations above are similar to the in vivo digestibility’s. For samples of vegetal origin, the in vitro digestibility obtained by equation 1C is similar to the in vivo digestibility. Although equation 1D shows a low r2 value (41.61%), it yields amounts closer to the in vitro digestibility for samples of animal origin, except powered milk, when compared to the in vivo digestibility. The diet containing powdered milk was the food of animal origin that presented the lowest digestibility. The digestibility of the diet with powdered milk was lower than that of casein, but casein contains the highest proportion of milk protein ingredients, which represent approximately 80% of its total proteins (14). The presence of lactose in the powdered milk likely caused light diarrhea in the experimental animals, increasing intestinal flow, and, consequently, nitrogen excretion. Thus, the in vivo digestibility of the powdered milk diet was reduced. When we omitted the data for the powdered milk-containing diet, we observed a linear behavior similar to that observed for the samples of animal origin, with an average in vivo digestibility of 93.24%, independent of the origin of the animal samples and the obtained pH-drop level.
By using the pH-static method to determine in vitro digestibility, Cruz et al.(12) obtained larger r2 values compared to tests of the in vivo digestibility of different species of beans that were newly gathered and stored. This method permitted them to obtain r2 levels that varied from 75% to 83%.
For all observed curves, the pH-drop method yielded larger r2 values. However, to determine the in vitro digestibility of proteins of vegetal origin, we recommend the use of the pH-drop method, as shown in Figure 1C. To determine the in vitro digestibility of proteins of animal origin, we recommend the pH-drop method using the equation shown in Figure 1A, which was obtained from the digestibilities of all samples.
The digestibility determined using the equation in Figure 3 differs by 0.44% to 5.22% from the true digestibility obtained in vivo. Thus, the pH-drop method is a good method to determine the in vitro digestibility of foods and may be used to predict protein digestibility. In vitro techniques are less expensive, require less manpower and physical space, and use a smaller quantity of protein.
The values obtained for the digestibility of the samples ranging from 78.05% (soybean) and 94.87% (fish meat) (Table 4). The digestibility of animal protein and rice is presented high in relation to other vegetable proteins, for not having anti-nutritional factors.
Pires et al. (6), Mendes et al. (16) and Usydus et al. (17) observed true digestibility values of 90.13% and 98.7% for animal protein, results that show the high digestibility of animal proteins.
The digestibility of rice protein was 93.56% (Table 4). Boisen et al. (18) studied the digestibility of different varieties of rice, found digestibility values ranging from 92.5% to 98.8%. The proteins present in rice are easily digested and absorbed, but will not necessarily be well used for growth and maintenance, lack of essential amino acids. Mendes et al. (16), studying the quality proteins, found PER values NPR 64.1% and 79.9% for rice, in relation to casein.
Of all proteins analyzed those that had lower true digestibility were soybeans (78.05%) and beans (78.70%). Vegetable proteins have over antinutritional factors that contribute to decreased digestibility as phytates, tannins, protease inhibitors (5).
The digestibility of a protein source may vary depending on its origin, variety, thermal treatment, or other types of processing. Thus, in vitro techniques could be used with low cost to predict the digestibility of new varieties of food or foods that have been processed differently (6), more rapidly and in a less resource-intensive manner.
Both methods that were analyzed in this work yielded in vitro digestibilities that were strongly correlated with in vivo digestibility. Methodological changes such as the use of only trypsin enzymes and pancreatine reduce expense do not affect the correlation with in vivo digestibility. The equations developed using the pH-drop method allowed us to obtain in vitro digestibility amounts that were more closely correlated with in vivo digestibility than those obtained using equations obtained using the pH-static method. This finding indicates the possibility that food industries could utilize this method of testing the in vitrodigestibility of alimentary products to predict protein digestibility.
The method of in vitro digestibility by measuring the pH fall after hydrolysis of proteins showed better correlation with in vivo method, should preferably be used to predict the true digestibility.
The financial support from CNPq and FAPEMIG.
Recibido: 01-10-2015
Aceptado: 08-12-2015