
The dietary practices of diverse population groups, associated with the nutritional transition and the rapid demographic changes occurring globally require more attention to the food preferences of migrant groups such as Latinos living in the United States United States of America (US). This work aimed at the performance of an instrument utilized to measure availability of healthy food options in Latino stores located in the town of Somerville, state of Massachusetts. The methodology included the application of two versions: Guatemalan and US of the Nutrition Environment Measures Survey for Stores (NEMS-S), for the assessment of the availability of healthy food options in three Latino stores. Data were analyzed using descriptive statistics. The results indicated that foods sold in Latino stores were identified more successfully with the Guatemalan-NEMS-S than with the US NEMS-S. There was a general lack of healthy food options found when using the US survey, as well as a relatively narrow selection of fruits and vegetables. As conclusion, it was found that the US NEMS-S tended to identify a lower number of healthy food options, as compared to a larger number of similar options when a culturally-appropriate survey was used. These findings illustrate a manner in which a culture-specific instrument perform more appropriately than similar instruments adapted for other population groups, especially when the results are to be applied to support development of healthy food policies.
Key words: NEMS-S, food environment, Latinos, food policy.
Las prácticas alimentarias de diversos grupos de población, asociadas a la transición nutricional, y a los rápidos cambios demográficos que se producen a nivel mundial, exigen más atención a las preferencias alimentarias de grupos migrantes, como por ejemplo Latinos en los Estados Unidos de Norteamérica (EU). Este trabajo documenta los resultados de aplicar un instrumento para medir disponibilidad de alimentos saludables en tres tiendas latinas ubicadas en la ciudad de Somerville, estado de Massachusetts. La metodología utilizada incluyó la aplicación de dos versiones: guatemalteca y EU de la Encuesta para Medir Ambiente Nutricional en Tiendas (NEMS-S, siglas en inglés), para evaluar la disponibilidad de alimentos saludables. Los datos se analizaron con estadísticas descriptivas. Los resultados indicaron que los alimentos vendidos en las tiendas latinas fueron identificados con más acierto con el NEMS-S guatemalteco que con el NEMS-S de EU. Con este último instrumento, se obtuvo un número menor de opciones saludables y una selección limitada de frutas y de vegetales. Como conclusión, se encontró que el NEMS-S de EU identificaba un menor número de opciones de alimentos saludables, en comparación con el instrumento culturalmente apropiado. Estos hallazgos ilustran la importancia de utilizar instrumentos específicos para determinar disponibilidad de alimentos saludables, especialmente cuando los resultados se utilicen para apoyar el desarrollo de políticas alimentarias.
Palabras clave: NEMS-S, ambiente alimentario, Latinos, políticas alimentarias
https://doi.org/10.37527/2017.67.2.003
Tufts University, Department of International Relations, School of Medicine, Boston, MA, EEUU.
London School of Hygiene & Tropical Medicine, London, United Kingdom . Center for Studies of Sensory Impairment, Aging, and Metabolism (CeSSIAM), Guatemala City, Guatemala
Food patterns and consumption practices are intrinsic components of population groups across the world. Those dietary practices are influenced by the physical environment, particularly those products identified as edibles, but also by the cultural practices that define people. Extensive research indicates that food patterns play substantial roles in the causation and prevention of chronic, non-communicable diseases (1) and that the food environment, including access to food outlets and the presence of healthy choices, is associated with eating behaviors (2, 3). It has been shown that shopping preferences are linked to obesity and that the lack of healthy food options in grocery stores leads to weight-gain (4). Successful policies should also be part of a larger plan to change social norms (5). In response to this challenge, the Nutrition Environment Measures Survey for Stores (NEMS-S) was developed in the first decade of the millennium as a well-defined measurement tool to examine the availability of healthy food options in grocery and convenience stores in the United States (6). We refer to this original instrument as US-NEMS-S
Cultural factors play a significant role in determining shopping preferences, as food-related behavior is modified by culture (7, 8). Ethnic identity is positively correlated with consumption of culturally-significant foods and negatively correlated with the consumption of ‘convenience’ or prepackaged foods (9). Stores targeted to specific ethnic groups, including Latinos, serve as important sites for the preservation of their homeland culture (10), including their food preferences.
Despite the significance of culture in shaping food preferences, current research lacks a culturally-specific analysis of what drives food preferences, specifically for the growing Latino population, particularly recent arrivals of Central Americans (Guatemalans, Hondurans and Salvadorians) in the northeast region of the United States . The present study aimed to contribute with information to help to fill this gap in knowledge by assessing the applicability of the NEMS-S survey modified for use in Guatemala (11) as compared to the original US-NEMS-S, which wa, both in its original version designed for the US population, and as modified for use in Guatemala (11). The site identified for this study was Somerville, a small city located north of Boston, state of Massachusetts.
The Guatemala NEMS-S (GUA-NEMS-S) survey contained items more familiar in a Latino diet, including selected fruits and vegetables, canned beans and boxed fluid milk. Researchers believed that the conduct of the GUA-NEMS-S would result in a more thorough analysis of the availability of healthy and unhealthy foods in stores in Latino communities in the US because the items on the survey would match those being sold in these culturally specific stores.
The primary objective of this study was to test the GUA-NEMS-S to examine the food environment in a convenient, small sample of Latino stores, located in East Somerville, in which there is a rapidly growing Latino population, primarily of Central American origin. Secondarily, researchers also utilized the NEMSS surveys to assess the availability of healthy food options in the three Latino stores. The corresponding hypotheses were: 1) The foods found in the three Latino stores will apply more closely to the GUA-NEMSS than the original survey created for US stores (US-NEMS-S); and 2) There will be a general lack of healthy food options in these small stores indicated by the results of the NEMS-S surveys.
Through enumeration of the study area (Eastern Massachusetts), researchers selected the city of East Somerville, for its urban location and large Latino population, particularly recent migrants of Central American origins. A list of food outlets was compiled from a previous study conducted in the area (12) and from the 2010 Somerville census data. This study focused only on grocery stores. Larger chain grocery stores were also eliminated because the Latino or “international” aisles were too small to compare to local stores directly targeted to the Latino population.
After the creation of an initial list, where 8 stores were identified, researchers visited the study area to narrow the store selection and to obtain permission from storeowners. A map of the East Somerville community was created using Geographic Information Systems (GIS). Food outlets were categorized using the system described in the NEMS online training (13). After enumerating and physically locating them, only 4 stores were identified as “Latino Stores”, from which three store managers agreed to participate in the study. The local Institutional Review Board approved this study, and owners or managers of the Latino stores gave informed consent.
Finally, researchers created store layouts of the items sold in the three Latino stores and diagramed the floor plans.
NEMS-S was the tool used to quantify the availability of healthy food options in the three Latino grocery stores of study. Researchers completed the US-NEMS-S online training to become certified NEMS raters. Then they participated in the creation of the GUA-NEMS-S. This new survey was pilot-tested in stores in Quetzaltenango, Guatemala, and proved accurate as a modification for items included in the Guatemalan diet (14).
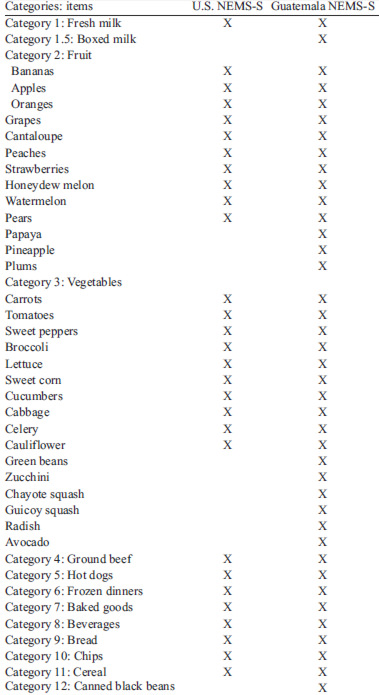
The US-NEMS-S measures the availability of foods in 11 categories with healthy and regular options for each item. The categories include: milk, fruit, vegetables, ground beef, hot dogs, frozen dinners, baked goods, beverages (soda/juice), bread, potato chips, and cereal. The GUA-NEMS-S included 13 categories, those from the original US-NEMS, plus boxed milk and canned beans. Within the categories, the individual items added to the Guatemala survey were papaya, pineapple, and plums for fruit, and green beans, zucchini, chayote, guicoy squash, radishes and avocados for vegetables. These items were chosen to reflect the Guatemalan diet.
In the US-NEMS-S survey, there were 10 fruit, 10 vegetables, and 9 non-produce healthy food items. Fruit and vegetable items were all considered healthy food options, and each additional category had regular and healthy options (e.g. whole milk vs. skim milk). Eleven healthy food options were added to the GUANEMS-S, so the total number of healthy food items on the US-NEMS-S and GUA-NEMS-S surveys was 29 and 40 respectively. Table 1 lists items on each NEMSS version.
Two researchers completed each of the NEMS-S (US and Guatemala) in the three stores on one occasion per store. The inter-rater correspondence of the items common to the US-NEMS-S and GUA-NEMS-S surveys was calculated.
Pearson Chi-Square tests were used to undertake four inquiries: 1. Inter-survey comparison of the 29 common items: areas of interest were availability of healthier options, fruit, and vegetable items in the three Latino stores; 2. Inter-store comparison of healthier options of combined surveys; the percentage of available non-produce healthy food items (n=9) was calculated for each store and analysis was done to determine the differences in non-produce healthy availability across stores; 3. Inter-store comparison of fruits and vegetables of combined surveys: the percentage of available fruits (n=10) and vegetables (n=10) was calculated for each store and analysis was done to determine the differences in fruit and vegetable availability in stores; and 4. Relative availability of additional items: For each instrument (US and GUA-NEMS-S), researchers compared the cumulative percent availability of healthy items.
The stores were small, with only one or two cash registers. All three stores had sections for many of the same items found in larger stores and supermarkets. Many of the sections, however, were limited or lacking certain items. There were some unique properties to the stores. Store 1 had a liquor sales outlet in an adjacent location, and Store 3 had a Money-Gram® station, which allows immigrants to send remittances to their home countries. A lack of price labeling on the majority of food items was common to all three stores.
The inter-rater concordance was 100% for the items of the US version common to both instruments when comparing the rater conducting store evaluation by the US-NEMS-S with the rater using the GUA-NEMS-S. Thus, the presence or absence of each of these items on the store shelves was identically reported by both raters for all three stores.
As there was 100% inter-rater concordance between raters for the 29 common items, there was a redundant certainty of the status of these items across store sites. This allowed the analysis of all of the items (none were in dispute) for inter- store analysis. Table 2 (non-produce items) and Table 3 (produce items) present the pooled results found in each store regarding the availability of items included in both, the US-NEMSS and the GUA-NEMS-S.
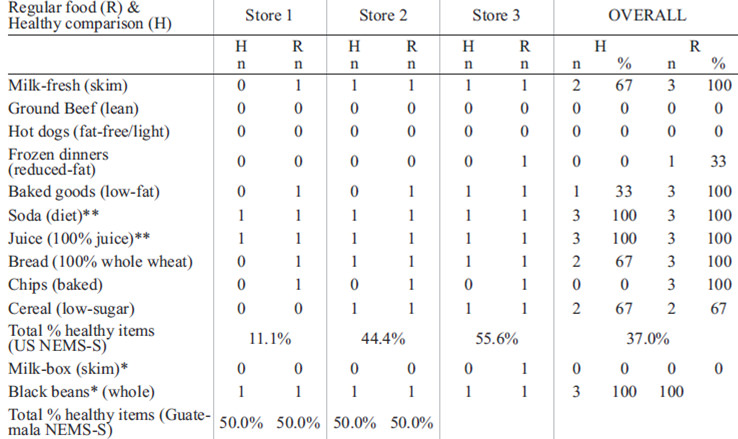
Focusing on the non-produce items (Table 2), all three stores had the following regular versions of index items: milk, baked goods, soda, juice, chips, and bread. All three also had the healthier beverage options – diet soda and 100% juice – in stock. Two out of three stores had skim milk, low-sugar cereal, and whole wheat bread, on the healthier side, and regularly sweetened breakfast cereal. Only one store had frozen dinners and low fat baked goods available. Raters never found healthier versions of chips (baked) or frozen dinners (lowfat), nor were ground beef or hotdogs found in either regular or healthier format.
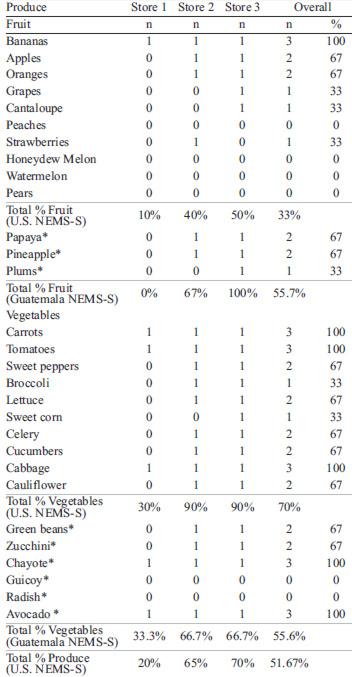
Focusing on the specific availability of the healthier options, a first examination of the core items was done (Table 2). For external comparability, a comparison of the core list of the 9 non-produce items (with soda and juice now constituting a single category of beverages) was done across sites. The cumulative availability in Store 1 was 11.1%, in Store 2 was 44.4%, and in Store 3 was 55.6% (Table 2). By Chi-square analysis, the differential availability of non-produce items was not statistically significant (p=0.127). Store 1 had availability of 20% of the total 20 produce items, Store 2 had 65% and Store 3 had 70% (Table 3). By Chi-square analysis, the differential availability, considering all 29 elements of the U.S. NEMS-S, was highly statistically significant (p=0.002).
Four items in two contrastpairings (i.e. regular versus healthy comparison) were added to the GUA-NEMS-S to complement the US offering: boxed (UHT) whole milk, boxed skim milk, canned refried black beans and whole black beans. All stores had both the healthier and regular option for black beans. Conversely, neither skim nor whole milk in the boxed presentation were found in any store visited.
Nine items were added to the GUA-NEMS-S, including three fruits: papaya, pineapple and plums, and six vegetables: green beans, zucchini, chayote, guicoy, radish and avocado (Table 3). Store 1 had none of the additional fruits. Store 2 had two of the three additional fruits and Store 3 had all three additional fruits (Table 3). With regard to the additional vegetable items, Store 1 had two of the six items; Stores 2 and 3 both had four of the six items (Table 3).
Despite the uneven contribution to fruits from the original list (n=10) and with the additions from Guatemala (n=3), a comparison across the total of three stores was done. Data was normalized by expressing them as the cumulative percentage availability from each separate origin. Because of the limited number (n=2) of the Guatemalan items in the regular items category, no comparisons were done with them.
Overall, the percentage availability of fruits in the three stores was 33.3% for the original list (n=10) and 55.7% for the modified (Guatemalan) list (n=13) (p = 0.660). The percentage availability across stores was also calculated for vegetables of the original list (n=10) versus the modified list (n=16). Overall, thepercentage availability of vegetables from the original list was 70% and the availability of vegetable additions was 55.6% (p = 0.423) (Table 3). In summary, two of the three stores had at least one of the three added fruits available; two of the three stores had at least two of the six added vegetables available. All stores had canned black beans available.
Many studies have utilized the US-NEMS-S as a tool (13). Yet, there are few studies that have documented the performance of the US-NEMS-S within the United States, particularly in the Northeastern region. Of the three published studies that reported the instrument performance of the NEMS-S, the inter-reliability determined by kappa had range of 0.00 to 1.00 in one study to 0.75 to 0.95 to the narrowest range reported by Glanz et al from 0.83 to 1.00 (15, 16). Four studies report inter-rater reliability by percent agreement that range from about 77% to 100% for two studies; and two studies have near perfect agreement (15, 16, 17). Compared to these previous studies, the performance of the GUA-NEMS-S was consistent or exceeded that of the previous studies who have reported statistics on instrument performance.
The high inter-rater concordance between NEMS-S raters could be in part due to a couple of favorable conditions. In contrast from the assessment of the GUA-NEMS-S survey conducted in Guatemala (14), raters in this study had full cooperation and approval of store management. This allowed raters to thoroughly conduct the surveys instead of furtively scurrying to collect the data. Although desirable, these conditions are not characteristic of grocery stores, so future NEMS-S raters should proceed with caution. Rimkus et al aptly note that in study where raters are in the same supermarket simultaneously collecting data low inter-rater reliability is unlikely given that both raters are exposed to the same supermarket environment at the same time (15).
Results indicate a range of availability of healthy food items between the three stores. Although located in the same area, and providing their services to the same population, it was noticed that Store 1 was poorly stocked for healthy items, whereas Stores 2 and 3 were better stocked with Store 3 having a slight advantage. To date, there are few studies that report the availability of each US-NEMS-S item in detail rather than a composite healthy food score (16, 21). When compared to these studies, there was substantially lower availability of baked chips, low-fat baked goods, low-fat beef, low-fat hot-dogs and any type of fruit. The availability of the other US-NEMS-S items found in this study was consistent with that previously reported.
It becomes evident in appreciating the degree of homology (29 of 40 items in common) across the instruments and the imbalance in number of items added to the GUA-NEMS-S, that no strict comparison of performance of the two versions of the instruments can be made. This would require further development of comparably-sized listings in which the availability of foods culturally preferred over the US options are substituted for some of those of the dominant culture in the USNEMS-S. This new survey still needs to be developed. However, the relative performance of the GUANEMS-S can be examined by looking at the sale of certain milk, beans, fruits and vegetables with a certain Latino affinity, in addition to those that are reflective of the US culture. The relative performance of the GUA-NEMS-S can be made by comparing the overall number of healthy items identified by the US-NEMSS. Across stores, the number of healthy items identified as available increased in the three stores: in Store 1 (9 vs. 12 items), in Store 2 (19 vs. 26 items) and Store 3 (21 vs. 29 items), respectively.
The application of the NEMS-S outside the US is limited (22, 24). In their 2014 review of the food environment literature, Anderson Steeves and coworkers identified as a main gap the paucity of studies in diverse settings, especially within developing countries (24). One study in Paraguay modified the NEMS-S to study the Paraguayan food environment and found that healthy bread and dairy options were limited (22). Martins et al also modified the NEMS-S to study food environments in Brazil by expanding upon the degree of food processing and its association with obesity (23). Therefore, the NEMS-S designed by Martins et al does not include a “healthy comparison” for each regular item; and includes foods divided into three categories by degree of food processing (e.g. nuts in group one; oils in group two; and instant noodles in group three). The comparisons between the work reported here and these studies are limited, but highlight the importance of designing and adopting survey methods to study food environments.
The major strength of this study is the theme of availability of healthy food options in the context of acculturation occurring in migrant communities with established elements of the US society. In addition, both field investigators were certified by the NEMS-S online training program, and had been deeply exposed to NEMS research in Guatemala. While neither of them, however, was a native speaker of Spanish nor part of the Latino community, the storeowners and store personnel, however, were sufficiently bilingual to exclude linguistic communication barriers as a problem in the study.
The orthodox NEMS-S protocol calls for making the observations, when possible, without alerting the store personnel to the inspection. Under the study circumstances, however, it was considered necessary and appropriate to establish full transparency and obtain authorization from the store owners. The achieved high inter-rater scores may derive, in part, from the relaxed conditions in the inspection, without the distraction of the furtive nature of an unannounced survey.
There was an imbalance in the evaluation, as only the 29 items in common with the US-NEMS-S instrument were assessed by both raters; how reproducible across observers is the recognition of the 11 additional food and beverage items important in Guatemalan cuisine couldn’t be reported. Moreover, the small overall number of items in the lists and their numerical asymmetry, with 29 items of established interest to the general US population and 40 of presumed relevance for the Latinos resident in the US, presented a problem in choice of a statistical approach for a strict parallel comparison across the instruments.
The results of this study highlight the importance of attending to the cultural characteristics of the diverse population groups that are more inclined to do their food shopping in small, ethnic stores such as those frequented by Latinos.
In the middle of the current epidemic of obesity and non-communicable diseases associated with eating patterns, it is needed to encourage and support owners of Latino stores to offer more ethnic specific healthy options of the traditional Latino food products.
Additionally, in the future, a second generation of culturally-sensitive NESM-S, that substitutes foods of a more tropical and Central American origin in the listing, rather than simply adding them on, will need to be developed and tested in a similar context and paradigm as the one that gave the cultural framework to this study.
Recibido: 16-09-2016
Aceptado: 11-03-2017