
Assessments of whether children are thin (low body mass index for age) or overweight are based on body mass index (BMI for age and sex) charts published by the World Health Organization (WHO), the International Obesity Task Force (IOTF), and the US Centers for Disease Control and Prevention (CDC). We aimed to determine whether these charts indicated different prevalence of thinness and overweight (obesity included) in indigenous and non-indigenous school aged children from different regions and ethnic groups in Mexico. A probability proportional to size, cluster sampling method was employed in four regions of the country. We recruited 1,731 children aged 7.0-9.9 (507 indigenous from six ethnic groups and 1,224 non-indigenous). BMI was calculated according to age, and thinness and overweight classifications were compared according to cutoff values in the WHO, IOTF, and CDC references. The WHO reference generated the highest rates for thinness (12.5%) and overweight (30%) in children across regions and ethnic groups. The CDC reference estimated the lowest rates of thinness in children (5.5%), and the IOTF reference estimated the lowest rates of overweight (24.7%). Estimates of both thinness (8.3%) and overweight (13.4%) rates were lower in indigenous than non-indigenous groups (14.3% and 37.5%, respectively). The WHO BMI for age chart estimated higher rates of thinness and overweight in children compared to the CDC and IOTF charts. Because thinness as indicator of undernutrition status is relatively new, differences in body composition among indigenous and non-indigenous children may justify the need for more appropriate screening criteria to compare the growth status
Key words: Overweight, references, Mexican indigenous, Mexican mestizos, children.
La clasificación del estado nutricio de los niños con delgadez o con sobrepeso se realiza empleando el índice de masa corporal (IMC para la edad y el sexo) con las tablas de la OMS, IOTF y CDC. El objetivo de esta investigación fue determinar si estas referencias resultan en diferentes prevalencias de delgadez y sobrepeso (obesidad incluida) en niños escolares indígenas y no indígenas de diferentes regiones de México. Se empleó un muestreo por conglomerados en cuatro regiones del país. Se reclutaron 1,731 niños con edades entre 7,0-9,9 (507 indígenas de cinco grupos étnicos y 1,224 no indigenas) durante 2006 y 2008. El IMC se calculó y se clasificó como delgadez y sobrepeso con los puntos de corte sugeridos por las referencias internacionales. Cuando se compararon las clasificaciones, la referencia de OMS generó la prevalencia más alta de delgadez (12,5%) y sobrepeso (30%) en niños de todas las regiones y grupos étnicos. La referencia de los CDC estimó las prevalencias más bajas de delgadez (5,5%) y la referencia IOTF produjo las proporciones más bajas de sobrepeso (24,7%). Las proporciones de delgadez (8,3%) y sobrepeso (13,4%) fueron más bajas en niños indígenas que en los no indígenas (14.3% y 37.5%, respectivamente). La referencia de la OMS del IMC para la edad produjo las prevalencias más altas de delgadez y sobrepeso en comparación con los estándares de CDC y IOTF. Dado que la delgadez como indicador de desnutrición en niños es de uso reciente, las diferencias encontradas entre indígenas y mestizos pueden justificar el contar con mejores herramientas de tamizaje en estudios de crecimiento.
Palabras clave: Sobrepeso, delgadez, referencias, niños indígenas, mestizos, México
Universidad Autónoma de Nuevo León, UANL, Facultad de Salud Pública y Nutrición, San Nicolás de los Garza, México. Centro de Investigación en Alimentación y Desarrollo, A. C. Hermosillo, Sonora, México. Universidad Anahuac Mayab, Mérida, Yucatán, México. Universidad de Ciencias y Artes de Chiapas, Tuxtla Gutiérrez, Chiapas, México
Developing countries and regions are currently facing a twofold burden of malnutrition; at the same time, the prevalence of underweight and obesity has risen in different regions. Nationally aggregated data hide disparities among regions and among different ethnic and socioeconomic groups. For example, in Mexico, stunting affects more than 30 percent of children aged one to four years in rural areas of southern regions (1). In contrast, the overall prevalence of overweight status has risen in school children of the northern and central regions (2).
Recently, many countries have assessed overweight status in children and adolescents based on the body mass index (BMI), which is classified as high or low compared to normal ranges for a given sex and age, according to national or international standard references. Likewise, BMI has been used to assess thinness (low BMI for a given age) with specific references and cutoff points (3-6). In 2007, the WHO recommended a new growth reference chart for school aged children (aged 5-19 y) (3). Previously, in 2000, the IOTF had published reference tables based on BMI, age, and sex to define overweight and obesity classifications (4). In 2007, IOTF released complementary reference data to define thinness (5). In 2000, the CDC recommended new growth charts for US children aged ≥ 2 y (6); these continue to be used in some developing countries (7, 8). The use of three references (WHO, IOTF, and CDC charts) may generate different prevalence rates of overweight status in preschool and school aged children, which implies that they are not necessarily equivalent.
Studies in school-aged children have rarely compared different prevalences of thinness estimated with WHO, IOTF, and CDC references. A recent review and meta-analysis only compared the prevalence of overweight and obesity in children among those references (9). In particular, some countries, like Mexico, have broad socioeconomic, geographic and ethnic diversities; thus, it is important to test the estimations derived from these three references to determine whether they are adequate for use in public health policies. The IOTF has been reported to produce a lower rate of overweight children than that estimated with CDC reference (9, 10). This suggested that the prevalences of overweight and thinness in children may be underestimated or overestimated compared to the latest WHO reference.
Thus, this study aimed to determine whether the WHO reference might produce different estimates of thinness and overweight prevalences compared to the IOTF and CDC charts. We studied school aged children within four geographic regions and different ethnic groups in Mexico. The study assessed the BMI in Mexican children aged 7.0 -9.9 y, and determined the prevalence of overweight and thinness according to the WHO, IOTF, and CDC references.
This study was conducted according to the guidelines laid down by the Declaration of Helsinki; the Ethical Committee of the (Centro de Investigación en Alimentación y Desarrollo, A.C), approved all procedures involving human subjects. Written, informed consent was obtained from all subjects and/or their parents. Only there were included children who agreed to participate in the study and those without physical disabilities. This study was adapted from the cross-sectional protocol proposed by the European Childhood Obesity Group (11). We assessed 1,731 children, aged 7.0-9.9 y during 2006–2008. This age range was chosen for practical and physiological reasons. At this age, schooling is usually obligatory; thus, confounding factors, like variations in the age of puberty, did not affect selection.
We analyzed data from the main geographic and socioeconomic areas of Mexico (northern, central, and southern regions) (12). The term “indigenous” was defined as a community with a strong cultural identity that spoke a language different from Spanish. The term “ethnic group” could be applied to either an indigenous or nonindigenous population (13). Each geographic area comprised two states that represented the majority of two indigenous populations. The states were Sonora and Chihuahua (north), Puebla and Hidalgo (central), and Chiapas and Yucatan (south). Due to its population and its unique demographic and socioeconomic conditions, Mexico City (District of Coyoacan) was considered a separate region (14).
In each state, we selected municipalities with indigenous people that comprised at least 40% of the population. We studied six indigenous populations, including Mayo and Tarahumaras (north); Nahuas-Otomies (central), and Mayas and Tzotziles (south). Near the municipalities with high proportions (40%) of indigenous populations, we selected a second group of municipalities with populations that predominantly comprised non-indigenous Mexican people. These included capital cities and other towns. A total of 308 municipalities (80 with high proportions of indigenous people) were considered for the study.
After selection of geographic areas and municipalities, in each region, a probability proportionate to size, multistage cluster sampling method was used to select the participants. The sample size was determined based on census data obtained from the Ministry of Education, which indicated 567,106 children aged 7.0-9.9 years enrolled in the schools of selected areas. The overall prevalence of obesity was estimated to be 15% (11) with a 95% confidence level and an error of ± 4%. The rate of homogeneity was set at 0.02 for proportions of illness in general. For the present study, the cluster size was set at a minimum of 45 subjects per day. Each cluster corresponded to one school, and there were 39 schools (sampling units); this gave a total sample of 1,755 children. The municipalities were stratified by the proportion of indigenous or non-indigenous populations. Depending on the size of the schools and the age group, classrooms were randomly selected to form the clusters. The selection of subjects in each cluster was performed with random sampling. Random numbers were generated using Excel. Ethnicity was confirmed with the schoolteachers and the children’s parents. We finally assessed 1,731 children from different regions and ethnic groups of Mexico. Twenty-four children were excluded because of missing values.
The anthropometric assessment was conducted from 07:30 to 10:30 AM in a classroom, library, or other suitable area. In each state, two trained technicians made all measurements according to standardized techniques (15). Height was measured with a stadiometer (Seca 225; Seca, Hamburg, Germany). Body weight was measured with a digital electronic scale (Seca 882; Seca). The technical error of measurement was 0.11 g for body weight and 0.12 cm for height, assessed as described by de Onis et al (15).
Statistical analysis was performed with the statistical program NCSS 8 (NCSS 2012, LLC. Kaysville, Utah, USA). Characteristics of subjects were reported as the mean and standard deviation (SD). Prevalence data were expressed as percentages with a 95% confidence interval (95% CI). Both thinness and overweight status (obesity included) between indigenous and nonindigenous children were compared with a Chisquared test. BMI was calculated as the ratio of weight to height squared (kg/m2). Z scores of BMI for age were computed for all children with WHO AthroPlus software (16). Percentiles of BMI for age were calculated with CDC Epi Info, Version 6 software (17). BMIs that corresponded to the adult cutoff points were calculated with the IOTF LmsGrowth software (18). We used equivalent classifications to compare the three references, defined as thinness and overweight (obesity included). For school aged children, according to the WHO reference, thinness was defined as < -2 Z score from the mean value of the reference population. The IOTF criteria defined thinness (level 1) as a BMI < 18.5 kg/m2. The CDC reference classified underweight as a BMI for age below the 5th percentile of the reference population. Overweight was defined by the WHO as > 1 Z score and obesity was defined as > 2 Z score from the mean value of the reference population. The IOTF criterion defined overweight as > 25 kg/m2 and obesity as > 30 kg/m2. The CDC classified risk of overweight as ≥ 85th percentile and overweight as ≥ 95th percentile of the reference population. Crosstabs test for related samples was used for differences between the three matched sets of frequencies.
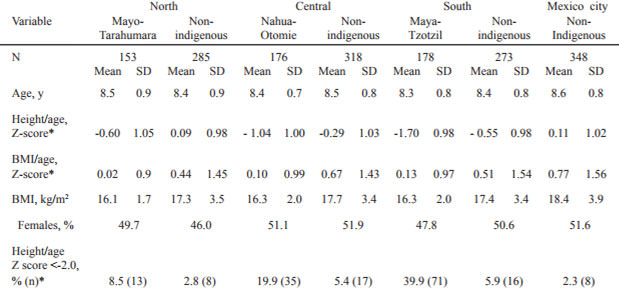
Descriptive data (Table 1) showed that, with the WHO reference, the mean height for age Z score was < -1.0 in indigenous children from southern and central regions. In general, the rates of stunting (height for age Z score < -2.0) were higher in indigenous children than in nonindigenous children (22.8% vs. 4.1%). The mean BMI for age Z score was above the median (>0; WHO reference) in all ethnic groups.
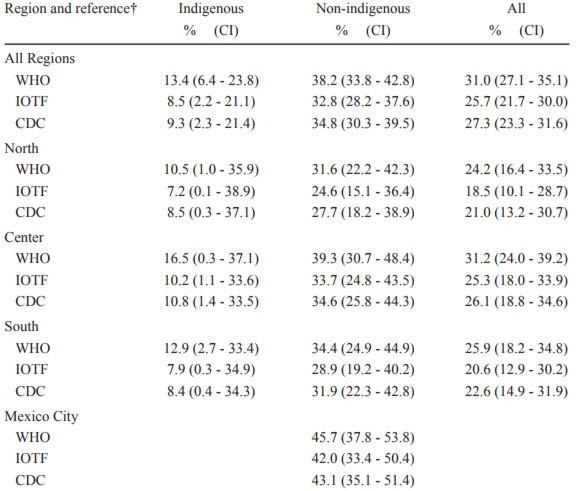
Overall, the highest rates of thinness and obese children were generated with the WHO reference in both ethnic groups across all regions (p < 0.05; Tables 2 and 3). The largest difference between assessments of thinness was observed with the WHO and CDC references, in both indigenous and non-indigenous children (4% and 8.2%, respectively). The largest difference between overweight assessments was observed with the WHO and IOTF references, in both indigenous and non-indigenous children (4.9% and 5.4%, respectively). Therefore, the lowest prevalence of thinness in children was estimated with the CDC reference (p < 0.05). On the other hand, the lowest prevalence of overweight children was estimated with the IOTF reference.
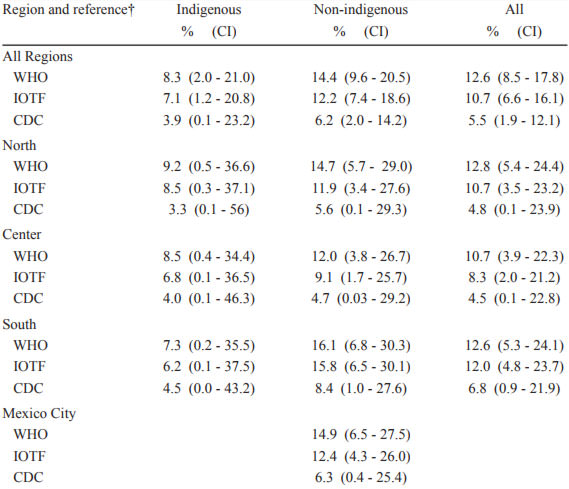
Based on the WHO growth reference, both thinness and overweight status were more prevalent among non-indigenous than among indigenous children (thinness: non-indigenous 14.4%, indigenous 8.3%; p < 0.001; overweight: non-indigenous 38.2%, indigenous 13.4%; p < 0.001; Tables 2 and 3).
This study showed that the WHO BMI for age reference estimated higher rates of thinness and overweight status than IOTF and CDC charts between 1,731 indigenous and non-indigenous from different geographic regions.
Few studies have compared other references with the WHO reference for estimating thinness in school children from developing countries. It has been reported that the WHO reference estimated higher rates of low BMI for age than either the CDC (7, 10) or IOTF reference in children of Seychelles (19). Even compared with weight for height NCHS (National Center for Health Statistics) reference, the WHO BMI for age yielded twice the rate of thinness in 11 low income countries (7). In the present study, we found that indigenous children had low rates of underweight status compared to non-indigenous children (BMI for age < -2 Z score: 8.3% vs.14.4%, respectively). This prevalence was similar to that reported for children in Burkina Faso (8.7%) and Mali (8.6%) (7). For centuries, regions with large indigenous populations have had the worst socioeconomic, educational, and health conditions in Mexico. Therefore, it might be expected to find that indigenous children would have the highest rates of low BMI for age. To stablish the clinical implication about using one or the other standard of reference, it is necessary to evaluate in prospective studies children that are thin, but not wasted, compared to those that are both thin and wasted (7). BMI differences among thin children can be due to differences in body composition. Therefore, BMI values among children should be interpreted with caution (20). In Mexico, like other countries, the use of thinness as an indicator of undernutrition status in children is relatively new. In addition, the use of terms like “wasting” (low weight for height) and “underweight” (low weight for age) should not be confused by adopting the term “thinness” (low body mass index for age) (21).
As have other researchers, WHO reference yielded the highest rates of overweight status in children from developing and developed. In children from Nigeria, Canada, and the Czech Republic, the WHO reference produced the highest estimates of overweight status when compared to either CDC or IOTF references. In those studies, the prevalences of overweight children were different by 8.6% to 1%, when comparing WHO and CDC references (8, 22) and by 10.7% to 3.9%, when comparing WHO and IOTF references (8,23). In addition, the IOTF criteria always produced the lowest rates of overweight status. However, few studies have reported interethnic comparisons within a single country. We observed the greatest differences in overweight prevalence between WHO and IOTF in non-indigenous children (5.4%). Cut offs for overweight and obesity were analyzed separately, and in all cases (data not shown), the direction of the estimates were similar when comparing the three references for different regions or different ethnic groups (indigenous or non-indigenous children). Previous evidence indicated that the prevalence of overweight children varied according to region in Mexico (24, 25). However, that data was not consistent, because different references were used in different studies. The National Health Survey (ENSANUT) in Mexico and other research groups adopted the IOTF reference in 2006 and retained the CDC reference to assess stunting (24). A recent review and metaanalysis of the role of standard references suggest that a given reference may be more suitable for one country than others. The IOTF reference is used by researchers and policy makers for descriptive and comparative purposes. The 2000 CDC Growth Charts, and the WHO charts are used for clinical use in monitoring children’s growth (9).
The differences in the prevalence of thinness and overweight estimates made with different references may have arisen due to differences in the datasets, smoothing methods, and analytical approaches (3, 5, 6). Although the WHO and IOTF references may be more useful than the CDC reference for international comparisons, it is uncertain whether their cut-off points are appropriate in non-represented countries. IOTF used Brazil to represent Latino children, but Brazil is probably the least representative of the ethnic diversity found in Latin America. Nevertheless, any country would not be the perfect representation of the region.
When the IOTF and CDC databases and cutoffs were used to detect overweight status and obesity in Swiss children, the IOTF system showed lower sensitivity, but higher specificity, than the CDC reference (26). According to Cole et al (27), the IOTF obesity cutoffs had lower sensitivity (and high specificity) than the CDC cutoffs, because the cutoffs were closer to the high extreme of the distribution, which logically led to a lower prevalence of obesity. There are no well-established BMI cutoffs for assessing thinness in school children. Nevertheless, WHO and IOTF references have proposed different categories for evaluating thinness. The WHO reference defines thinness as < -2 Z score and severe thinness as <-3 Z score; the IOTF criteria defines thinness level 1 as < 18.5 kg/m2, thinness level 2 as < 17 kg/m2, and thinness level 3 as < 16 kg/m2. Further studies are necessary to clarify the health significance of the different definitions of underweight status proposed by the WHO and IOTF references.
It may be that, in Mexico, the adoption of the WHO reference for research could increase the prevalence of overweight and thinness, which may prematurely alarm the national health system. Evidence shows that the WHO reference produced higher rates of overweight and thinness than native growth charts (23). This was exemplified in a study in Hong Kong, which suggested that it was necessary to retain local references to prevent overdiagnosis and a probable increase in clinical workload (28). If the WHO 2007 reference were applied in China, there would be increases in the prevalence of short stature and underweight status, and 5.8 million additional children would be diagnosed as affected with both conditions (28). The CDC and IOTF references have been the most widely used in Mexico, but no standardized reference has been adopted. Since indigenous population represents almost twelve million people, the current inclusion of indigenous children in the national nutrition surveys could produce a misleading interpretation of the overall prevalence of overweight and underweight status; therefore, one of the most important issues in Mexico is to provide the best data reference system and the highest possible consistency over time for proper evaluations of nutritional status and intervention programs. We recommend that future studies analyze the prevalence of thinness and obesity using the WHO and IOTF references. Because thinness as indicator of undernutrition status in children is relatively new, differences in body composition among indigenous and nonindigenous children may justify the need for more appropriate screening criteria to compare the growth status. Future studies should clarify the health significance of the different categories of underweight and overweight status in both ethnic groups. In addition, further studies are necessary to test the sensitivity and specificity of the growth references regarding ethnicity and biomarkers.
In this study, different municipalities represented different geographic regions and different ethnic groups in Mexico. However, the sample was not representative of the school children, regions, or indigenous groups for all of Mexico. In addition, due to logistic constraints, information about the socioeconomic status of the families was not included. This study did provide new information about the importance of considering the reference criteria, the classification systems, the ethnicity, and the environments in a sample when reporting the overall prevalence of thinness and overweight status in children.
In conclusion, the WHO BMI for age reference generated higher rates of overweight and thinness than those found with the CDC and IOTF charts indigenous and non-indigenous school aged children from different regions and ethnic groups in Mexico. The IOTF reference generated the lowest prevalence of overweight status and the CDC reference generated the lowest prevalence of underweight status. Care must be taken when the WHO reference is used to estimate the growth status in indigenous and non-indigenous Mexican school children.
This work was supported by a grant from CONACyT Convocatoria Salud (grant number 2003-C01-56) awarded to MEV, and by a PhD scholarship awarded to ER from CONACyT. We gratefully acknowledge all participating children and their parents for their collaboration. We thank José A. Ponce, Alma Robles, and Isabel Gardea for their technical assistance and Alfonso Gardea for logistical support and to José Carlos Valenzuela for edition and corrections to the manuscript. We also acknowledge the Federal Ministries of Education /Secretaría de Educación Pública and/or Secretaría de Educación y Cultura from the States of Sonora, Chihuahua, Hidalgo, Puebla, Distrito Federal, Chiapas, and Yucatan for facilitating access to the families. We also thank the Ethical Committee of the Centro de Investigación en Alimentación y Desarrollo, A.C.
Recibido: 02-02-2017
Aceptado: 19-04-2017