
Patterns of water consumption among children and adolescents are not widely analyzed. The aim of the study is to assess predictors (including dietary habits, anthropometric and physical activity frequency) of water consumption in Mexican children and adolescents. The NutriRun is an International study started in 2011. Subjects’ anthropometrics, health status and behaviours were assessed during the race Carrera Kinder Generación en Movimiento, which has taken place in Mexico City every April between 2011 and 2013. The analysis of factors associated with water consumption showed that, age (p-value 0.025), male gender (p-vale 0.011), to be overweight/obese (p-value 0.013) and beverages consumption (p-value 0.014) were significant predictors of water intake. Particularly, age, male gender and weight status were found to be in a positive relationship with water intake, while a higher level of beverages consumption was a predictor of lower levels of water intake. These findings might be taken into account in the development of public health policies targeting on increasing water consumption (which has been demonstrated to have beneficial effects on health) among kids and their families.
Key words: Children, obesity, water consumption.
Los patrones de consumo de agua entre los niños y adolescentes no se han analizado ampliamente. El objetivo del estudio consiste en evaluar las tendencias y los factores predictivos (incluyendo hábitos dietéticos, antropométricos y frecuencia de la actividad física) de consumo de agua en niños y adolescentes mexicanos. El Nutri Run es un estudio internacional iniciado en 2011. La antropometría, el estado de salud y el comportamientos, fueron evaluados durante la Carrera Kinder Generación en Movimiento, que ha tenido lugar en la Ciudad de México cada mes de abril entre 2011 y 2013. El análisis de los factores asociados con el consumo de agua mostró que la edad (p-valor de 0,025), el sexo masculino (p-valor de 0,011), para estar en sobrepeso/obeso (p-valor de 0,013) y consumo de bebidas (p-valor de 0,014) fueron predictores significativos de la ingesta de agua. En particular, se encontró que la edad, el sexo masculino y el peso estaba en una relación positiva con la ingesta de agua, mientras que un mayor nivel de consumo de bebidas estaba un predictor de los niveles más bajos de consumo de agua. Estos resultados podrían ser tenidos en cuenta en el desarrollo de políticas de salud pública dirigidas a aumentar el consumo de agua (que se ha demostrado que tienen efectos beneficiosos sobre la salud) entre los niños y sus familias.
Palabras clave: Niños, obesidad, consumo de agua.
Unit of Biostatistics, Epidemiology and Public Health, Department of Cardiac, Thoracic and Vascular Sciences, University of Padova, Italy. LACE Consulting Group, Mexico City, Mexico.
Water has beneficial effects on health, since it plays a crucial role for the maintenance of a proper fluid balance and for the control of body temperature (1). Dehydration has detrimental effects on health status, resulting in impaired physical and cognitive functions (it has been demonstrated that increased water consumption is associated with better cognitive performance in children and adolescents (2-4), constipation, headache (5), skin dryness, impairment of kidney and hemodynamic functions (particularly in the case of severe dehydration) (1). Additionally, it has been shown that water consumption influences dietary patterns: higher water consumption seems to be associated with reduced caloric intake (6, 7).
Despite the fact that water consumption is demonstrated to have beneficial effects, several studies (8-10) have shown that water intake, in children and adolescents, is inadequate (according to national and international recommendations). The National Health and Nutrition Examination Survey (NHANES) (8), examining the trend of beverages consumption in children between 4 and 13 years, showed that levels of water consumption were below the recommendations provided by the Institute of Medicine (IOM) (11). Consistently with the results provided from the analyses conducted on U.S. kids, the Mexican National Health and Nutrition Survey (NHNS) (9) demonstrated that water consumption also among Mexican children and adolescents (1-18 years of age) was below the Dietary Reference Intake (DRI) provided by IOM (11). Additionally, an analysis of drinking habits among Mexican children demonstrated that the beverages most frequently consumed were whole milk, sodas and fruit juices (10).
Analyzing trends and predictors of water consumption is crucial in order to identify modifiable factors influencing patterns of beverages consumption and developing public health policies targeted on these modifiable predictors, implementing water consumption in pediatric age. However, this field is not widely analyzed and only few studies have assessed the association between environmental, psychological and behavioral factors with levels of water consumption in children. The NHANES survey showed that predictors of water intake in children and adolescents differed by age group (12). An analysis conducted on adolescents living in Florida reported that low water intake was influenced by soft drinks and snacks consumption during TV watching (13). According with these findings, a study conducted on U.S. adolescents demonstrated that low levels of water consumption were associated with inadequate eating habits(14).
The aim of the study is to analyze predictors (including dietary habits, anthropometric and physical activity frequency) of water consumption in Mexican children and adolescents participating to a yearly sporting event held in Mexico City: the Carrera Kinder Generación en Movimiento.
The NutriRun is an International study started in 2011. The aim of the study was to assess dietary habits and behaviours of Mexican children/adolescents (1-18 years of age) and their families, evaluating the effect of lifestyle on kids’ health outcomes, referring, particularly, to the risk of developing obesity in paediatric age.
Subjects’ anthropometrics, health status and behaviours were assessed during the race Carrera Kinder Generación en Movimiento. The race has taken place in Mexico City every April between 2011 and 2013. Children/adolescents and one of their parents run together on one of the three proposed distances (1, 2 and 4 kilometers), according to the age of participants. The event aimed to strength the relationships among family’s members and to promote physical activity, as a healthy and fun activity, at early age among Mexican families. It was open to children over 5 years and, after the race, participants, as well as spectators (or non-participants), were invited to participate, voluntarily, to different laboratories promoting healthy lifestyles. One of these laboratories was represented by a nutritional consultation, during which parents were asked to complete a medicaldietetic questionnaire, while children/adolescents were weighed and measured.
The medical-dietetic questionnaire was built on 3 main sections aimed at evaluating participants’ health status, dietary habits and physical activity.
At first, child/adolescent and family’s medical history was assessed, asking particularly if the child/adolescent and someone of the family members (e.g. parents, siblings or grandparents) suffered of any chronic disease and if the child/adolescent has suffered recently from a gastrointestinal illness (nausea, vomiting, diarrhoea, lack of appetite).
The second section aimed at evaluating children and adolescents’ dietary patterns (number of meals per day, number of glass of water per day, food allergies, hated and favourite food and snacking habits). Additionally, parents were asked to report what their son/daughter usually ate at mealtimes (breakfast, lunch, snack time and dinner).
In the third part, parents were asked if the child/adolescent did physical activity, what type, how often and how long.
Children/adolescents were weighed and measured by certified nutritionists. TANITA BC-533 was used to weight the children and the stadiometer employed to measure the height was a floor based one, SECA model 213.Both the scale and the stadiometer were placed on a flat, horizontal solid surface and the stadiometer was placed in order to form a 90° angle with the floor surface.
The weight was measured by placing the child/adolescent in a central and symmetrical position on the scale platform with the palms of hands extended laterally and he/she was asked to stay still in order to avoid oscillations in the weight reading.
Height’s measurement was taken checking that the midline of the child/adolescent body matched the midline of the stadiometer. The arms were hanging freely and naturally throughout the body. The nutritionist being in front of the subject, placed both hands on the lower border of the mandible, exerting a minimum traction upward, as wanted to stretch the neck to guide the head to the Frankfort plane. Then the nutritionist lowered the squad of the stadiometer until it rested on the head of the subject and performed the reading. Anthropometric measures were performed with participants wearing light clothes and barefoot.
Body Mass Index (BMI) was calculated as weight (kg) divided by height (m) squared. Children/Adolescents were considered to be overweight/obese with a BMI ≥85th and underweight with a BMI <5th, according to CDC growth standards (15).
In order to understand if dietary habits significantly influence water consumption, foods that children/adolescents were reported to eat at mealtimes (breakfast, lunch, dinner and snacking occasions) were grouped in four main categories: Fruits & Vegetables, Grains & Tubers, Animal Source Food & Legumes, Fats &Sweets.
The food grouping procedure was performed using the Sistema Mexicano de Alimentos Equivalentes (16). The classification depends on the main nutrients carried out by the food included in every group: Fruits & Vegetables provide vitamins and minerals; Grains & Tubers carry out carbohydrates and vitamins; Animal Source Food & Legumes bring proteins.
Once food was classified, the number of servings per day for each food group (Fruits & Vegetables, Grains & Tubers, Animal Source Food & Legumes, Fats & Sweets) was calculated.
Beverages were considered separately from food by identifying a separate group including all types of beverages (the, coffee, soft drinks, aguafresca, -both homemade and industrial, beverage made of water, fruits, sugars and sometimes grains-, licuados-a typical Mexican beverage made of fruit and milk, sometimes added with sugar, honey, oat or ice-) that children/adolescents had through the day, except to water. We considered the amount of beverages drunk per day.
Water consumption was reported as glasses of water per day, a glass corresponded to 240 ml of water.
Continuous variables were expressed as median (I° and III° quartiles) and categorical variables were reported as percentages (absolute number). Fisher exact test and Chi-squared test were performed as appropriate.
To assess the impact of anthropometric, dietary habits and physical activity on water consumption, a multi-level model was estimated, considering the year in which data were collected as grouping variable. In order to take into account the fact that participants were of different age (from 1 to 18 years of age), corresponding to different needs of water intake (11), in the multilevel model, the age, categorized in classes (1-3; 4-8; 9-13; 14-18), was included on the slope, accounting for age heterogeneity.
Analyses were performed using R system (17) and rms(18), lme4 (19) packages.
Subjects enrolled in the study were 1081 (299 in 2011, 364 in 2012 and 418 in 2013). Demographic characteristics (age and gender) of participants were similar in the three considered years: the median age was 8 years old each year and gender was balanced. However, the weight status resulted to be significant different (p-value <0.001) between 2011, 2012 and 2013: in 2011 more children/adolescents were overweight/obese (28%), compared to the subsequent years (21% in 2012 and 22% in 2013), in which the proportion of normal-weights was higher than 2011 (58% in 2011, 72% in 2012 and 74% in 2013). Referring to dietary habits, no significant differences were found except to the daily number of servings of Fats & Sweets (p-value 0.022), of Grains & Tubers (pvalue 0.043) and the number of glasses of water per day (p-value <0.001). In 2012 participants enrolled in the study ate more often food items from the Fats & Sweets group and drank less glasses of water compared to 2011 and 2013 (Table 1).
![TABLE 1. Subject’s characteristics according to NutriRun year. Continuous variables are median [i° and iii° quartiles], categorical variables are percentages (absolute numbers).](1.jpg)
Since the need of water intake differs by age group (11), levels of water consumption in the 3 considered years were analyzed according to different age groups (Table 2). We found out that the levels of water consumption by age class were significantly different in 2011, 2012 and 2013, with prescholars (1-3 years of age) drinking significantly more water in 2013 compared to the previous 2 years and older children and adolescents drinking less glasses of water in 2012 compared to 2011 and 2013.
![TABLE 2. Water intake (reported as glasses of water/day) in different age classes, according to NutriRun year. Data are median [I° and III° quartiles].](2.jpg)
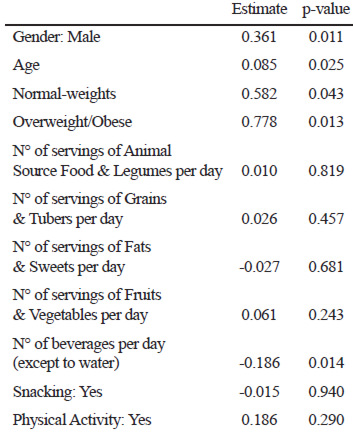
The multi-level model (Table 3) showed that, among the considered factors, those that were significantly associated with water consumption were: age (p-value 0.025), male gender (p-vale 0.011), weight status (overweight/obese: p-value 0.013, normal-weights: p-value 0.043) and beverages consumption (p-value 0.014). Particularly, age, male gender and weight status were found to be in a positive relationship with water intake, while a higher level of beverages consumption was predictor of lower levels of water intake.
The aim of our study was to assess trends and predictors of water consumption among Mexican children and adolescents, since this field has not been widely explored yet.
Participants were enrolled in 3 consecutive years (2011, 2012 and 2013), during a non competitive race that has taken place in Mexico City, and certified nutritionists assessed their health status, eating habits and behaviours.
Water consumption resulted to be significantly different in the 3 considered years, with children/adolescents enrolled in 2012 found to drink less glasses of water compared to 2011 and 2013. However, it’s difficult to compare trends of water consumption between different studies, given different ways to express the amount of water drunk (in glass per days or per week, in ml per days or per week, water volume/kcal), differences in the age of the sample enrolled, differences in the definition of water consumption (it could include only water or also water intake provided from food). Comparing our results with data from NAHNES (8) and NHNS (9) surveys (conducted, respectively, on U.S. and Mexican youths), children and adolescents enrolled in the present study seem to drink higher levels of water. This could be related to different characteristics of the participants included; since they were enrolled during a sporty event (consequently they could be more prone to adopt healthy behaviours). However, this could also be related to the fact that data were collected during the nutritional consultation and participants enrolled might tend to report higher levels of water consumption compared to the real ones (desirability bias).
Contributors of water consumption in children and adolescents are not widely analysed. The model estimation showed that few factors are significant predictors of levels of water intake (age, gender, weight status and beverages consumption). Age resulted to be positively associated with water consumption since children of higher age reported higher levels of water intake, according to the fact that hydration needing differs by age group and, particularly, increased with age (11). The fact that beverages consumption (the, coffee, soft drinks, aguafresca, licuados, milk and fruit juices) predicted lower water intake is consistent with previous studies: the National Youth Physical Activity and Nutrition Study (NYPANS) (14) demonstrated that, adolescents reporting inadequate eating habits were more likely to drink low levels of water; the Florida Youth Physical Activity and Nutrition Survey (YPANS) (13) showed that soft drinks and snack consumption during TV watching was a contributor of low water intake. Referring to the weight status, the present study found out that to be overweight/obese is a significant predictor of higher water consumption, this finding is consistent with the results of NYPANS, showing that obese youth had an OR of 0.7 for low water intake. This probably because, as it has been demonstrated by a recent literature review about the effect of water intake on weight status of children and adolescents (20), cross-sectional studies (as in that case) reported that obese subjects drink more water compared to normal-weights, even if longitudinal studies suggest that water consumption contributes to the reduction of body weight.
Weight status, beverages consumption, male gender and age were found to be significant contributors to the level of water intake in Mexican children and adolescents. In recent years, Mexican government has adopted (in order to reduce energy dense food intake, preventing overweight and obesity) strategies for reducing the consumption of soft drinks: raising prices (taxes policy) and regulating the distribution in schools. Still, one of the great challenges is to make drinkable water widely available, especially in public schools, and to reinforce water consumption at home. Our findings might be taken into account in the development of effective public health policies targeting on improving water consumption, which has been demonstrated to have beneficial effects on health, among kids and their families.
The work has been partially supported by an unrestricted grant from the Italian Ministry of Foreign Affairs under the programs “Programmi di alta rilevanza scientifica e tecnologica” Italia-Messico and Italia-Argentina, and from Prochild ONLUS (Italy).