
Body mass index (BMI) is considered a good predictor of overall adiposity, with significant sensitivities in identifying overweight children. Recently, it has been suggested that other anthropometric measures may also be employed as adequate surrogates for imaging techniques and BMI. However, it is well known that differences exist in body fat distribution among different ethnicities. The present study aims at assessing the relationship between anthropometric measures in children from different geographical regions. The OBEY-AD is an international study enrolling 2720 children (3-11 years of age), balanced by gender. Children underwent anthropometric assessment. The association between these anthropometric measures was estimated using linear mixed models. South-American children had a higher BMI and waist and hip circumference compared to European and Indian ones. Conversely, Indian children were found to be taller and to have a higher waisthip ratio than those of European and South-American kids, suggesting a different body composition of Indian children compared to those of the other ethnic groups. Overall, this data provides further evidence on the differences in anthropometric measures between the Indian, South American and European child populations.
Key words: Children, Body-Mass Index, Waist-Hip Ratio, Waist-to-Height Ratio, Ethnic Group.
El índice de masa corporal (IMC) es considerado un buen indicador de adiposidad general, con una capacidad significativa para la identificación de niños con sobrepeso. Recientemente, se ha sugerido que también es posible utilizar otras medidas antropométricas como sustitutos adecuados de las técnicas de diagnóstico por imagen y del IMC. Sin embargo, es bien sabido que existen diferencias en la distribución de la grasa corporal entre diferentes grupos étnicos. El objetivo del presente estudio es evaluar la relación entre las medidas antropométricas en niños de diferentes regiones geográficas. El OBEYAD es un estudio internacional que incluyó a 2720 niños (de entre 3 y 11 años de edad), equilibrados por sexo. A los niños se les realizó una evaluación antropométrica. Se realizó la estimación de la asociación entre estas medidas antropométricas por medio de modelos lineales mixtos.
Los niños de América del Sur tuvieron valores más altos de IMC, circunferencia de cintura y cadera, en comparación con los resultados de los niños europeos e hindúes. Por el contrario, se encontró que los niños de la India tenían una mayor estatura y una relación cintura-cadera mayor que la de los niños europeos y sudamericanos, lo que sugiere la existencia de una composición corporal diferente en los niños hindúes respecto de los de los otros grupos étnicos. Este hallazgo fue confirmado asimismo en el modelo lineal. En general, estos datos proporcionan evidencia adicional sobre las diferencias en las medidas antropométricas entre la población infantil de la India, de América del Sur y de Europa.
Palabras clave: Niños; Índice de Masa Corporal; Relación cintura-cadera; Proporción cintura- talla; Grupo étnico.
Faculty of Medicine, Imperial College London, United Kingdom. Unit of Biostatistics, Epidemiology and Public Health, Department of Cardiac, Thoracic and Vascular Sciences, University of Padova, Italy.
Childhood obesity is now an established pandemic in developed countries, with almost a quarter of children and adolescents being reported as obese in 2013(1). It is also a growing burden for newly industrialized countries as its incidence in these nations has been rising steadily since 1980(1). This is a highly concerning fact for families and medical professionals around the world. Overweight children are prone to several metabolic and orthopedic disorders in childhood (2), and obesity in early life is associated with adverse cardiovascular risk factors and an increased prevalence of coronary artery disease in adulthood (1-3). Obesity has been reported also to have a severely detrimental effect on social interactions (4), as well as a negative impact on educational and financial achievements (5). Early clinical and behavioral interventions can prevent these complications, emphasizing the need for reliable measures to identify promptly affected individuals.
-ray imaging techniques have been regarded generally as the most accurate measures of adiposity, and are often used as gold standard for fat mass assessment in research (6,7). For example, dual x-ray absorptiometry (DXA) is a reliable indicator of cardio-metabolic risk factors, such as visceral adipose tissue (8). Unfortunately, this technique is expensive, lengthy to carry out and impractical for routine clinical measurements.
Anthropometric measures are therefore more frequently used in the clinical setting. Body mass index (BMI) is generally regarded as a good predictor of overall adiposity (9), with significant sensitivities in identifying overweight children (6). Other measures, such as waist circumference, waist-to-height ratio and subscapular/triceps skinfolds, have also been shown to strongly correlate with DXA adiposity measurements (9-11), and have been proposed as adequate surrogates for imaging techniques and BMI.
Nevertheless, metabolism and body fat distributions vary between populations, so are these measures and their parameters applicable to all countries around the world? A number of studies have found positive and comparable associations between BMI, waist circumference and skinfolds in children from Western Europe (12-14), India (15, 16) and Brazil (17, 18). Research has also shown that, in certain populations, combinations of anthropometric measures can give a better overall picture of a child’s weight status than individual parameters alone (17, 19). However, these associations are not universal. Reilly et al. found significant differences between the specificity and sensitivity of BMI and waist circumference measurements in British 9-10 year old (20). In two studies carried out in Brazil and the Netherlands, associations between BMI and skinfold were only found in individuals ranked at high percentiles (21, 22), while in other countries they were identified at all risk levels. Finally, Panjikkaran et al. stated that BMI and waist-to-height ratio were the most accurate combinations for Indian schoolchildren (23), while Hubert reported that waist circumference and BMI were consistently better in French youth (12).
It is therefore clear that differences exist in the association between anthropometric measures in different countries. Some measures, such as waist-hip ratio, have also been neglected in research, and there is a lack of data for certain measures due to their reduced clinical use in different healthcare systems around the world. These factors point towards a need for studies that can clarify the overall picture in anthropometric measure associations. Individual trials can be likened and analyzed, but differences in their methodology, accuracy and benchmarks can make reliable comparisons difficult.
Our study attempts to fill this knowledge gap in childhood obesity, by analyzing the relationship between anthropometric measurements (BMI, waist-hip ratio, waist-to-height ratio) in children from various regions in Europe, South America and India, providing insight into the geographical, ethnic and racial variations of childhood obesity.
The OBEY-AD is an international study consortium aimed at investigating risk factors for obesity in childhood. The study enrolled 2720 children (3-11 years of age), balanced by gender, in three main geographical areas: South America (Chile, Mexico, Argentina and Brazil), Europe (Georgia, France, United Kingdom, Germany and Italy) and India. Kids were recruited in school facilities of metropolitan area of the involved countries: Santiago (Chile), Buenos Aires (Argentina), Fortaleza (Brazil), San Luis Potosí (Mexico), Paris (France), New Delhi, Kolkata, Surat, Mumbai, Hyderabad, Bangalore, Chennai (India), London (United Kingdom), Hamburg (Germany), Tbilisi (Georgia), Trieste (Italy). Study’s detailed description is given elsewhere (24).
Children suffering of physical or psychological diseases were excluded from the sample. Informed consent was obtained by parents of participants explaining them study’s aims. The procedures performed followed the ethical guidelines of the American Psychological Association (APA). Adequate permissions were obtained by the Institutional Review Boards.
Children’s anthropometric measurements were performed (using a body meter and a balance scale) by trained technicians with kids wearing light clothes and barefoot. All the measurements were taken at the nearest 0.1 mm.
Weight and height were taken with children’s back against the wall, so that the feet’s back were against the wall too, forming a straight angle between the wall and the floor. A straight surface was then placed on the kid’s head to fix a mark on the wall, which represented the initial point. Body Mass Index (BMI) was computed as weight (in kilograms) divided by height (in meters) squared.
Waist circumference was measured midway between the lowest rib and the top of iliac crest. Waist-to-height ratio was calculated as waist circumference (in centimeters) divided by height (in centimeters).
Hip circumference was measured at the widest diameter of the buttocks. Waist-hip ratio was computed dividing waist circumference (in centimeters) by hip circumference (in centimeters).
The measure of abdominal skinfold was performed, and reported in millimeters, using Harpenden skinfold caliper by taking a fold of skin and subcutaneous fat midway between umbilicus and the spine of the iliac bone.
Categorical data were reported as percentages (absolute number), continuous data as median (I and III quartile). Wilcoxon-Kruskal-Wallis test and Pearson chi square test were performed whenever appropriate.
A linear mixed model has been estimated to take into account the heterogeneity in the considered sample; a fixed effect term has been included considering as explanatory covariates children’s gender, age and anthropometric measure. In addition, a random effect term has been included: the intercept of the linear effect varies according to the geographical area in which the children lived, the strength (random slope term) of the effect is shared among children with the same anthropometric measures
Statistical analysis was performed using R system (25) and lme4 (26), hmisc (27) libraries.
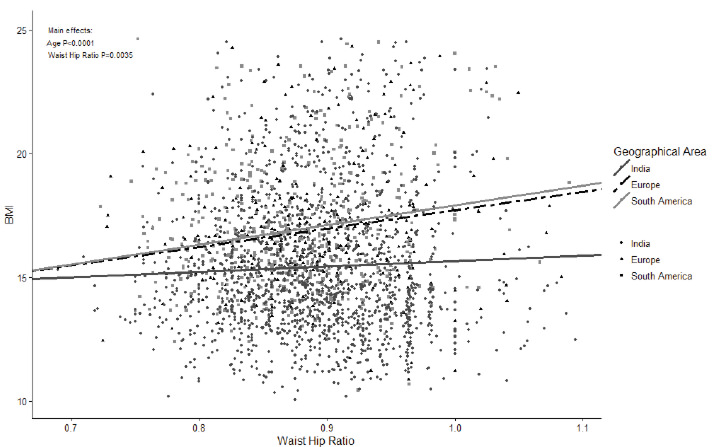
Sample characteristics by geographical area are shown in Table 1. We found out significant differences among the three groups of children for all the considered anthropometric measurements. South-American children had higher BMI, waist and hip circumference compared to European and Indian ones. Indian children were found to have lower BMI, waist and hip circumference, but they are taller and had a higher waist-hip ratio than those of European and South-American kids, indicating probably a different body composition of Indian children compared to those of other ethnic groups. This finding is confirmed also by the linear model depicted in Figure 1, showing that the BMI is highly associated with waist-hip ratio (p-value <0.0035) in all children’s groups but, for a given value of waist-hip ratio, the BMI of Indian children is lower than those of South-American and European ones. This observation is evident especially for higher values of waist-hip ratio, suggesting different body proportions for Indians. In addition to waist-hip ratio, also age, but not gender, is significant associated (p-value <0.001) to BMI.
![TABLE 1. Sample characteristics and anthropometric measurements according to geographical area. Data are percentages (absolute number) and median [I and III quartiles] whenever appropriate.](1.jpg)
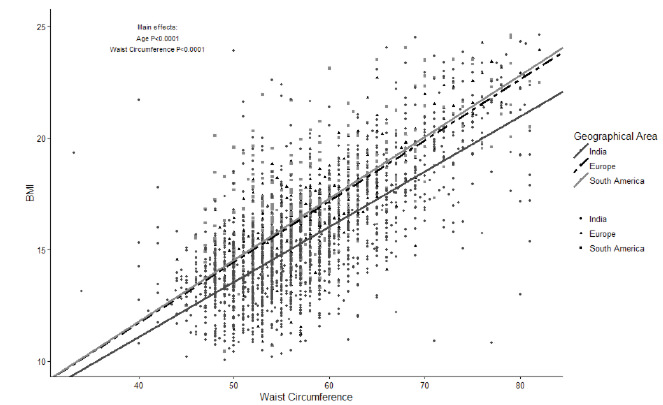
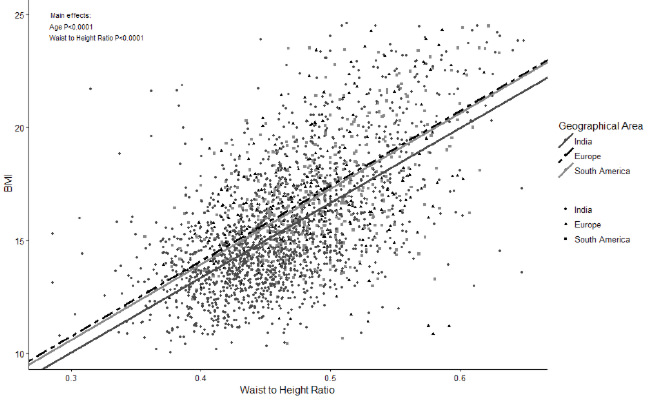
Referring to the relationship of BMI with the other anthropometric measurements, Figure 2 shows the significant association between BMI and waist circumference (p-value <0.0001) and Figure 3 reports a high association (p-value <0.0001) between BMI and waist-to-height ratio. Figure 3 shows that the strength of the association between BMI and waist-to-height ratio seems to be similar among the geographical areas considered (lines are parallel), while there is a difference in the intercept (magnitude) of the effect. In both cases (Figure 2 and 3), Indians had lower BMI for a given value of waist circumference and of waist-to-height ratio compared to children from the other geographical areas. Conversely, the relationships between BMI and waist circumference, and particularly those between BMI and waist-toheight ratio substantially overlapped for European and South-American children. Age, but not gender, had significant main effect in both models (p-value <0.0001 for both).
When observing the overall relationships between our measured variables, we see positive associations between BMI and waist circumference, waist-hip ratio and waist-to-height ratio in all three studied populations. This implies that a higher overall adiposity results in an increase of our measured parameters in all the three child subgroups, thus backing the use of anthropometric measures as surrogate markers of obesity. In addition, these associations have been reported by other studies looking at body fat distribution in Indian (19), Brazilian (17), German (13), French (12) and Italian (14) children, providing further evidence for our positive associations and the reliability and adaptability of these measures.
However, specific anthropometric patterns can also be seen relating to each studied population, and striking differences appear when comparisons between the subgroups are carried out.
When looking at the overall population differences, South American children were found to have the highest absolute weight, BMI, hip circumference, abdominal skinfold thickness and waist-to-height ratio amongst the studied groups, with statistical significance present for most of the aforementioned parameters. This suggests that on average South American children are larger compared to Indian and European children, probably due to a higher prevalence of obesity and greater levels of body fat in this continent. Certain Latin American nations have both the highest recorded prevalence of overweight preschool children and some of the fastest growing obesity rates in the developing world (28). Also, South American nations such as Brazil and Chile, have reported occurrence levels of childhood obesity comparable to those of several developed nations (29). Several causes have been suggested as the roots of this growing problem in the South American continent. These include a fast shift towards fat-rich foods with reductions in fiber in childhood diets (30, 31); nutritional stunting and fat oxidation due to widespread low socioeconomic status (32); and the growing availability of population-wide education, which has been associated with an increase in obesity in several developing nations (30, 33). Overall, we can clearly see our utilized measures have highlighted the striking obesity problem present in Latin America, emphasizing the need for the local authorities to tackle the causes of this pandemic and further elucidate the characteristics specific to their population.
Further interesting differences were seen also when characterizing the anthropometric data and measure patterns specific to each studied population.
The most particular arrangement was detected in the Indian group. In addition to being the tallest (greatest average height), this cohort also included the leanest individuals, as they reported the lowest BMI, waist and hip circumferences and waist-to-height ratio and abdominal skinfolds, with measurements for the latter being lower than those of other populations. This lower body weight was also reported by another study comparing anthropometric measures of South Asian children with those of other origins living in the UK (34), suggesting these parameters detect a lower prevalence of overweight individuals amongst Indian populations. However, despite this apparent low adiposity, our study recorded a high waist-hip ratio average for this cohort, greater than the measurements for the “bulkier” South American and European children. This can be clearly seen in Figures 1 to 3, where the Indian group has larger waist-hip ratios, waist circumferences and waist-to-height ratios at a specific BMI compared to the other populations. This implies that adiposity in Indian children tends to be more centrally located, with the waist being the major site of deposition, and at equal levels of body fat, these kids express wider waists compared to children from other geographical regions. This deposition pattern is further supported by adult studies comparing body fat composition of Asian Indians with other populations(35, 36), as they found that Indians were more prone than other ethnicities to deposit fat in the abdominal region, both viscerally and superficially. In addition, greater waist-hip ratios have been associated with higher levels of insulin resistance in Indian children(37), emphasizing the clinical relevance of this anthropometric pattern and providing a potential cause for the high prevalence of diabetes amongst the Asian Indian population(38). This data therefore suggests that a peri-waist fat deposition is prominent amongst Indian children, and that this body composition needs to be tackled to reduce the morbidity toll exerted by obesity and insulin resistance in this region.
On the other hand, a more evenly distributed pattern was detected for the South American cohort. These children had the lowest waist-hip ratios amongst the studied populations, accompanied by the highest hip circumference measures. They therefore don’t tend to express the same degree of pure central adiposity as Indian kids, as they were found to have narrower waists at a specific BMI compared to the other groups (Figures 1 and 2).
Finally, the European cohort generally occupied a middle ground in the anthropometric measures between the Indian and South American groups. However, their average values tended to be similar to the South American results, with many measures being only slightly lower. This can be explained by both the European origin for many South American populations and cultures, and the more developed status several Latin American countries possess compared to India. These cultural, socioeconomic and developmental similarities may therefore be the reason for the comparable results between the European and South American cohorts.
Despite reporting interesting anthropometric patterns and providing further evidence regarding fat deposition in several child populations, we need to take into account some limitations of our methodology. Firstly, the South American population reported a higher average age compared to the other two populations (7.0 versus 6.5 years). We found that BMI was positively associated with age, suggesting the other parameters may have also been raised due to this difference in the child groups. As a result, this may reduce the importance of the higher body fat and skinfold thickness measurements for the South American children. Secondly, it is important to remember that the different countries and ethnicities present in all three geographical populations are significantly heterogeneous. This is especially true for the continental cohorts, thus highlighting the broadly descriptive role this data plays.
However, these limitations are unlikely to have affected the individual anthropometric patterns detected in our study, such as the even fat distribution in the South American children and the prominent central adiposity in the Indian cohort.
Overall, this data provides further evidence on the differences in anthropometric measures between the Indian, South American and European child populations. It also highlights the importance of specific cutoffs and benchmarks for each ethnicity and culture, and how they can be used to tackle prominent health burdens such as cardiovascular disease and diabetes. Further studies now need to be carried out for the aforementioned regions to better clarify the anthropometric patterns specific to these populations, and attempt to understand the reasons, implications and applications of these variations in body fat composition.
The work has been partially supported by an unrestricted grant from the Italian Ministry of Foreign Affairs under the programs “Programmi di alta rilevanza scientifica e tecnologica” Italia-Messico and Italia-Argentina, and from Prochild ONLUS (Italy).