
The present study aimed at assessing the impact of food advertising on snack consumption in Chilean children using an experimental, ad libitum, design. Forty children were enrolled in urban, middle class, school setting. They underwent anthropometric assessment, brand awareness evaluation, and their lifestyle and habits were recorded through a validated questionnaire administered to their parents. A 5-arm design was adopted, consisting in the exposure to five different levels of TV spots and advertising. No significant differences were identified in caloric intake among children randomized to different levels of TV spots and commercials exposure. No significant effects on caloric intake, caloric intake per BMI, and or glycemic load were detected, even after adjustment for confounding factors. This study suggests the need for a better analysis of the contribution of non-traditional factors to obesity onset in children, which can provide high-quality evidence in order to develop effective public health strategies to face childhood obesity epidemic.
Key words: Children, food advertising, television, snack consumption, Chile.
El presente estudio tuvo como objetivo evaluar el impacto de la publicidad de alimentos en el consumo colaciones en los niños chilenos mediante la utilización de un diseño experimental basado en la voluntad de los participantes (ad libitum). Se realizó la inscripción de cuarenta niños en el contexto de una escuela urbana de clase media. Se les realizó una evaluación antropométrica, un examen de reconocimiento de marca y se procedió a registrar información sobre su estilo de vida y hábitos mediante un cuestionario validado que fue entregado a los padres y firmado por los mismos. Se adoptó un diseño de 5 grupos, que consistía en evaluar la exposición a cinco niveles diferentes de publicidad y clips televisivos. No se identificaron diferencias significativas en cuanto a la ingesta calórica entre los niños asignados aleatoriamente a diferentes niveles de exposición a clips televisivos y a anuncios publicitarios. No se detectaron efectos significativos en tanto a la ingesta calórica, ingesta calórica por IMC, o la carga glucémica, incluso después de realizar el ajuste por factores de confusión. El presente estudio sugiere la necesidad de un mayor análisis respecto de la incidencia de factores no tradicionales en la aparición de la obesidad en los niños, que proporcione evidencia de alta calidad con el fin de desarrollar estrategias eficaces en materia de salud pública ante la epidemia de obesidad infantil.
Palabras clave: Niños, publicidad de alimentos, televisión, consumo de colaciones, Chile.
Unit of Biostatistics, Epidemiology and Public Health, Department of Cardiac, Thoracic and Vascular Sciences, University of Padova, Italy. Don Bosco Congregación Salesiana, Concepción Chile. Department of Nutrition, University of Buenos Aires and Food and Diet Therapy Service, Acute General Hospital Juan A. Fernàndez, Buenos Aires, Argentina. Education department, Conferencia Episcopal de Chile. Faculty of Medicine, Imperial College London, United Kingdom.
Obesity prevalence in childhood has been rising worldwide (1, 2), both in developed and in newly industrialized countries.
Childhood obesity represents a severe public health burden given its well-known association with metabolic and cardiovascular impairments. Understanding factors associated with obesity in children is crucial, in order to implement public health policies addressing obesity contributors, reducing obesity (and its comorbidities) burden. Several predictors have been identified, and they are distinguished usually in modifiable and non-modifiable. Among non-modifiable ones, genetics play an important role in predicting obesity onset (3). Among modifiable predictors, different contributors have been identified, including: dietary patterns (4); behavioral factors (physical activity levels, sedentary behaviors (5), daily sleep hours (6)); perinatal characteristics (7) (mother’s body mass index (BMI), birth weight, smoking during pregnancy, gestational diabetes); non-traditional risk factors (8) (food advertising, marketing of snacks with gadgets); and psychological ones (parents’ perception of child body shape (9), stressful events, quality of family relationship).
Recently, researches on obesity predictors have concentrated especially on non-traditional factors. It has been suggested that TV viewing and exposure to unhealthy food and beverages advertising are associated with increased caloric intake, and, consequently, to increased obesity likelihood (10, 11). However, when looking at the association between marketing of snacks with gadgets (in order to capture children’s attention) results are controversial. Experimental studies failed to identify a significant relationship between the exposure to food packaged with come-ons (e.g., toys) and increased caloric intake (12, 13), while observational ones seemed to suggest that the restriction in the use of gadgets for the promotion of energy-dense food results in healthier food choices (14).
Several governments worldwide have implemented interventions for obesity prevention by regulating advertisement aimed to children, and the marketing of food with come-ons, even if evidence from literature are controversial. Some examples of such regulations are represented by the Santa Clara County CA Ordinance (the first U.S. jurisdiction to prohibit the marketing of toys and other incentives with foods that do not meet nutritional recommendations), and the recent Chilean law on food labelling and advertising. The recent Chilean regulation has prohibited the advertisement of food and beverages (high in sodium, total sugar, satured fat, and energy) and the use of come-ons, such as toys, stickers etc., in the promotion of such products to children under the age of 14. The adoption of such measures is motivated by the concerning high prevalence of childhood obesity, especially in Chile, where a recent report of the Chilean Health Ministry has shown that about 30% of preschoolers are overweight/obese (15).
Considering such framework, characterized by the urgent need to deal with childhood obesity epidemic, but the lack of evidence available on non-traditional obesity predictors, the aim of this study is to assess the impact of food advertising on snack consumption in Chilean children using an experimental, ad libitum, design.
The present experimental study was a spin-off of the OBEY-AD (OBEsogeneicitY of gADgets marketed with snacks) study, aimed at assessing the contribution of non-traditional factors on obesity development in children.
Children aged 6-12 years were recruited from an urban, middle-class, school setting in the city of Santiago (Chile). Children suffering of allergies, cognitive disorders or metabolic diseases were excluded. Parents’ informed consent was obtained prior to children participation to the study. Subjects’ treatment was consistent with the guidelines of the American Psychological Association (APA) (16). Appropriate permissions were obtained by the Institutional Review Board. A detailed description of the study is given elsewhere (12).
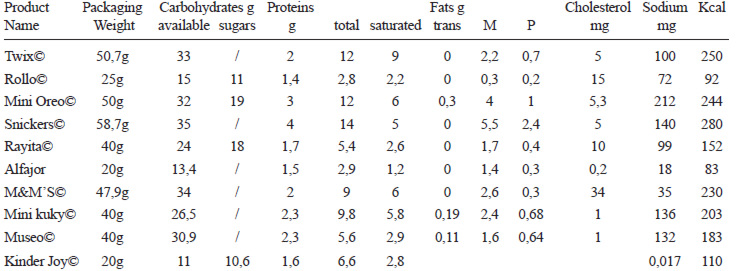
The experimental study was 5-arm ad libitum eating design (study procedure is reported in Figure 1). Children were exposed to ten different snacks (Table 1) that could be eaten ad libitum during the experimental session. The experimental factor was represented by the exposure to TV and advertising, organized in five levels: “no exposure to TV” (NoFilmNoSpot), “exposure to TV without advertising” (FilmNoSpot), “exposure to TV and one advertisement” (FilmLowSpot), “exposure to TV and two advertisements” (FilmMediumSpot), and “exposure to TV and three advertisements” (FilmHighSpot).
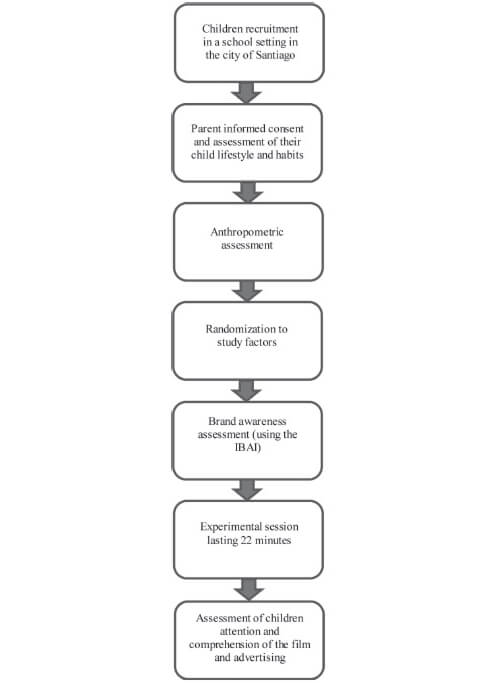
The film was a non-spoken cartoon lasting 22 minutes. It consisted of a set of episodes with Disney Pluto© as main character.
The experimental session took place in a quiet room of the school facility during the afternoon break. Children participating to the study received the same meal and had consistent physical activity patterns. They were sitting at a table in front of a monitor (except to those randomized to the NoFilmNoSpot level), while the investigator was in a back-screen position to not interfere with children performance, but to be easily reachable from their requests. The session was videotaped using two hidden HD cameras. Parents were asked to not attend the experimental session; if they refused, they were asked to sit at the back of the room without being seen by the child.
Once enrolled in the study, children underwent anthropometric assessment and lifestyle habits recording (through a validated questionnaire). After baseline assessment, kids were randomized. Randomization was blocked by age and gender, and was performed using an ad hoc software integrated with data collection and study conduction system. Subsequently, the investigator administered the International Brand Awareness Inventory (IBAI) (17) to children, and explained the next study’s steps.
Ten different snacks were presented to children (Table 1), and at the same time it was started the cartoon movie (when applicable, according to participants’ allocation). The snacks were placed on a tray, with their branded packages directed upwards. All children were asked to choose the snacks they preferred and to eat ad libitum.
In order to calculate the amount of snacks eaten by each child, the residuals were weighed at the end of the experimental session and data were entered in the study software (each snack was identified with a code reported in the study’s system program together with its weight, assessed at the beginning of the study).
Children’s were weighed and measured barefoot and wearing light clothes. Weight and height were assessed using a balance scale and a body meter with a wall stop. BMI was calculated as weight divided by height squared. Children were considered to be overweight/obese with a BMI ≥85th and underweight with a BMI <5th, according to CDC growth standards (18).
A cultural-specific questionnaire was administered to children’s parents in order to assess their son/daughter habits and lifestyles.
The tool was made of different parts. The first one aimed at assessing family characteristics (number of siblings, age/weight/height/physical activity levels of parents and siblings, with whom the child lived); socio-economic status (parents’ working status and educational level, number of rooms in the house); time spent watching TV/videogames (hours the child spent each day watching TV and playing with videogames, number of TVs in the house, presence of the TV in the child room). The second section assessed child’s eating habits (food frequency, if the child usually had breakfast/snacks/lunch/dinner) and feeding practices in early childhood (if the child was breastfed and how long). The third part consisted on a projective test investigating mother’s perception of child’s body size, and the last one assessed child’s physical activity levels.
Children’s brand awareness was evaluated by administering the IBAI questionnaire. It is a validated instrument, consisting on 12 images of food products (both international and countryspecific). Children were asked to: recognize the brand, match the brand with the corresponding food product and name the product. Details of the instrument are given elsewhere (17, 19).
Basic assumptions for powering the study were a consumption in the baseline groups (NoFilmNoSpot) of 200 Kcal, roughly corresponding to the consumption of a snack during the experimental session. Standard deviation of the regression errors has been set to 100 Kcal based on previous pilot observations. If the true slope of the line obtained by regressing Kcal consumption against experimental arm levels is 5.5 (trend analysis), 32 subjects were needed to be able to reject the null hypothesis that this slope equals zero with probability (power) 0.8. The Type I error probability associated with this test of this null hypothesis is 0.05. Sample size has been increased to 8 for accounting for nonexperimental variations in the study subjects. Sample size has been estimated using PS (20).
Basic descriptive data analysis has been performed on the sample and reported using median (I-III quartile) for continuous variables and percentages (absolute numbers) for categorical variables, whenever appropriate.
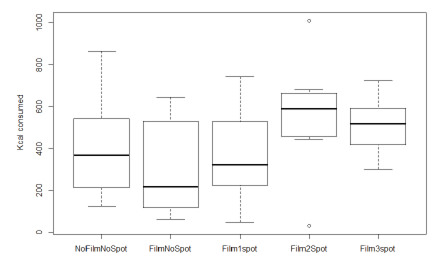
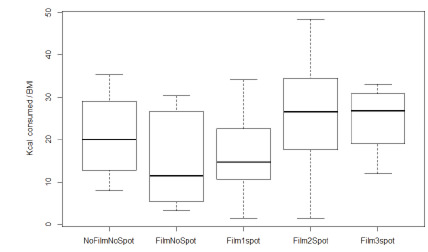
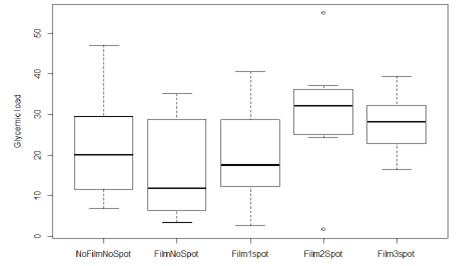
Further exploratory data analysis has been conducted to highlight the differences in the co-primary endpoints (Kcal and Kcal/BMI and Glycemic Load) across the study regimes, reporting the median and the interquartile range for both, stratified by NoFilmNoSpot, FilmNoSpot, FilmLowSpot, FilmMediumSpot and FilmHighSpot. These results can be further visualized graphically in the corresponding boxplot. (see Figure 2, Figure 3 and Figure 4).
Main analysis has been based on a linear model where blocking factors (sex and age) and FilmSpot have been inserted in the model. This is the base model used in the analysis, where specific investigations on single factor-level effects have been conducted using appropriate linear contrasts.
To further check for additional confounding factors, adjusted model has been developed, using the AIC criterion in the backward fashion. For each model, significance of the main experimental factor (exposure to TV or spot) has been assessed.
Children were classified as “high consumers” if their energetic intake during the sessions exceeded the III quartile of the distribution. Basic descriptive data analysis has been performed on the stratified sample and reported using median (I-III quartile) for continuous variables and percentages (absolute numbers) for categorical variables, were reported. Also, accordingly association tests were conducted between the probability to be a high-end consumer and selected variables (Fisher exact test for the categorical variables and t test for the continuous). Analyses has been conducted using the R System (21).
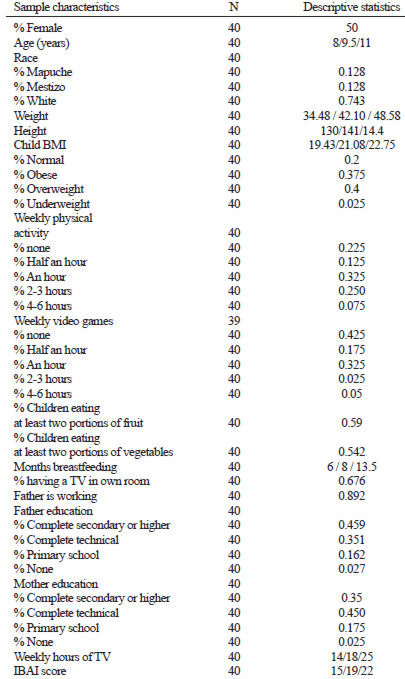
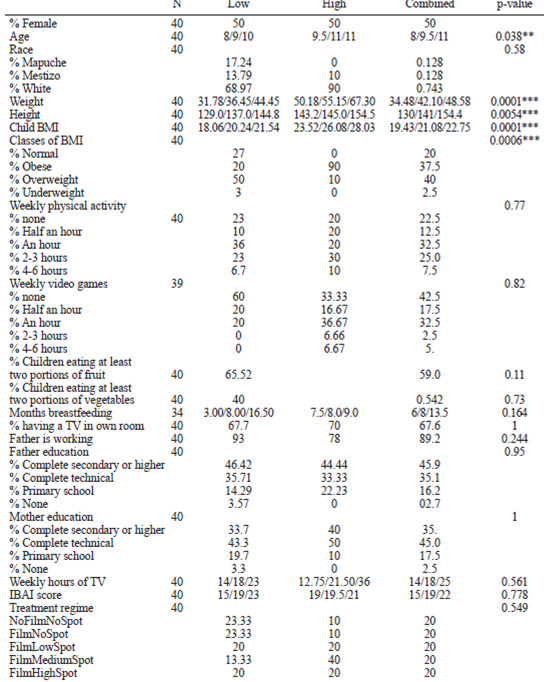
Forty children, balanced by gender, were enrolled. Children’s age ranged from 6 to 12 years (median age 9.5 years). More than an half of them was found to be overweight/obese according to the CDC growth charts (18), and to never do physical activity (22%) or to do it rarely (45% of children did physical activity only half an hour or an hour per week). Despite the fact that most of children were found to be physically inactive, most of them were reported to do not play with videogames (42.5%) or to play with videogames no more than an hour per week (50%), even if they spent a median time of 18 hours per week watching TV (roughly at least 2 hours per day). Median IBAI score was found to be 19 (15, 22 I-III quartile), corresponding to a medium-low/medium-high brand awareness. Sample characteristics are summarized in Table 2.
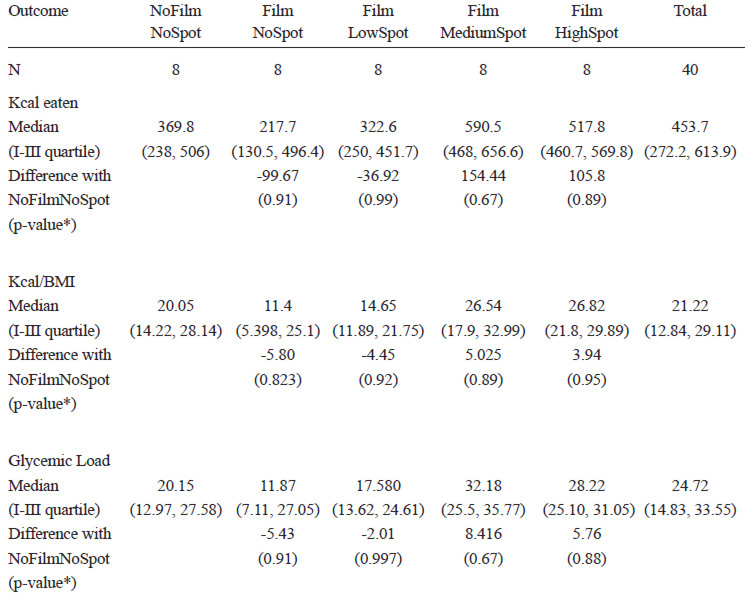
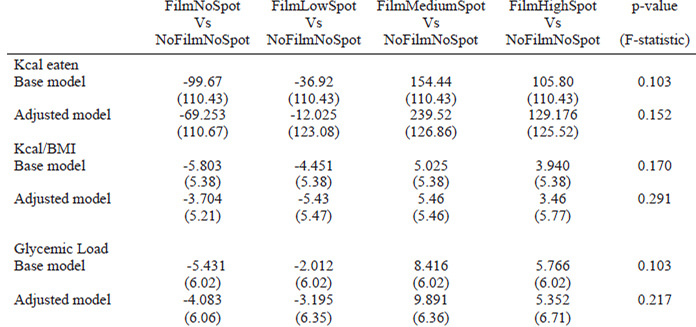
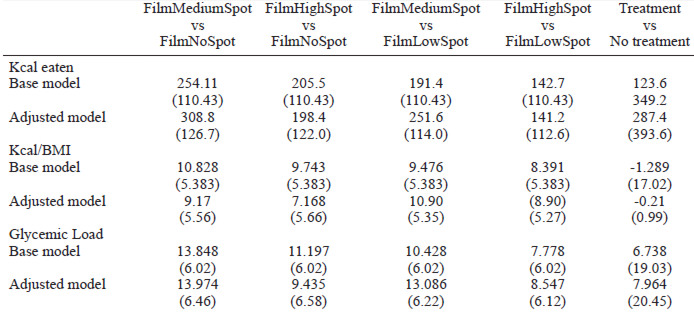
During the experimental session, children were found to eat a median of 453.7 kcal, corresponding to a median glycemic load of 24.725. Table 3 shows caloric intake (rough and per BMI) and glycemic load according to exposure to TV and advertising, and the differences in the intake of children randomized to different levels of TV/advertising exposure compared to those randomized to the NoFilmNoSpot level. Despite the fact that children allocated in the FilmMediumSpot and in the FilmHighSpot levels were reported to have higher caloric intake (rough and per BMI), and glycemic load compared to the other children (as it is depicted in Figure 2, 3, and 4), no significant differences were identified. No significant effects on caloric intake, caloric intake per BMI, and glycemic load were detected, even after adjustment for potential confounding factors using both single comparisons to the reference level NoFilm-NoSpot (Table 4) and multiple comparisons between different treatment regimens (Table 5).
Looking at the characteristics of children classified as “low consumers” and “high consumers” (according to the III quartile of the distribution of the energy intake), higher consumers were found to be more likely to be obese compared to the “low consumers”. However, referring to the study factors, no significant differences were identified according to treatment allocation.
The aim of the present study was to assess if an association existed between TV advertising and snack consumption in Chilean children. Understanding factors associated to obesity onset is relevant among kids living in Chile, given the concerning high prevalence of childhood obesity. In recent years, this country goes through a rapid economic improvement. Along with such economic improvement, a social and cultural transition has taken place, resulting in substantial changes in living conditions (e.g., adoption of better hygiene practices and food habits, but also of sedentary lifestyles and of energy-dense food consumption, instead of fruits, vegetables, and whole grains) (22). Referring specifically to nutrition transition, these changes contribute to a progressive reduction of undernutrition, but result in a dramatic growth of obesity (and its comorbidities) prevalence, especially among children and adolescents (15). Reflecting this concerning scenario, more than a half of children enrolled in the study were found to be overweight or obese, and to be scarcely physically active, which is consistent with previous research in the field (23).
The hypothesis of the existence of an association between commercials and snack consumption has been motivated by previous research suggesting that food advertising might influence food behaviors regardless subjects’ awareness (24). The analysis of data from the experimental session showed no significant association between TV/food advertising exposure and energy intake. These findings differed from those reported in previous studies, which generally have demonstrated that exposure to food advertising results in higher energy intake (25, 26). However, it has been suggested the existence of an inter-regional variability influencing the association between food advertising and snack consumption (12, 13). Moreover, a recent review on clinical trials analyzing the relationship between TV/advertising exposure and caloric intake has shown that first-quality evidence in this field are lacking. This is because generally studies have focused on children’s choice and preferences and not on their actual intake of food, even if it could not be directly translated children’s preferences to their actual consumption (27).
Results of this study show that the association between advertising and caloric intake is not obvious and possibly depending from the actual context where it is evaluated. Recent regulatory activities might be important steps in limiting consumption of specific food items. In this sense, it is essential to strictly monitor both the short and long-term effects of such regulation, carefully evaluating any changes in food choices and in overweight/obesity (and their comorbidities) prevalence among Chilean population, in order to evaluate the actual effectiveness of such public health strategies against childhood obesity epidemic.
The work has been partially supported by an unrestricted grant from the Italian Ministry of Foreign Affairs under the programs “Programmi di alta rilevanza scientifica e tecnologica” Italia-Messico and Italia-Argentina, and from Prochild ONLUS (Italy).