
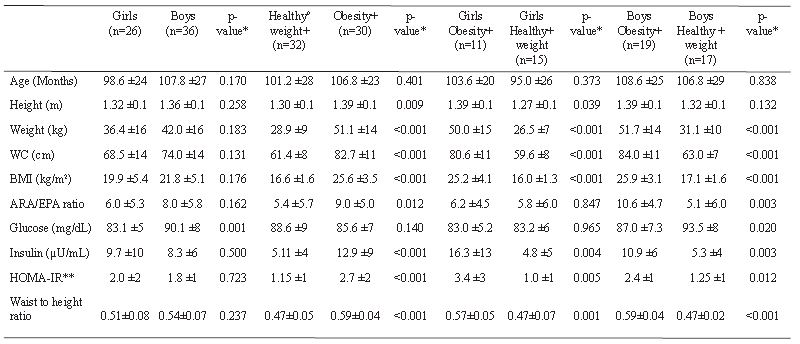
The western diet is characterized by a high consumption of n-6 polyunsaturated fatty acids (PUFAs) and reduced n-3PUFAs, this phenomenon has been parallel to the increase in the prevalence of obesity. The studies that have analyzed the association between serum PUFAs and the influence on the development of adiposity in children is limited and the findings are controversial. The present study compared the ARA/EPA (arachidonic/eicosapentaenoic) PUFA ratio in children with healthy weight vs. obesity in a cross-sectional study. Thirty children were diagnosed with obesity and 32 children with healthy weight determined through the age-specific body mass index (BMI) Z score, according to the WHO. The variables included were weight, BMI, waist circumference (WC), and the serum ARA/EPA ratio. The Student’s t test and Pearson correlation were performed and statistical significance was set at a p <0.05. The project was approved by the local ethics committee of the hospital Instituto Mexicano del Seguro Social. The serum ARA/EPA ratio was significantly higher in children with obesity compared with healthy weight (9.0 vs 5.4; p = 0.012). A statistically significant difference was observed between healthy weight boys and obese boys (p=0.003). Furthermore, the ARA/EPA ratio correlated positively with weight (r=0.336; p=0.008), BMI (r=0.373; p=0.003), WC (r=0.319; p=0.012) and cardio-metabolic risk (r=0.302; p=0.017). When performing a multivariate regression analysis, we identified that BMI was the only variable that remained significant and predicted the ARA/EPA ratio. In conclusion, the serum ARA/EPA ratio differed significantly in relation to weight and was higher in the obese children.
Key words: Obesity; omega-6; omega-3; arachidonic acid; eicosapentaenoic acid; children.
La dieta occidental se caracteriza por un alto consumo de ácidos grasos poliinsaturados n-6(AGPI) y AGPIn-3 reducidos, fenómeno que ha sido paralelo al aumento en la prevalencia de la obesidad. Los estudios que han analizado la asociación entre AGPN en suero y adiposidad en niños son limitados y con hallazgos inconsistentes. El presente estudio comparó la relación ARA/EPA (ácido araquidónico/eicosapentaenoico) AGPI en niños con peso normal vs. obesidad. Es un estudio transversal donde treinta niños fueron diagnosticados con obesidad y 32 niños con peso normal determinado mediante el puntaje z del IMC para la edad, de acuerdo a la OMS. Las variables incluidas fueron peso, IMC, circunferencia de cintura (CC) y la relación ARA/EPA en suero. Se realizó prueba de t de Student y correlación de Pearson, la significación estadística se estableció en p <0,05. El proyecto fue aprobado por el comité de ética local del Hospital del Instituto Mexicano del Seguro Social. La relación ARA/EPA en suero fue significativamente mayor en niños con obesidad en comparación con el peso normal (9,0 frente a 5,4; p = 0,012). Además, la relación ARA/EPA se correlacionó positivamente con el peso (r = 0.336; p = 0.008), IMC (r = 0.373; p = 0.003), CC (r = 0.319; p = 0.012). Al realizar un análisis de regresión multivariable, identificamos que el IMC fue la variable predictora que permaneció significativa. En conclusión, la relación de suero ARA/EPA fue significativamente mayor en los niños con obesidad.
Palabras clave: Obesidad; omega-6; omega-3; ácido araquidónico; ácido eicosapentaenoico; niños.
https://doi.org/10.37527/2018.68.1.005
Diet plays an important role in the prevention and development of obesity and metabolic diseases and published data have shown that a ratio higher than 20:1 of n-6/n-3 polyunsaturated fatty acids (PUFAs) is a risk factor for these diseases. The Western diet is characterized by a high consumption of n-6 PUFAs, such as linoleic acid, gamma-linolenic acid, and arachidonic acid (ARA) and a low intake of n-3 PUFAs, such as α-linolenic acid (ALA), eicosapentaenoic acid (EPA), and docosahexaenoic acid (DHA) (1). The intake of fatty acids (FA) and PUFAs influences the composition of tissue lipids, and these types of fatty acids have a role in adipogenesis. ARA is a precursor of eicosanoids and enhances the differentiation of adipose precursor cells to adipocytes, and EPA and DHA may inhibit adipose tissue development by attenuating the production of eicosanoids through their antiinflammatory properties, possibly reducing adipose tissue expansion and adipose cell survival (2). Studies performed on animals have found that diets high in n-6 PUFA increases the differentiation and proliferation of preadipocytes, in turn augmenting the number of adipocytes and the accumulation of fat (3,4). The published data from studies that have analyzed the association between serum PUFAs and the influence on the development of adiposity in children is limited and the findings are controversial, although some studies have associated a higher n-6/n-3 PUFA with higher childhood total body and abdominal fat mass as well as metabolic markers (5,6,7).
Blood concentrations of PUFAs are fairly well correlated with PUFA dietary intake (5,8). Therefore, the aim of the present study was to compare the ARA/EPA PUFA ratio from serum samples of children with healthy weight vs. obesity.
Protocol. A cross-sectional study was performed on sixty-two children randomly selected from the nutrition department of a primary care hospital during April 2014 to December 2014, previous informed consent signed from the children’s parents or guardians after verbal and written explanations about the study contents. In all children were performed measurements such as height, weight and waist circumference. One of the investigators took a sample of fasting blood and the tubes were labeled and stored at -75 °C until analysis for fatty acid. The inclusion criteria were as follows: (I) aged 5-12 years; (II) availability of all basic characteristics, (age, sex, body mass index (BMI), waist circumference, history of diabetes). Children that presented with diabetes or other chronic diseases, or whose anthropometric data were missing, were excluded from the study. Based on the sample size calculation, sixty-two children were included in the study. Sample size was calculated using a formula comparing two independent means.
Anthropometric and body composition assessments. All measurements were carried out by trained technicians. Before the data collection, the main author and two collaborators performed an anthropometric standardization trial evaluating consistency (intra-group individual measurements) and validity (intergroup comparison with a gold standard). The anthropometric technique was reviewed and corrected until the desired intra and inter-group correlations were achieved. For weight and height measurements, a digital scale with a 64-214 cm long stadiometer (Brand TANITA WB-3000) was used. The children were measured according to standard procedures, wearing lightweight clothing and no shoes (9). BMI was calculated as weight (kg) divided by height squared (m2). The definition of obesity and healthy weight for the children was based on the age-specific BMI Z scores established by the WHO. The children with standard deviations ≥+2 were classified as obese and those with standard deviations >-2SD to +1SD were classified as healthy weight (10). Waist circumference (WC) was measured using a fiberglass tape placed above the uppermost lateral border of the right ilium, at the end of a normal expiration, and was recorded to the nearest millimeter. This measurement was taken with the child standing upright, feet together, and arms hanging freely at the sides (11). Cardio-metabolic risk was assessed by the waist to height ratio and calculated by dividing the height (cm) by the WC (cm) and determined with a result ≥0.50 (12).
ARA and EPA determination. We obtained an 10-h fasting blood specimen by venipuncture. Serum was collected in tubes that were labeled and stored at -75 °C until analysis for fatty acid measurement. ARA and EPA were extracted applying the Folch method (13), using a solution of chloroform:methanol (2:1, vol:vol). The extracts were analyzed by means of gas chromatography coupled with mass spectrometry, employing a Varian 3900 gas chromatograph equipped with a Saturn 2100T mass spectrometer detector (Varian, Palo Alto, CA, USA,). The Omegawax 320 capillary column (30m x 0.32 mm x 0.25 um) was also used. FAs were identified by comparison with retention times of a FA standard mixture (Sigma-Aldrich, USA). Each FA was quantified by the area under the peak and compared with the FA standard. Results were expressed as the percentage of the area under the curve (% AUC). The EPA and ARA chromatographic peaks were calculated for each child (data not shown).
Insulin Resistance (IR) determination. Serum glucose was determined by the glucose oxidase method (Spinreact, SPAIN) and serum insulin was determined by the enzyme-linked immunosorbent assay (ELISA) (AlpcoMR USA). IR was estimated by the homeostasis model assessment for the insulin resistance (HOMA-IR) index as HOMA-IR= [fasting insulin (μU/L) x fasting serum glucose (mg/dL)/22.5].
Statistical analysis. Data were analyzed using the SPSS software, version 20. A normal distribution of the data was obtained when the Kolmogorov-Smirnov test was performed. The dependent variable was the ARA/EPA ratio, defined as the proportion of ARA to EPA.The variables studied were described as frequencies and percentages or as means and SD. Inferential statistics were carried out using Student’s t test and Pearson correlation. A stepwise multiple regression analysis with ARA/EPA ratio as dependent variable and age, BMI, WC and waist to height ratio as potential predictors was carried out. Statistical significance was set at a p value < 0.05.
Ethics.The protocol was approved by the Ethics Committee of the primary care hospital, conforming to the guidelines of the Declaration of Helsinki in regard to the principles of beneficence, non-maleficence, justice, and autonomy of decision. (Ethical Principles for Medical Research Involving Human Subjects. 52nd release, October 2000).
Sixty-two children were included in the study. The demographic and anthropometric data according to sex are described in table 1. The mean age of the children was 104 months ± 26 SD and 26/62 (42%) were girls: eleven had healthy weight and fifteen were obese. Thirtysix of the subjects (58%) were boys: seventeen had healthy weight and nineteen were obese. Based on the waist to height ratio, thirty-five (56.4%) of the schoolchildren presented with cardio-metabolic risk and 41.9% of the children had a WC above the 95th percentile (12). All the anthropometric variables tended to be higher in boys but did not reach statistical significance. In the group of children with obesity we observed significant higher ratio of waist to height ratio than in the children with healthy weight, twenty-seven (96.6%) had cardio-metabolic risk according to the waist to height ratio, and twenty-five (83.3%) had a WC above the 95th percentile.
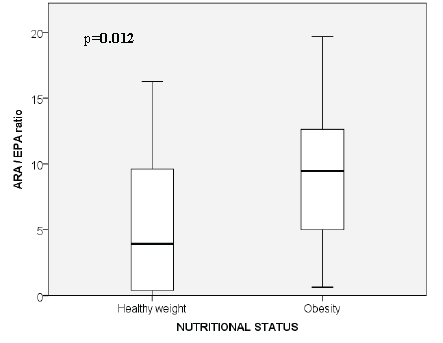
In relation to the serum ARA/EPA PUFA ratio, we found that the mean was 7.18 ±5.7 SD. When classifying the serum ARA/EPA PUFA ratio in children with healthy weight and obesity, there was a significantly higher ratio in children with obesity, compared with healthy weight (Figure 1 and Table 1). According to sex, the mean was 6.0 for girls and 8.0 for boys, with no statistical difference (Table 1). When analyzing the ratio between healthy weight girls (5.8/1) and obese girls (6.2/1), no statistical difference was observed and there was a statistical difference between healthy weight boys and obese boys, with ratios of 5.1/1 and 10.6/1, respectively (p=0.003) (Table 1). Also, when analyzing the ratio between obese boys and obese girls there was a statistical difference (10.6±4.7 vs 6.2±4.5, respectively; p=0.019), but without statistical difference between healthy weight boys and healthy weight girls (5.1±5.6 vs 5.8±6.0, respectively; p=0.750) (Figure 2). The levels of glucose, insulin, and HOMA IR are reported according to sex, only the glucose levels reached statistical significance when comparing by sex and the level was higher in boys (Table 1).
Insulin and HOMA-IR level determination in the group of children studied showed a difference between children with healthy weight vs. obesity. The children with obesity had higher levels of insulin and HOMAIR (Table 1). Of the children studied, 10/62 (16.1%) had hyperinsulinemia defined as levels of insulin above 15 μU/ml (14), 2/32 (6.3%) with healthy weight and 8/30 (26.6%) with obesity.
We also performed correlations between the serum ARA/EPA ratio with weight (r=0.336; p=0.008), BMI (r=0.373; p=0.003), WC (r=0.319; p=0.012) and waist to height ratio (r=0.302; p=0.017), all the correlations were positive and statistically significant, however the correlation between serum ARA/EPA ratio with insulin (r=0.225; p=0.079) was not significant and ARA/EPA ratio with HOMA (r=0.249; p=0.051) almost reach significance.
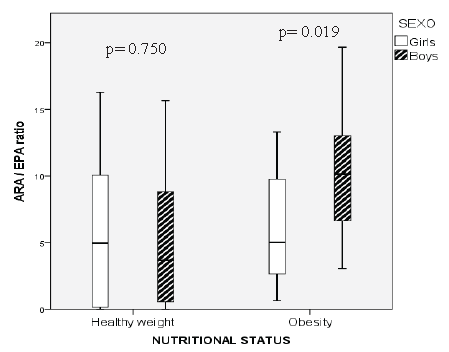
When performing a multivariate regression analysis, we identified that only BMI remained significant as a predictor variable for ARA/ EPA ratio (R2 0.139, p= 0.003) (Figure 3).
In the present study, we found that schoolchildren with obesity presented a significantly higher serum ARA/EPA ratio than children with healthy weight. Similar to what Karlsson et al reported in their study on 10 obese adolescents and 15 lean control subjects where they found that the serum FA pattern in the obese adolescents differed significantly from that in the age-matched lean controls, reflecting a decrease in n-3 PUFA, including DHA, and an increase in saturated fatty acid (SFA) (5). A recent study conducted by Cardel on 311 children aged 7-12 years found that the total PUFA intake was positively associated with lean mass and negatively associated with the percentage of body fat. They analyzed the ratio of PUFAs and SFAs intake and found that a higher ratio was associated with higher lean mass and a lower percentage of body fat (15). In contrast, a study conducted by Klein in 2005 on 60 adolescents with overweight and 60 with healthy weight found a ratio of n-6/n-3 PUFAs in plasma of 15.13± 0.55 and 13.49 ± 0.50, respectively, with no statistical significance (p=0.070) (16). Prospective studies in children have also been conducted, although very few and a recent longitudinal study performed in Colombia in 668 schoolchildren identified that n-3 PUFA (in serum) was inversely related to Z score BMI for age gain thus may be protective against weight gain (17).
When analyzing the ARA/EPA ratio in the present study according to sex, no statistically significant difference between girls and boys was found, however, obese boys had a statistically significant higher ratio (10.6/1) compared with lean boys (5.1/1) and no difference was identified within the group of girls. The differences in the omega-6/omega-3 PUFA ratio according to sex is controversy, since some prospective studies performed in adult population have identified the possibility that the effect of n-3 PUFA on reducing body fat in humans may be limited to males (18). In cross sectional studies performed in children the results are also controversy, since Karlsson et al found that girls with obesity presented with a significantly higher serum n-6/n-3 PUFA ratio (7.62 ± 1.07) than girls with healthy weight (5.35 ± 1.33), whereas no difference was reported between obese and healthy weight boys (5). Other studies have found no differences according to sex like the study carried out by Saito in 32 children and adolescents in relation to plasma EPA and ARA levels, but they did not determine the n-6/n-3 PUFA ratio (6).
The visceral adiposity is known to be a risk factor for metabolic diseases in adults and in children and previous studies have reported that the lower intra-abdominal adipose tissue measured by computed tomography scan was associated with higher intake of %PUFA, total PUFAs, and PUFA to SFA (15). In the present study we found a correlation between the serum ARA/EPA ratio with WC and waist to height ratio, which are indicators that reflect visceral adiposity, while Karlsson et al identified that serum n-3 PUFAS were inversely correlated to the subcutaneous adipose tissue and no the visceral tissue measured by magnetic resonance imaging (5). These differences could be explained because the methodology used in these studies are different, since PUFA is in blood or diet and the assessing of fat was with different methods.
Other variables, in addition to adiposity, have been described associates with levels of serum PUFAs. Karlsson et al found that n-3 PUFAs were inversely correlated with metabolic markers, such as HOMA-index B cell function (5). In 2011, Burrows reported lower erythrocyte n-3 PUFA levels in children with obesity, as well as with IR (7). Other reports in relation to the proportions of dietary n-6 and n-3 PUFAs have stated that they may contribute to the development of IR, diabetes, and metabolic syndrome (19). In our study, higher values of HOMA-IR were found in children with obesity, but ARA/EPA ratio did not correlate with HOMA-IR and hyperinsulinemia. Today, there has been a shift in the human diet in relation to the n-6/n-3 ratio balance, specifically in the Western diet. Ratios of up to 20 have been described, whereas they are recommended to be below 5 (20, 21). With the results identified, we must encourage a higher intake of foods with n-3 PUFA and avoid an imbalance in the dietary ratio of ARA/EPA for achievement of healthy weight, lower visceral adiposity that consequently will lower the risk to develop metabolic diseases.
It is important to mention that although the sample size is small, the power is adequate for the analysis. One of the main limitation of the present study was not having carried out an analysis of the PUFA dietary intake as determined by nutritional surveys to compare and correlate the PUFA concentrations in blood with PUFA dietary intake and their association with healthy weight and obesity in the population studied. However, serum PUFA has been reported to reflect intake within the last two weeks and it is fairly well correlated with PUFA dietary intake (22, 23).
Other limitation is that we did not explore the role of potential confounders such as physical activity and socio-economic status that could have an influence in the variables studied.
In conclusion, the serum ARA/EPA ratio differed significantly according to weight, and was higher in obese children, with statistical significance in obese boys. There were no differences between obese girls and lean girls. A higher serum ARA/EPA ratio was correlated with greater body mass index, greater waist circumference and waist to height ratio.
This study was supported by grants from the Fondo Ramón Alvarez-Buylla de Aldana (FRABA) of the University of Colima. There were no conflicts of interest.
Recibido: 15-12-2017
Aceptado: 13-03-2018