
 ,
María Fernanda Torres1,3,4 ,
María Antonia Luis1 ,
Mariela Garraza1,2 ,
Bárbara Navazo1,2 ,
Fabián Aníbal Quintero1 ,
María Florencia Cesani1,2 .
,
María Fernanda Torres1,3,4 ,
María Antonia Luis1 ,
Mariela Garraza1,2 ,
Bárbara Navazo1,2 ,
Fabián Aníbal Quintero1 ,
María Florencia Cesani1,2 .
The aim of this study was to evaluate body composition in relation to nutritional status and socio-environmental conditions of residence in schoolchildren living in the urban periphery of La Plata, Argentina. Weight, height, arm circumference and tricipital and subscapular skinfolds were measured in 3,284 schoolchildren aged 4-12 years in the period 2014-2017. The National Health and Nutrition Examination Survey (NHANES) III reference was used to assess nutritional status, identifying the following categories: normal, underweight, stunting, wasting, overweight and obesity. Body composition was evaluated based on upper arm muscle area (UMA) and upper arm fat area (UFA). Deficit and excess UMA and UFA were also calculated. Central fat distribution was determined with the subscapular-tricipital index. Socio-environmental characteristics were surveyed using a structured questionnaire. The prevalence of nutritional status and body composition indicators were compared by sex using Chi square test. Socio-environmental data were analyzed using categorical Principal Component Analysis, discriminating into more favorable and unfavorable conditions. Nutritional status results were as follows: normal, 64.5%; stunting, 3.4%; underweight, 0.0%; wasting, 0.1%; overweight, 15.6% and obesity 16.4%. The nutritional status of children worsened as the socio-environmental condition of their families became more precarious. Long-term socio-environmental stress manifested as decreased muscle tissue in normal, stunted, overweight and obese children. The current results evidence the strong impact of poverty on child growth and development and at the same time enforce the need for continuous monitoring of children with hidden malnutrition. Arch Latinoam Nutr 2020; 70(2): 81-94.
Palabras clave: Malnutrition, stunting, overweight, body fat distribution, upper-arm muscle area, upper-arm fat area.
El objetivo del trabajo fue analizar la composición corporal en relación al estado nutricional y las condiciones socio-ambientales de niños residentes en la periferia urbana de La Plata, Argentina. Sobre 3284 escolares de 4 a 12 años se evaluaron peso, talla, perímetro braquial y pliegues tricipital y subescapular, durante los años 2014-2017. Se determinaron, utilizando la referencia NHANES III, las categorías de estado nutricional Normal; Bajo Peso/Edad; Baja Talla/Edad; Bajo IMC/Edad; Sobrepeso y Obesidad, y para composición corporal, se calcularon las áreas muscular y grasa (UMA y UFA) y se estimaron los déficits y excesos de tejido muscular y graso. La adiposidad centralizada fue estimada con el índice subescapular-tricipital. Las características socio-ambientales se evaluaron mediante encuesta estructurada. Las prevalencias del estado nutricional y de los indicadores de composición corporal fueron estimados y comparados por sexos, mediante pruebas de Chi2. Los datos socio-ambientales se analizaron empleando Análisis de Componentes Principales categóricos y se discriminaron dos grupos: con condiciones más favorables y con condiciones desfavorables. Los resultados indicaron: 64.5% Normal, 3.4% Baja Talla/Edad, 0.0% Bajo Peso/Edad; 0.1% Bajo IMC/Edad; 15.6% Sobrepeso; 16.4% Obesidad. El estado nutricional de los niños empeoró cuando la calidad socio-ambiental de sus familias se hizo más precaria. Debido al estrés socio-ambiental continuo, los niños tuvieron disminución del tejido muscular, incluyendo aquellos con estado nutricional Normal, Baja Talla/Edad, Sobrepeso y Obesidad. Los resultados alcanzados evidencian la impronta que deja la pobreza e impone urgentemente el monitoreo continuo de niños "con desnutrición oculta". Arch Latinoam Nutr 2020; 70(2): 81-94.
Key words: Malnutrición, baja talla, sobrepeso, distribución grasa, área muscular del brazo, área grasa del brazo.
https://doi.org/10.37527/2020.70.2.001
Autor para la correspondencia: Evelia Edith Oyhenart, email: [email protected]
Overweight and obesity are not only globally responsible for more deaths than underweight, but also the cause of cardiovascular diseases, hypertension and diabetes mellitus, among others. Obesity has almost tripled worldwide since 1975. In 2016, more than 1.9 billion adults were overweight, of which more than 650 million were obese, 41 million children under five years were overweight/obese, and more than 340 million children and adolescents (5-19 years old) were overweight/obese (1).
The prevalence of obesity is increasing worldwide, especially in Latin America (2). In Argentina, the prevalence of excess weight was estimated to be 66.1 % (33.7 % overweight and 32.4 % obesity) by the 4° Encuesta Nacional de Factores de Riesgo at the population over 18 years of age (3). A study performed in 7,873 schoolchildren aged 4-12 years in four districts of the province of Buenos Aires found that the most prevalent nutritional disorders related to environmental and socio-economic conditions of residence were overweight (21.1 %) and obesity (11.4 %) (4).
An advanced nutritional transition stage is characterized by the exponential growth of obesity; however, the prevalence of undernourishment at the other end of the scale deserves special attention. For instance, the prevalence of overweight, obesity and undernourishment in children and adolescents aged 7-19 years from Venezuela was 14.5, 9.6 and 10.7 %, respectively, in 2008 and 2009 (5). These data reflect the double burden of malnutrition, particularly in middle- and low-income countries (6).
The prevalence of undernourishment in Latin America in the early 80’s was 25 %, decreasing to 12 % at the beginning of the 21st century. However, persistently high values (>15 %) are still reported in countries such as Guatemala, Honduras, Bolivia, Guyana, Haiti, El Salvador, Peru and Nicaragua. On the other hand, the prevalence of undernourishment is lower than 5 % only in three countries (Costa Rica, Chile and Trinidad and Tobago), revealing that rates are not uniformly distributed across the region (7).
In Argentina, undernourishment has been reported in different provinces. A study conducted in a sample of 10,879 children and adolescents aged 3-14 years from the provinces of Jujuy, Catamarca, Misiones, Mendoza, Buenos Aires and Chubut found that the prevalence of undernourishment was 25 % (8). In the mentioned study, the prevalence of stunting was higher in the range 5-14 years, and the highest values were recorded in northwest and northeast populations of Argentina (8). On a national scale, the prevalence of undernourishment was 5 %, as reported by the Programa Nacional de Salud Escolar (9) and the 2º Encuesta Nacional de Nutrición y Salud (ENNyS 2) (10).
Growth is achieved at all ages, reflecting the past nutritional experience of an individual on which the next phase of growth will be based. Thus, the above mentioned nutritional constraints lead to poor growth and limit the opportunity of children to reach their full potential (11). In this context, the assessment of body composition is fundamental to evaluate nutritional status since it allows to examine the specific growth of some components such as muscle and adipose tissue. Among the diverse methods available for such evaluation, anthropometry is a reliable approach because of its simplicity and scope of application, particularly in field work. Height-for-age, weight-for-age, weight-for-height and upper-arm circumference are the most widely used indicators to evaluate physical growth and nutritional status of children and adolescents (12-15). Besides, fat and muscle areas calculated based on skinfold thickness and body circumferences provide another measure of physical growth and body composition to assess the impact of genetics and factors such as nutritional status, disease and exercise on the main components of the human body (16).
The aim of this study was to evaluate body composition in relation to nutritional status and socio-environmental conditions of residence in children from the urban periphery of La Plata, Argentina.
A cross-sectional anthropometric and socio-environmental study of schoolchildren (n= 3,305); age, 4-12 years) was conducted during the 2014-2017 academic years in 26 public schools (kindergarten, elementary and high levels) located in the periphery of the city of La Plata.
Sample selection was non-probabilistic and largely determined by voluntary participation in the study. Parents or guardians provided informed consent. Children whose parents did not sign the forms were not measured. Children with pathologies, overt diseases or receiving any drug treatment as well as those who refused to participate were excluded. Sample size was calculated using the total number of schoolchildren during the 2014-2017 academic years with data provided by the Dirección General de Escuelas of the province of Buenos Aires. Using binomial distribution and assuming a maximum variance (p * q = 0.25), 3% resolution and 95% confidence level, the required sample size was 698 schoolchildren. The surveyed sample exceeded the minimum size required.
The Anthropometric Standardization Reference Manual (17) was used to measure the following variables: body weight (BW, kg), with subjects lightly clothed (the estimated weight of the clothes then being subtracted), using a portable digital scale with 100 g accuracy (TANITA UM-061, Arlington Heights IL, United States); height (H, cm), with a portable vertical anthropometer (1 mm accuracy) (SECA 213, Hamburg, Germany); upper arm circumference (UAC, cm), measured on the left arm relaxed at the midpoint between the acromion and the olecranon, with a flexible steel tape (MABIS, 1 mm accuracy); triceps and subscapular skinfold (TS and SS, mm) with a LANGE caliper (1 mm accuracy) (Cambridge Scientific Industries, Cambridge, MD, United States). Measurements were taken by previously trained researchers of this study. The instruments were calibrated at the beginning of each anthropometric session.
Based on the date of birth, the decimal age of each participant was calculated. Body mass index (BMI) was obtained with the formula BMI = BW (kg)/H (m)2.
Body weight, height and BMI were transformed into Z-scores using the comprehensive reference data published by Frisancho (18), which were based on the NHANES III survey. The following undernutrition indicators were determined: low weight-for-age or underweight (weight-for-age <-2Z); low height-for-age or stunted (height-for-age <-2Z), and low BMI-for-age or wasted (BMI-for-age <-2Z). On the other hand, excess weight included overweight (BMI-for-age >1Z; ≤2Z) and obesity (BMI-for-age >2Z). Children who did not classify in the previous nutritional categories were considered as “normal” or without anthropometric failure (8).
For body composition analysis, total upper-arm area (TUA = [(UAC)2/(4 × π)]), upper-arm muscle area (UMA = [UAC–(TS × π)]2/(4 × π)) and upper-arm fat area (UFA = (TUA–UMA)) were calculated. Cut-off points for low UFA/UMA and high UFA/UMA were set to -2 and +2Z- scores, respectively (18).
Body fat distribution, either central or peripheral, was assessed with the subscapular-tricipital index (STI), calculated as the ratio between SS and TS (STI = SS/TS). An STI score higher than 1 was considered as an indicator of high risk of central fat distribution (19).
Socio-environmental characteristics were surveyed using a structured questionnaire which was completed by parents/guardians. Housing conditions were assessed with information regarding structural and physical amenities (interior and exterior housing conditions) (20). Parents were asked about building materials (low-quality prefab, fired-brick masonry, makeshift materials), source of drinking water (piped water system, protected well, unprotected well), wastewater disposal (sewage system, septic tanks, cesspool), fuel for cooking and heating (piped gas, bottled gas, kerosene, firewood), pavement, electricity, waste collection and critical crowding (more than three persons per room). Socio-economic status was determined with the following variables: lodging or home-tenure status (house owner, lease holder, free lodging), parental educational level (elementary, high school, university), parental job (formal worker, unqualified worker performing mostly temporary jobs, informal worker, freelance, unemployed), health insurance (medical insurance at the expense of the employer or paid by the person), national or local assistance programs (governmental agencies, non-governmental organizations, other entities) to supplement the family´s food budget (nutritional support) and/or provide cash relief to the heads of households (monetary support), and farming (animal husbandry, orchard, horticulture).
Socio-environmental data were analyzed using categorical Principal Component Analysis (catPCA). Comparisons by sex and socio-environmental conditions were performed using Chi square test (Chi2) adjusted by Bonferroni correction.
The research protocol was approved by the Ethics Committee of the Latin American School of Bioethics (CELABE, for its Spanish acronym). The investigation was in accordance with the ethical standards instituted by the 1947 Nuremberg Code, the 1948 Universal Declaration of Human Rights and the 1964 Helsinki Declaration and subsequent amendments, with particular attention to National Law 26,343 about protection of personal data. Authorization to access schools was granted by the General Direction of Schools of the province of Buenos Aires. Participation in the study required signed informed consent of parents or guardians.
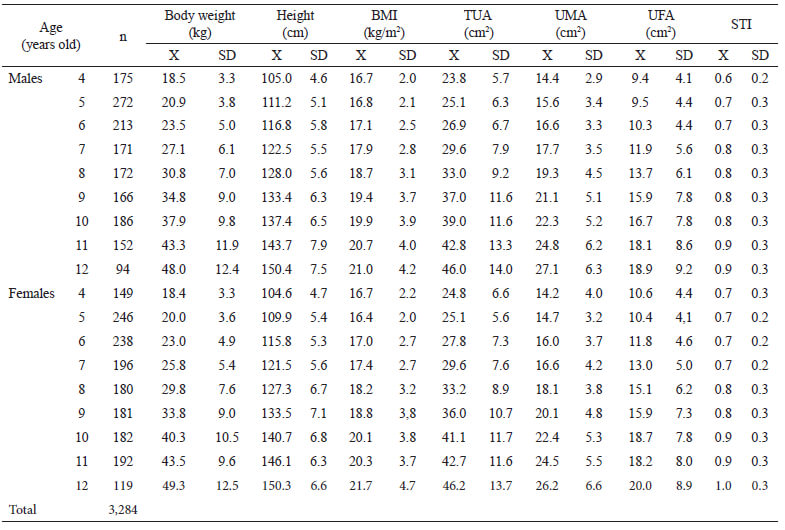
Schoolchildren facing the double burden of malnutrition (excess weight and stunting) were excluded from the study population due the scarce representation (0.64%; n=21). Thus, the final sample included 3,284 participants. Table 1 shows the means and standard deviations of the measured and calculated variables discretized by sex and age.
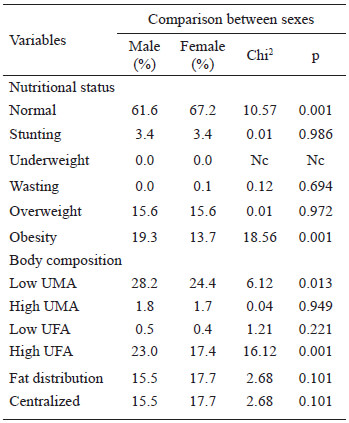
Of the students evaluated, 64.5% were normal. The prevalence of undernutrition was 3.5% (stunted, 3.4%; underweight, 0.0%; wasted, 0.1%) and that of excess weight was 32.0% (overweight, 15.6%; obesity, 16.4%). Comparison between sexes showed significant differences in the prevalence of normal nutritional status which was higher in females, and obesity, which was higher in males. The remaining sex differences were not significant (Table 2).
Overall, body composition results were as follows: low UMA, 26.2%; high UMA, 1.7%; low UFA, 0.5% and high UFA, 20.1%. Differences between sexes were significant for low UMA and high UFA, with higher values in males. Regarding body fat distribution, CA was present in 16.6% of the population, without significant differences between sexes (Table 2).
Data on body composition and body fat distribution according to nutritional status are presented in Table 3. Differences between males and females were significant for normal schoolchildren. Low UMA values were higher in males, whereas high UMA values were higher in females. Differences between sexes were not significant in stunted children. On the other hand, the prevalence of low UMA was higher in male overweight children, and the prevalence of high UFA was higher in male obese children (Table 3).
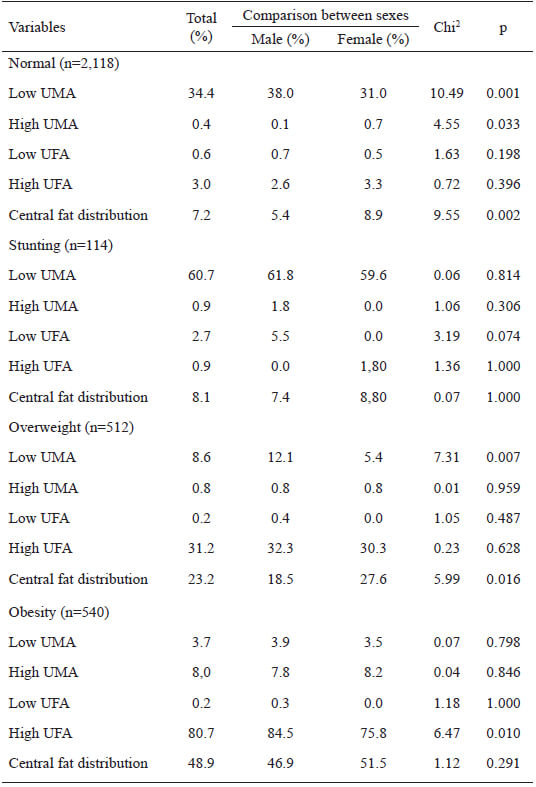
Body fat distribution was significantly different between sexes in normal and overweight children, with a higher prevalence in females. Concerning stunting and obesity, differences were not statistically significant (Table 3).
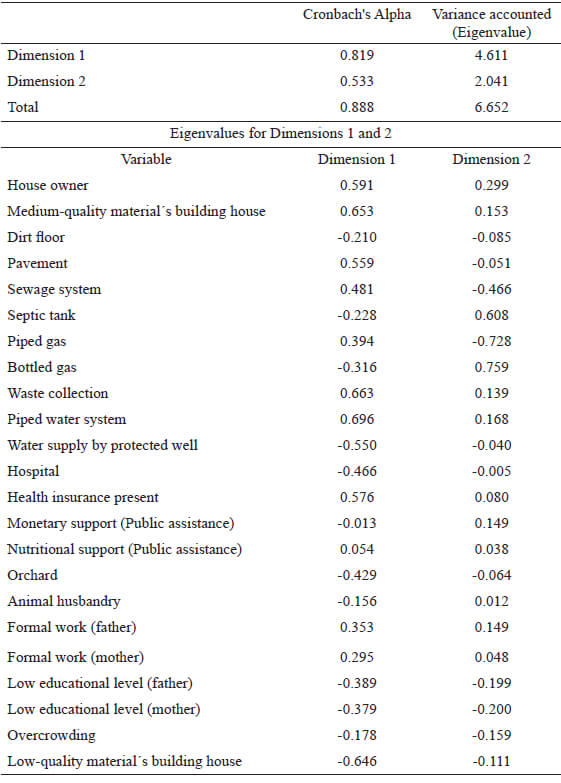
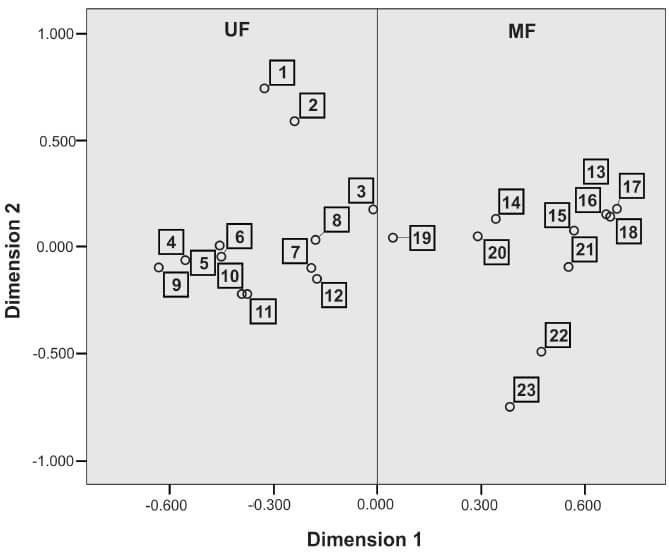
In general, socio-environmental conditions were linked to low availability of public services, overcrowding, low educational level of parents, who were informally engaged in farm activities in the periphery of the city of La Plata. The catPCA allowed the differentiation of two main components (Dimensions 1 and 2), with a cumulative variance (Eigenvalue) of 6.652 and 0.888 Cronbach's Alpha (Table 4). The individual scores of schoolchildren were used to discriminate two groups from Dimension 1: a) schoolchildren with unfavorable socio-environmental conditions of residence (UF, n = 1,749; 53.3% of the total population), characterized by low construction quality of households (sheet metal roof, wood-paneled walls, dirt floor), scarce public services (septic tank, bottled gas), overcrowding, low level of parental education, temporary unskilled jobs, monetary governmental assistance, orchard and/or animal husbandry for family consumption, receiving health care in public hospitals; and b) schoolchildren with more favorable socio-environmental conditions (MF, n = 1,535; 46.7% of the total population), characterized by households of higher construction quality (fired-brick masonry, cement or siding floors), less critical crowding, access to public services (pavement, piped gas and water supply by protected well, sewage system, and waste collection), higher level of parental education, formal jobs and health care covered by health insurance (Fig. 1).
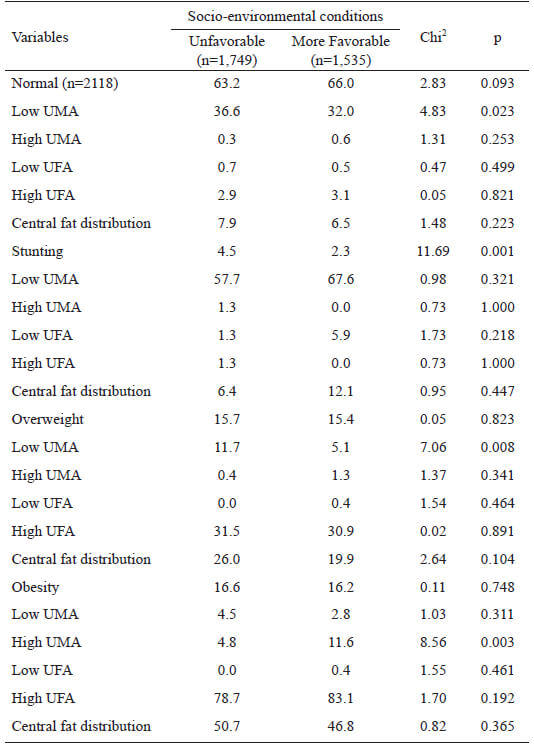
The analysis of nutritional status in both socio-environmentally differentiated groups indicated significantly higher prevalence of stunting in UF compared with MF (4.5 % vs. 2.3 %), without significant differences in the remaining nutritional indicators. Regarding body composition, the percentage of schoolchildren with low UMA was higher in UF compared with MF (28.3 % vs. 23.9 %). This trend was also observed in normal schoolchildren and overweight. On the other hand, high UMA was more prevalent in MF compared with UF (1.1 % vs. 2.5 %), represented by obese schoolchildren (Table 5).
This work provides new evidence on the body composition of children aged 4-12 years from the urban periphery of La Plata, in relation to nutritional status and socio-environmental conditions of residence. The relevance of peri-urban spaces is concerned with the engagement of families in intensive horticultural production for the supply of food to the city and surrounding areas. We found that many parents of the studied children were informal workers with a low educational level, having only reached elementary school level. Intra and peri-domiciliary conditions were not satisfactory, as evidenced by critical crowding and severe environmental sanitation problems especially related to drinking water, sewage and waste collection. Similar socio-environmental conditions had already been reported in horticulturists living in La Plata neighboring towns, namely, high intestinal parasitic contamination in human beings, animals and vegetables for consumption which were associated with inadequate elimination of sewage and use of non-potable water, reflecting that precarious living conditions affected their health (21).
The results obtained with catPCA indicated that the study population fell into two large groups, one composed of families with better socio-economic and environmental conditions, and another with unfavorable conditions. Nevertheless, all families received governmental monetary support and/or food assistance. Furthermore, children received food assistance at school to compensate the potential nutritional imbalance. Thus, students attending the morning shift received breakfast and lunch, while those attending the evening shift were given lunch and a snack. Breakfast and snacks included tea, milk, “mate cocido” (a yerba mate infusion) and bread, biscuits or cakes. Lunch included noodles, “polenta” (cornmeal) with sauce (sometimes with minced beef), chicken with mashed potatoes, or rice. Desserts could include flan or some seasonal fruit. In this sense, insufficient quantity and quality of food and water are two of the main challenges related to natural resources and social justice that many communities are facing and will face this century (22). Such deficit is related to poverty, one of the main contributors to the intergenerational malnutrition affecting low and middle-income countries. Although poverty has been identified as a national and international priority to be eradicated, it still persists (23).
There is a consensus that children living in poor environments face many barriers that impair their adequate growth (24). In the current study, only 65 % of children had normal nutritional status, and approximately 26 % had muscle tissue deficits. In line with these results, Jackson et al. (11) reported that effective nutrient partitioning to tissues during childhood reflected the hierarchy of demand in critical periods of growth. Although micronutrient deficiencies can impact on processes such as muscle growth and repair, protein-energy deficiency has a greater effect on body composition since low protein intake may lead to more drastic muscle mass losses. This may be one of the reasons why children of the present study had less muscle mass, even when they formed part of the group with more favorable conditions and had an adequate nutritional status.
The nutritional status of children worsened as the socio-environmental quality of their families became poorer. It could be seen that 3.5 % of children were undernourished (nearly all stunted), suggesting the chronicity with which the stressors acted on growth. According to Sterling et al. (25), early linear growth retardation manifests as permanent deficits in height during adolescence. Furthermore, organ size is generally smaller in stunted children, who have less bone and skeletal muscle tissue (11). As an inevitable consequence of long-term undernutrition, stunted male and female children of this study had low muscle mass (61 %) and fat mass (3 %) area. Similar results have been reported in children from General Alvear (Mendoza, Argentina), a population characterized by high rates of structural and non-structural poverty (26). In the mentioned study, 70 % of undernourished children had decreased muscle mass and 8 % had decreased fat mass, mainly indicating protein rather than calorie deficit (26). As explained by Carbajal Azcona (27), muscle tissues are in a dynamic balance with the availability of dietary protein; therefore, changes in the amount of muscle tissue indicate changes in nutrient availability.
Males with normal nutritional status presented muscle tissue deficit and central fat distribution. This finding could be associated with the loss of peripheral fat rather than with the increase in central fat, considering that body fat distribution was estimated using the STI, which relates subscapular and triceps skinfolds. According to Wells et al. (28), these results would account not only for the impact of an unfavorable environment where sustained environmental stressors affect the growth of children, but also for the importance of screening for hidden malnutrition through the analysis of body composition.
The strong relationship between socio-environmental conditions of residence and malnutrition was evidenced by growth deficiency – and its long-term implications – and by overweight and obesity, which had the highest prevalence. Childhood obesity has become a major global epidemic that causes substantial social and health burdens worldwide (29). In the peri-urban population of La Plata, overweight and obesity prevalence were similar in the two socio-environmental groups (UF and MF). It should be noted that a large proportion of schoolchildren were beneficiaries of governmental food and/or monetary assistance programs, regardless of the group. There is evidence that malnutrition-focused programs increase the risk of low-quality diets, obesity and diet-related non-communicable diseases, especially in countries experiencing a rapid nutritional transition (30). In the present work, we found overweight concurrent with muscle tissue deficiency, which were more evident in UF compared with MF (12 % vs. 5 %). These results were similar to those reported by Oyhenart et al. (31), who attributed the presence of overweight/obesity and muscle tissue deficit to the consumption of very high-carbohydrate/low-protein diets.
In Tucumán, a province in northwestern Argentina, the prevalence of wasting and stunting was found to be higher in females (32). In the current study, sex differences were only present in normal (females over males) and obese (males over females) children. A greater deterioration of UMA was also observed in males. In this regard, Waddington (33) proposed a higher ecosensitivity of men to an adverse environment and a better canalization of female development when describing the trajectory of growth within a narrow channel, not altered by environmental factors. On the other hand, Aguirre (34) argued about inequality in times of scarcity from a sociocultural perspective, concluding that unequal food distribution among family members could be due to the fact that men are given priority because they constitute the present and future workforce. This could probably explain the higher prevalence of obesity in males. In this sense, low-income developing countries undergo a rapid process of nutrition transition, as was suggested by Popkin (35) and Popkin et al. (36). Long-term sequelae associated with excess weight over the life course include increased risk of cardiovascular disease, diabetes mellitus, hypertension and some types of cancer (37-38).
Some of the limitations of the study are concerned with the cross-sectional design of the study and the fact that the children eating habits were not surveyed. However, the analysis of body composition, nutritional status and socio-environmental conditions of residence of the 3,284 boys and girls aged 4-12 years was useful to strengthen the results found and justifies the need to go deeper into the issue.
Changes in body composition were present in normal nutritional status children as well as in undernourished, overweight and obese children. Socio-environmental and economic conditions had a direct effect on those parameters. Severe protein deficiency in the diet of children was evidenced by reduced muscle mass, whereas excess dietary carbohydrates and fat manifested as higher fat mass, mainly central adiposity. The current results evidence the strong impact of poverty on child growth and enforce the need for continuous monitoring of children with hidden malnutrition. Governmental policies will be effective if food assistance is sufficient to support child growth and development, and provided children and their families live in a healthy environment.
The authors thank schoolchildren and their parents/guardians, school authorities, teachers and non-teaching staff for helping us with our work in educational establishments. Thanks are also due to Mrs. María Cristina Muñe for the general revision of the manuscript, Architect Luis María Forte for his assistance in the elaboration of the figure, and L. Adriana Di Maggio for revising and editing the text.
This research was funded by Universidad Nacional de La Plata (Grant 11/N808), Agencia Nacional De Promoción Científica y Tecnológica (Grant PICT-2016-0610) and Consejo Nacional de Investigaciones Científicas y Técnicas (CONICET, Grant PIP 0106).
The authors declare no conflict of interest.
Recibido: 30/06/2020
Aceptado: 18/08/2020