
 , Rosa del Carmen Vázquez-Zapien1 , Hugo Ventura-Cisneros1 , Mario del Toro-Equihua1 , Benjamin Trujillo-Hernández1 , Carmen Alicia Sánchez-Ramírez1
 Aim: to determine the association between serum ferritin levels, lipid profile and adiposity in school-age children. Methods: A cross-sectional study was conducted on obese and non-obese children. Weight, height, waist circumference and blood pressure were measured for all participants. Lipid profile, serum ferritin and glucose were determined and analysed through absorbance. The Spearman correlation was performed for the quantitative variables and a regression analysis was used to determine the interaction between variables. Eighty-nine children were included, with a median age of 9.0 years. Results: When comparing serum ferritin levels in normal weight group, vs. the overweight and obesity group, values were significantly higher in the latter. Serum ferritin correlated positively with BMI (Rho .282, p <0.01), waist circumference (Rho .372, p < 0.01), diastolic blood pressure (Rho .244, p < 0.05), body fat percentage (Rho .375, p < 0.001), insulin (Rho .254, p <.05) and sex (Rho .224, p <.05); and negatively with high-density lipoprotein cholesterol (Rho. -221, p< 0.05). When analysing the significant variables in a multivariate regression model, sex, body mass index, waist circumference, and body fat percentage remained statistically significant (p <0.01). Conclusion: We observed associations between serum ferritin and obesity in Mexican school aged children. Arch Latinoam Nutr 2020; 70(3): 155-163.
Palabras clave: Ferritins, lipids, overweight, obesity, children.
Objetivo: determinar la asociación entre los niveles de ferritina sérica, el perfil de lípidos y la adiposidad en niños en edad escolar. Metodología: Se realizó un estudio transversal en niños obesos y no obesos. Se midieron el peso, la altura, la circunferencia de cintura y la presión arterial en todos los participantes. El perfil lipídico, la ferritina sérica y la glucosa se determinaron y analizaron mediante absorbancia. Se realizó correlación de Spearman para las variables cuantitativas y se utilizó un análisis de regresión para determinar la interacción entre las variables. Se incluyeron ochenta y nueve niños, con una edad media de 9,0 años. Resultados: Al comparar los niveles de ferritina sérica en el grupo de peso normal, frente al grupo de sobrepeso y obesidad, los valores fueron significativamente más altos en este último. La ferritina sérica se correlacionó positivamente con el IMC (Rho 0,282, p <0,01), la circunferencia de cintura (Rho 0,372, p <0,01), la presión arterial diastólica (Rho 0,244, p <0,05), el porcentaje de grasa corporal (Rho 0,375, p < 0,001), insulina (Rho 0,254, p <0,05) y sexo (Rho 0,224, p < 0,05); y negativamente con colesterol de lipoproteínas de alta densidad (Rho -0,221, p <0,05). Al analizar las variables significativas en un modelo de regresión multivariante, el sexo, el índice de masa corporal, la circunferencia de cintura y el porcentaje de grasa corporal se mantuvieron estadísticamente significativos (p <0,01). Conclusión: Observamos asociaciones entre la ferritina sérica y la obesidad en niños mexicanos en edad escolar. Arch Latinoam Nutr 2020; 70(3): 155-163.
Key words: Ferritina, lípidos, sobrepeso, obesidad, escolares.
https://doi.org/10.37527/2020.70.3.001
Autor para la correspondencia: Carmen Alicia Sánchez Ramírez, email: [email protected]
In recent decades, overweight, obesity, and chronic non communicable diseases have increased worldwide. In 2019, an estimated of 8.2 million children under the age of 5 years were overweight or obese; and the prevalence of overweight and obesity among children and adolescents aged 5-19 has risen dramatically from just 4% in 1975 to just over 18% in 2016 (1). It has been described that children and adolescents with obesity, especially those with increased abdominal fat, can have an atherogenic serum lipid profile, characterized by an increase in total cholesterol (TC) serum levels, triglycerides (TGL) and low-density lipoproteins (LDL), as well as a decrease in high-density lipoproteins (HDL) (2). The health consequences of overweight, obesity, and abdominal obesity during childhood are strongly associated with risk factors for a number of medical conditions such as cardiovascular diseases, diabetes, and cancer (3). The excessive accumulation of body fat that characterizes obese subjects is associated with morphological and physiological changes in the adipose tissue, conditions that contribute to the development of an inflammation process through the secretion of various proinflammatory cytokines and adipokines (IL-6, TNF-α, leptin, C-reactive protein) which decreases insulin sensitivity and increases lipolysis and these changes may eventually lead to insulin resistance and dyslipidemia (4). Therefore, the risk that children have of developing chronic non communicable diseases is increased not only by obesity itself, but also by the lipid profile alterations, and these risks are enhanced because they occur in early stages of life (5). It is estimated that more than 70% of obese children will have a body mass index (BMI) > 30 kg/m2 in adult life (6).
Regularly, serum ferritin is recommended as the primary measure of iron status, but interpretability is challenging in settings with infection and inflammation (7). Recent evidence indicates that moderately elevated serum ferritin levels, are associated with obesity, metabolic syndrome, dyslipidemia, high blood pressure, insulin resistance, diabetes mellitus and nonalcoholic fatty liver (8,9). This study aims to evaluate how serum ferritin correlates with lipid profile and adiposity, that can contribute with the evidence that this acute phase protein could be proposed as a biomarker of cardiovascular risk in school children.
Convenience sampling method was used for this study, were eighty-nine schoolchildren were recruited from a local primary school in Colima, Mexico. The children were classified as normal weight, overweight, or obese. The mean age was 9.0 + 1.93 SD, with a range of 6.1 to 12.0 years old. The study had a cross-sectional design. Children with genetic, chronic, or systemic diseases, as well as those with a current or recent infection, were excluded. The dependent variable was serum ferritin concentration (SF) and the independent variables were lipid profile (triglycerides [TGL], low-density lipoprotein cholesterol [LDL-C], high-density lipoprotein cholesterol [HDL-C], total cholesterol [TC]), body fat percentage (BF%), body mass index (BMI), waist circumference (WC), blood pressure (BP) and insulin levels.
The study was approved by the local ethics committee of the Universidad de Colima, Mexico (reference 2017-8) conform to the principles embodied in the Declaration of Helsinki. Signed statements of informed consent were obtained from the parents or guardians of the children before they were enrolled in the study. This research received no specific grant from any funding agency in the public, commercial, or not-for-profit sectors. All authors declare that they have no conflict of interest.
All the equipment used in the present study was calibrated before and during the period of data collection, and a complete standardization of each protocol was carried out.
Height: It was measured and recorded to the nearest 0.1 cm using a stadiometer (Seca) with a movable block. The subjects were measured while standing, without shoes, heels together, back as straight as possible, and arms hanging freely by the sides. The head was positioned in the Frankfort horizontal plane and the movable block was lowered until touching the head (9).
Weight: Study subjects were weighed on a paediatric scale (Tanita Iron Kids BF-689), without shoes and with a minimum of clothing.
BF%: The same equipment was utilized to measure body fat percentage. The Tanita scale includes a body fat monitor with small platforms to accommodate children’s feet.
BMI: Calculated as weight (kg) divided by height squared (m2).
Definitions of overweight, and obesity among children were based on the WHO Z scores of BMI for age. Standard deviations above +1 for overweight, and above +2 for obesity were used.
WC: It was measured using a fiberglass tape above the uppermost lateral border of the right ilium, at the end of a normal expiration, and was recorded to the nearest millimeter. WC was classified in percentiles (10th, 25th, 50th, 75th, and 90th) according to the pattern in Mexican-American children published by Fernández et al. (10).
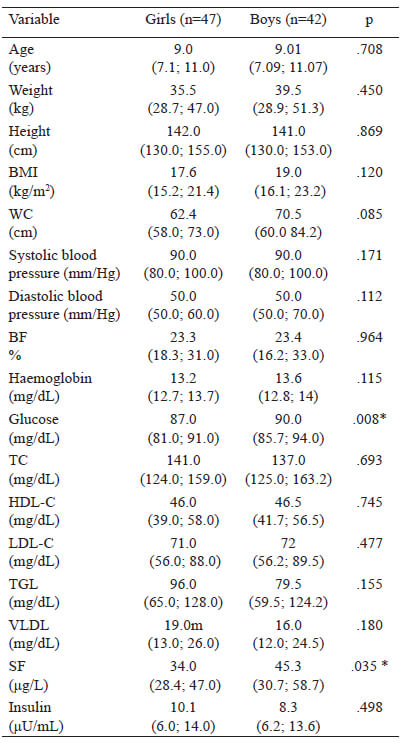
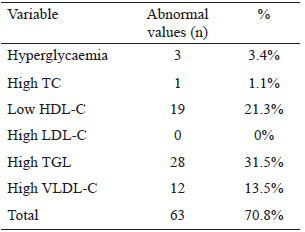
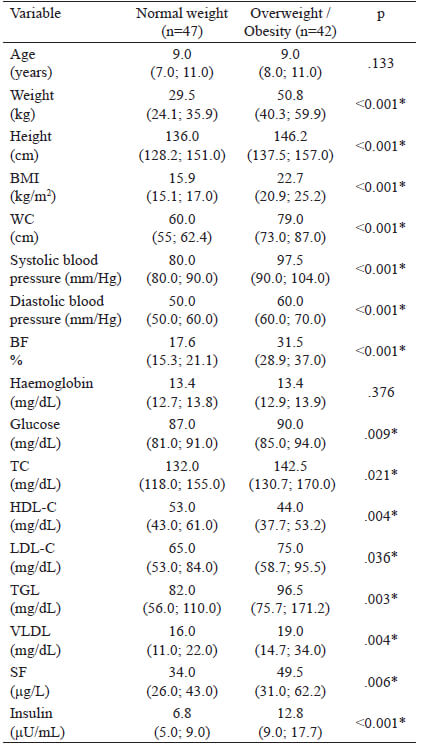
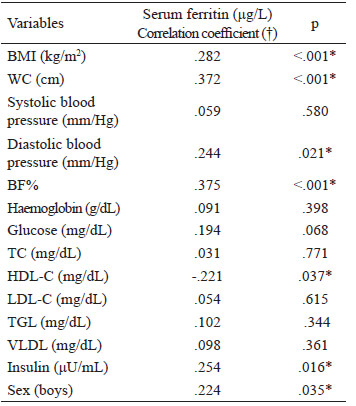
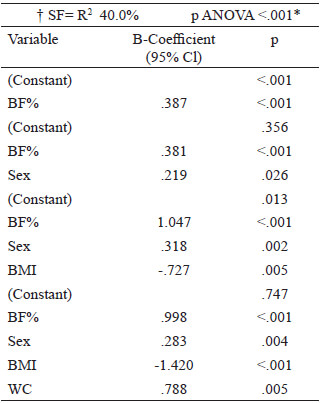
Blood pressure: Measured 3 times consecutively, an integrated aneroid sphygmomanometer kit with a stethoscope (RM 1807001E®) was used. An appropriately sized cuff was selected according to arm circumference to ensure that the length and width of the bladder inside the cuff encircled 80% and 40% of the upper arm, respectively. The stethoscope was placed over the brachial artery pulse, proximal and medial to the cubital fossa, below the bottom edge of the cuff. With the child in a sitting position, blood pressure was measured in the left arm. Three readings were taken at 10-minute intervals, obtaining the average. Systolic blood pressure (SBP) was identified using phase I of the Korotkoff sound and diastolic blood pressure (DBP) was identified by phase V of the Korotkoff sound. SBP and DBP classifications were made according to the reference tables for blood pressure specific to the age, sex, and height of the child. Normal values are Blood sample: After an 8-hour fast, the children had their blood drawn by the staff at a clinical laboratory. A single sample of 4 mL of blood was used for all the tests required. Ferritin levels, hemoglobin, and lipid profile (triglycerides, total cholesterol, HDL cholesterol) were quantified by enzymatic colorimetric method (Spinreact CHOD-POD method). Fasting serum glucose was determined using the oxidative method (Spinreact GOD-POD liquid method) and spectrophotometer (Ultrospec 1000, Pharmacia Biotech Lt., Cambrige, England). LDL cholesterol was calculated using the Friedewald formula: LDLc = CT - (HDLc + TG/5) in mg/dl. An enzyme-linked immunosorbent assay (ELISA) kit (MexLab) was employed to quantify insulin in serum or plasma. Normal values and cut off points: Serum ferritin values in children from 6 months to 15 years old are between 7-142 ng/ml (13). To diagnose anemia, we used the WHO 2011 Hemoglobin cut off points: Children 5-11 years old: >115 g/L no anemia, <80-114 g/L anemia (14). Plasma lipid concentrations (mg/dL) were taken from the "Integrated Guidelines for Cardiovascular Health and Risk Reduction for Children and Adolescents" from the National Heart, Lung and Blood Institute: Total cholesterol: acceptable <170, borderline-high 170-199, high >200; LDL-C: acceptable <110, borderline-high 110-129, high >130; Triglycerides 0-9 years old: acceptable <75, borderline-high 75-99, high >100; Triglycerides 10-19 years old: acceptable <90, borderline-high 90-129, high >130; HDL-C: acceptable <45, borderline-high 40-45, high >40 (15). Based on Aradillas´s et al. study on Mexican scholars, we determined insulin levels between 3.9–10.3 μU/mL, and glucose values between 76.2–96.2 mg/dL (16). The data were analysed with the SPSS version 22 program. The Kolmogorov-Smirnov test was carried out. Descriptive statistics and median ranges were used due to abnormal data distribution. Inferential statistics were performed with the Spearman correlation. Confirmatory analysis using multivariate linear regression was carried out to analyse the interaction of the independent variables with the dependent variable. The method used was stepwise linear regression. This method repeats multiple regression several times, each time removing the weakest correlated variable resulting in the variables that explain the distribution best. Statistical significance was set at a p value < 0.05. Eighty-nine children between 6 and 12 years of age, with a median age (quartiles) of 9.0 years (7.1; 11.0), were analysed. The study population included 42 boys and 47 girls. From those 89 children, 47 were classified with normal weight (52.8%), 18 with overweight (20.2%) and 23 with obesity (25.8%). The median haemoglobin (Hb) level and quartiles was 13.4 (12.8; 13.9) g/dL. When comparing the demographic and anthropometric characteristics and the biochemical variables according to sex, significantly higher glucose values were found in boys (90.0 mg/dL) than in girls (87.0 mg/dL). Likewise, SF levels were significantly higher in boys (45.3 μg/L) than in girls (34.0 μg/L). In the rest of the variables, no statistically significant differences were found (Table 1). When comparing the levels of SF between the children (6-8 years) with the children (9-12 years) no significant difference was found (p=0.658). Table 2 shows that the most frequent biochemical alterations identified were hypertriglyceridaemia (31.5%), followed by low HDL-C (21.3%). No elevated LDL-C was found. Regarding blood pressure, 86 (96.6%) children had normal systolic values and 3 (3.3%) had abnormal values. Two (2.2%) of those children had systolic prehypertension and 1 (1.1%) child had systolic hypertension. Eighty-one (91.0%) children had normal diastolic pressure and 8 (9.0%) children had abnormal diastolic pressure. Three (3.4%) of those children had diastolic prehypertension and 5 (5.6%) had diastolic hypertension. A comparison of the variables according to nutritional status was made. The children were divided into one group with normal weight (n = 47, 52.8%) and one group with overweight and obesity (n = 42; 47.1%). There was a statistically significant difference in all the variables, except for age and haemoglobin (Table 3). Although the levels of SF were normal in both groups, the overweight/obesity group presented with significantly higher levels. Correlations were made between the variables studied (Table 4), identifying a statistically significant positive correlation between SF and BMI, WC, BF%, insulin, diastolic blood pressure and sex. There was a statistically significant negative correlation between SF and HDL-C. No correlation was observed between SF and TC, TGL and LDL-C. Finally, a multiple regression analysis was conducted, introducing the independent variables that were significantly correlated. SF elevation was influenced by the variables introduced, with statistical significance (p <.001). The adjusted r square (.400) indicated that those variables together could explain 40% of the increase in SF. When we analysed the coefficient of each variable, BMI, WC, BF%, diastolic blood pressure, insulin and sex were statistically significant, but when stepwise method was used only BF%, sex, BMI and WC remained statistically significant (Table 5). The association of SF with different cardiovascular markers, adiposity, and metabolic syndrome has been reported in children, but the majority of reports have been carried out on adult (17-22). In the present work, we identified significant correlations between SF and lipid profile (a negative correlation with HDL) and positive correlations with insulin, adiposity (BMI, WC, BF%), and diastolic blood pressure. When analysing those variables in multiple regression, BF%, WC, sex and BMI remained statistically significant. According to nutritional status, significant differences were found when the anthropometric variables, indicators of adiposity, biochemical variables, and blood pressure were analysed. Those values were higher in children with excess body weight, even though SF, lipid profile, and insulin values were within the range of normality for the population studied. A possible explanation is that in obesity, adipose tissue increases the secretion of adipokines, such as tumour necrosis factor alpha (TNF-α) or interleukin-6 (IL-6), which induces resistance to the action of insulin, increasing both glucose and insulin levels. Said increase, together with the high levels of adipokines, leads to the appearance of different adverse effects, including increased oxidative stress, endothelial dysfunction, increased blood pressure, and alterations in lipoprotein metabolism (23). In addition, the resulting inflammatory status affects iron metabolism through hepcidin induction, leading to anaemia of inflammation, (24) an event that has been described in several studies with obese populations (25-27). In iron overload or inflammation, hepatocytes express larger amounts of hepcidin, which is the key regulator of iron homeostasis, leading to less iron absorption and excessive iron sequestration in macrophages. These promotes oxidative reactions and the uptake of lipids due to the down regulation of ferroportin by hepcidin, macrophage accumulation of plaque, vessel wall injury, and an increase risk of atherosclerosis (28). A recent study conducted on Chinese children and adolescents that evaluated iron metabolic status with different BMIs and the association between iron metabolism and dyslipidaemia risk, found significantly higher prevalence rates of dyslipidaemia and iron deficiency in overweight or obese children and adolescents. Ferritin levels were also higher in the children with obesity (29). Those results were similar to ours, in which TC, TGL, and LDL-C concentrations were higher in the obese children, compared with the normal weight children, whereas the levels of HDL-C were lower, suggesting differences in the lipid profile of children and adolescents with different BMIs. As for SF, when we compared values according to sex, boys presented higher levels than girls. Other studies have shown similar results; however, higher levels have also been reported in the same age range in girls (30). According to El Khoury et al. (31), when analyzing SF in subgroups, it was similar between boys and girls for the group of children aged between 8 and 11, while it was significantly higher in boys compared with girls in groups aged 12–14 and 15–18. Some explanations are that iron requirements and absorption increases during childhood and peak during adolescence growth spurt due to body growth, weight gain, and red cell mass expansion as well as for cognitive functions, learning processes, immune response, energy metabolism, and exercise capacity. Due to the controversy, further studies are needed to elucidate a possible regulation of ferritin by hormones (9,31). When comparing SF according to the nutritional status between normal weight group of children and the overweight/obese group, SF levels were normal in both groups, but the overweight/obese group presented higher levels. Several studies have shown that visceral fat, rather than BMI or total body fat, promotes the presence of a more atherogenic lipid profile, insulin resistance, and increased blood pressure (32, 33). Aucouturier et al. (34), established that the distribution of fat in the upper body was associated with the early development of insulin resistance in obese children and adolescents, while Shim et al. (20), suggested that ferritin was associated with insulin resistance and abdominal obesity. It appears unlikely that stored iron could directly influence abdominal fat distribution, but it is possible that abdominal fat may influence SF, as well as HDL cholesterol and triglyceride levels (35). In our study, when we performed a linear regression analysis in which only the variables with significant correlations were introduced (BMI, WC, and BF%, considered adiposity variables), BF% was the highest of the standardized beta coefficients obtained, making it the variable having the greatest impact, followed by WC in the analysis. Evidence shows that serum ferritin concentration is associated with WC and other indices of body fat distribution and obesity (36,37). Another study conducted on Korean adolescents associated SF levels with prevalent dyslipidaemia parameters, and those authors concluded that said association represented a cardiometabolic risk. They found a strong positive association between TC, LDL-C, and TGL and serum ferritin levels in boys, and a significant negative correlation between HDL-C and serum ferritin levels in both sexes. Although the underlying cause of sex-related differences in adolescents is unclear, intrinsic sexual dimorphisms at the molecular and cellular levels, together with the effects of different sex steroid hormones, may play a role (9). In our study population, no LDL-C values were found out of range, but 65.2% of the children, regardless of nutritional status, presented some alteration in the lipid profile, and the main problem was elevated triglycerides. That coincides with reports in the literature, in which hypertriglyceridaemia was the most prevalent dyslipidaemia and one out of every two children were found to have high-risk values (5). Apart from a small sample size, some limitations of our study were that SF is an easily altered acute phase protein, signifying that if there were any inflammatory process in the body, the SF value could mask a low iron reserve. Due to that situation and the fact that there were no complete iron profile analyses, we cannot assure that our population had a positive or negative iron balance. It is also well known that SF levels may be affected by eating habits and dietary factors, (38) which we did not consider in the present study. The stage of pubertal development of the studied children was not determined and this could be a limitation to draw some conclusions, since some studies have described that pubertal development significantly influences serum parameters of iron metabolism (30,31, 39, 40) although no differences in the levels of ferritin was found in the present study between the group of children with 6-9 years and 10-12 years. Another limitation was that even though the methodology employed enabled us to reach our primary objectives, it did not let us establish causality. Despite the existence of sufficient information on the correlation between serum ferritin and obesity, there are few studies in Latin schoolchildren, (41) and no studies in Mexican schoolchildren, so our study serves as a reference for this population. Although we could not find any correlations between SF and TGL, TC, LDL-C and HDL-C in school age children, we observed associations between SF and obesity in Mexican school aged children. We suggest that SF could be used as an indicator for adiposity or metabolic disorders in school children with obesity. Further research, including longitudinal studies, is necessary to confirm these relationships. Recibido: 26/07/2020Statistical analysis
Results
Discussion
Conclusions
REFERENCIAS
Aceptado: 24/11/2020