Introduction
Chronic noncommunicable diseases (NCDs) pose health concerns in the 21st century (1). Their main risk factors are hereditary, race, sex, tobacco use, unhealthy diet, obesity, physical inactivity, and harmful alcohol consumption (2). Early exposures to these factors during childhood or adolescence increase the chances of development of NCDs in the future (1).
Many inflammatory markers have been associated to the pathogenesis of NCDs and used in clinical practice and research. Among these markers are Interleukin-6 (IL-6), Tumor Necrosis Factor α (TNF-α), and C-Reactive Ultrasensitive Protein (hs-CRP) (3). Increased plasmatic levels of these inflammatory markers have been associated with obesity, insulin resistance, dyslipidemia metabolic syndrome, and increased risk of cardiovascular events (4).
Literature suggests that the concentrations of inflammatory markers can be influenced by anthropometric conditions and eating patterns (3). In addition, plasmatic levels of inflammatory markers associated to NCDs could be compromised early in childhood and adolescence (5).
Under this perspective, the need to evaluate eating patterns and global quality of diet in early stages of life is increasing. The Revised Diet Quality Index (IQD-R), an adaptation of the Healthy Eating Index (HEI-1995) developed in the United States, evaluates a combination of different types of food, nutrients, and diet components in relation to the proposed diet recommendations and/or health outcomes (6).
The IQD-R is useful to monitor the eating habits of adolescents and to identify associations with demographic, socioeconomic (7-10), anthropometric factors, and life habits (7,9,11). However, there are few investigations that associated the IQD-R with risk factors for NCDs (12-14) and specially those that associate the index with inflammatory markers in adolescents. Therefore, the present study proposes an evaluation of diet quality and the relationship between Body Mass Index (BMI), diet quality, and inflammatory markers in adolescents of public schools, with the purpose of early identifying the risk factors that may trigger NCDs.
Materials and methods
Cross-sectional study conducted with adolescents, derived from a research titled “Adolescer - Are oral health problems in adolescents associated to risk factors for chronic noncommunicable diseases?”, developed by Universidade Federal do Maranhão (UFMA) from January 2014 to June 2016, with the approval of the Research Ethics Committee from UFMA under protocol number 441.226/2013.
The study was conducted in public schools in the urban area of São Luís - MA, located in the Northeastern region of Brazil and with Human Development Index of 0.768 in 2013. In 2012, there were 42,009 students enrolled in 52 public High Schools.
In order to calculate the sample size, the correlation coefficient of 15%, power of test of 80%, and significance level of 5% were used, resulting in, at least, 347 adolescents. Predicting possible losses, the sample was increased by 10%. For the selection of the participants, a cluster sampling was performed in three stages (school, school year, and class), with random sampling and without replacement. Adolescents of both sexes and aged 17 and 18 years were included, with the purpose of verifying health outcomes after the growth spurt phase. Since the present study used secondary data from the aforementioned research and meeting the inclusion and non-inclusion criteria, 384 adolescentes were included in the final sample.
The data collection was performed with semi-structured forms applied with the adolescents. The following sociodemographic data were collected: age, gender, skin color (white and non-white), mother’s education in years (≤4, 5-8, 9-12, and >12), and economic class (A/B, C, and D/E, which corresponded at the time to U$2,527, U$590, and U$336 of average family gross income per month, respectively) (15).
The lifestyle covered information about alcohol intake and use of cigarettes in the previous year (yes or no), and practice of physical activity evaluated through the Physical Activity Questionnaire for Adolescents (QAFA) (16). The adolescents that were considered active practiced physical activity ≥300min/week, and the remaining were considered insufficiently active (17).
To characterize the nutritional status of the populationwas used o IMC adopting the criteria proposed by the World Health Organization (18) For such, the body weight (kg) was measured with a digital scale (Tanita®, Japan), along with the height (m) using a portable stadiometer (Alturexata®, Brazil).
A 24-hour food record (24hR) was applied to evaluate the food consumption in two nonconsecutive days. The data from the 24hR were converted in energy and nutrients through the software Virtual Nutri Plus®. For the evaluation of the adolescents’ diet quality, the study used the IQD-R adapted for Brazil from the American HEI, based on the Dietary Guidelines for the Brazilian Population in the year of 2006. The IQD-R includes 12 components based on the energetic density (portion/418kJ or 1000 kcal) or percentage contribution of calories in the diet (6).
The specific scores of each component of the IQD-R range from 0 (minimum) to 5, 10 or 20 (maximum). The minimum score corresponds to the non-consumption of the components that are considered healthy or to the consumption above the proposed limit of components that are considered unhealthy; the maximum score of each element is established from the reference intake value, when consumption is equal/inferior to the unhealthy components or equal/superior to the healthy components. The scores for the intermediate intake values are attributed proportionally. The total score of the IQD-R ranges from 0 to 100 points (6).
The IQD-R was used as a continuous numerical variable and categorized in tertiles. For the characterization of the adolescents’ diet quality, a classification proposed by Bowman et al. was adopted: scores <51 - “inadequate diet”; 51 to 80 - “diet that needs modification”; >80 - “healthy diet” (19).
The biochemical evaluation consisted of the measurement of the inflammatory markers (TNF-α, CRP-us, and IL-6) determined by the technology Magpix-Milliplex. Since there are no established reference values for this population, the levels of inflammatory markers were used as continuous numerical variables.
The data were analyzed with the software STATA®14.0. The categorical variables were presented as frequencies and percentages and the numerical, as measures of central tendency and dispersion. The Kolmogorov-Smirnov test was used to verify normality.
The Kruskal-Wallis test was performed to compare consumption of the IQD-R components in tertiles. Spearman’s correlation was conducted between the IQD-R variables, BMI, and inflammatory markers (CRP-us, IL-6, and TNF-α), being classified as weak when r:≤0.29, moderate when r: 0.50-0.69, and strong when r: 0.70-0.89 (20). The level of significance adopted was 5%.
In order to identify the relationship between BMI, diet quality, and inflammatory status of the adolescents, the study adopted the Decision Tree (DT), which established the relationship between independent variables and the response variable. The DT is obtained through successive binary divisions in the data set in order to make the subgroups increasingly more homogeneous in regards to the response variable (21).
To create the DT, the BMIwas considered a dependent variable. The independent variables included gender, physical activity, IQD-R, and inflammatory markers (CRP, IL-6 e TNF-α). The DT was created based on the nonparametric classification method CART (Classification and Regression Tree) to originate a BMI average classification of the adolescents according to the tertiles of diet quality and the individual inflammatory markers. The statistics software SPSS® was used to generate the DT.
Results
There was a predominance of female (56.5%), 17 years old (65.4%), non-white adolescents (84.1%), from class C (64.2%), and whose mothers had ≥9 years of education (46.1%). Regarding the lifestyle of the participants, 51.6% were insufficiently active and, in the previous year, 54.2% reported not having consumed alcohol and 88.5% not smoking (Table 1).
Table 1. Demographic, socioeconomic, lifestyle, and clinical-nutritional characterization of adolescents. São Luís - MA, Brazil, 2014-2016.
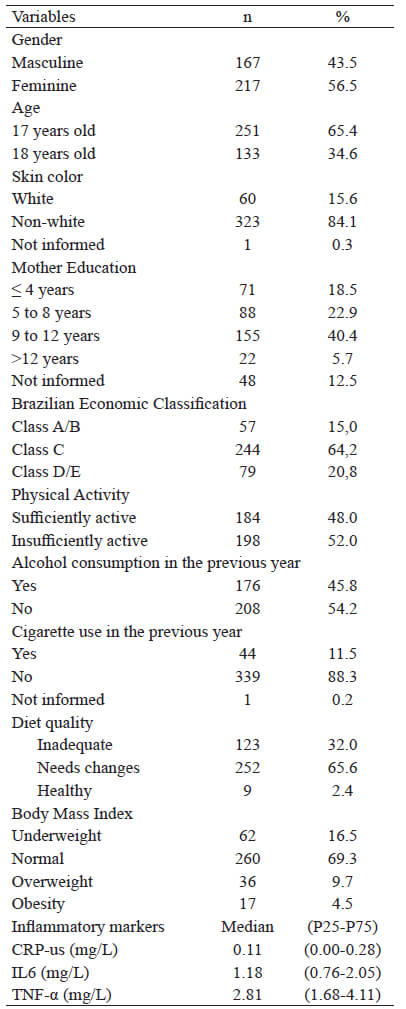
CRP-us: C-Reactive Ultrasensitive Protein; IL6: Interleukin 6; TNF-α:Tumor Necrosis Factor α.
Excess weight was identified in 14.1% of the participants (9.7% overweight and 4.5% obese). The average value (p25-p75) of the CRP-us was 0.11 mg/L (0.00-0.28), of the IL-6 1.18 ml/L (0.76-2.05), and of the TNF-α 2.81 mg/L (1.68-4.11) (Table 1).
Among the evaluated adolescents, 32.0% were classified with an inadequate diet, 65.6% with a diet that needs modification and only 2.4% had a healthy diet (Table 1). The average score of the IQD-R was 55.3 (SD±12.7) and the median, 56.2 with interquartile range of 48.1-63.0. The study found low scores for the following components: whole cereals (0.4 points), whole fruits (2.1 points), total fruits (2.7 points), oils (2.6 points), and milk and derivatives (3.7 points). Higher scores were observed for the following components: meat, eggs, and legumes (9.4 points), saturated fat (7.3 points), total cereals (4.7 points), dark green/orange vegetables and legumes (4.1 points), and total vegetables (4.1 points) (Table 2).
Table 2. Descriptive statistics of the scores of the Revised Diet Quality Index (IQD-R) and its components in adolescents. São Luís - MA, Brazil, 2014-2016.
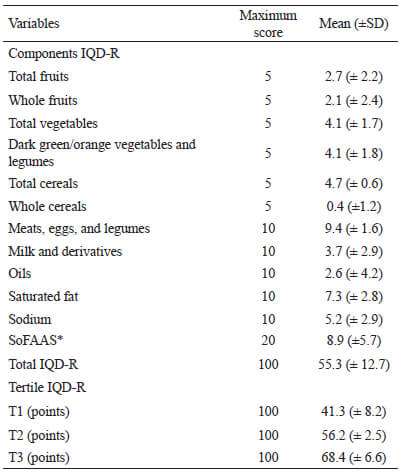
*SoFAAS: calories from solid fat, alcohol, and added sugar.
When compared to the scores of the components per tertile of the IQD-R, the individuals who belonged to the highest tertile presented greater scores for the components “total fruits”, “whole fruits”, “total vegetables”, “green/orange vegetables and legumes”, “meat, eggs, and legumes”, and “oils”, indicating higher consumption of these food groups.
There were also higher scores, indicating lower consumption, for the components “saturated fat”, “sodium”, and “SoFAAS”. There was no statistical significant difference between the tertiles of the IDQ-R for the consumption of “total cereals” and “whole cereals” (Figure 1).
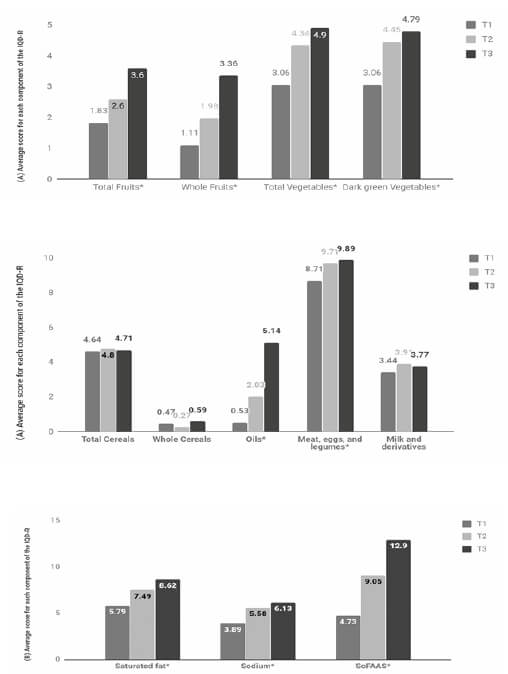
IQD-R: Revised Diet Quality Index. T1: tertile 1. T2: tertile 2. T3: tertile 3. (A) Higher means indicate higher consumption. (B) Higher means indicate lower consumption.*p<0.001. Kruskal Wallis test. Compare the consumption of the components according to the tertile of the IQD-RFigure 1. Average score of each component of the IQD-R according to the tertiles of contribution. São Luís - MA, Brazil, 2014 -2016
The IQD-R did not present correlation with the BMI and the inflammatory markers. The BMI was correlated to all of the evaluated inflammatory markers: CRP-us (r=0.124; p<0.05), IL-6 (r=0.233; p<0.001), and TNF-α (r=0.154; p<0.05); however, with weak magnitude (Table 3).
Table 3. Correlation between IQD-R, BMI, and inflammatory markers in adolescents. São Luís - MA, Brazil, 2014-2016.
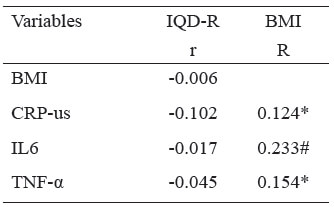
r: Spearman’s Correlation Coefficient. *p<0.05 #p<0.001; PCR-us: C-Reactive Ultrasensitive Protein. IL6: Interleukin 6. TNF-α: Tumor Necrosis Factor α.
The IQD-R did not present correlation with the BMI and the inflammatory markers. The BMI was correlated to all of the evaluated inflammatory markers: CRP-us (r=0.124; p<0.05), IL-6 (r=0.233; p<0.001), and TNF-α (r=0.154; p<0.05); however, with weak magnitude (Table 3).
Figure 2 represents the DT for the studied sample, which identified that the adolescents in the lowest tertile of the IQD-R (T1) presented higher BMI average (22.1±4.3 kg/m2), when compared to the adolescents in the highest tertiles (T2 and T3) (21.5±3.7 kg/m2). Higher levels of IL-6 were observed in those located in the T1 of the IQD-R (1.345 mg/L vs 1.205 mg/L). In the same group (T1), the adolescents that had levels of IL-6 higher than 1.345 mg/L also had greater BMI average (23.6±5.1 kg/m2 vs 20.8±3.0 kg/m2).
Among the participants in the highest tertiles of the IQD-R (T2 and T3) and that presented higher concentrations of IL-6 (>1.205 mg/L), it was observed greater BMI average (22.5±4.2 kg/m2 vs 20.6±2.9 kg/m2). In the adolescents with higher concentrations of IL-6 (>1.205 mg/L) and CRP-us (>0.135 mg/L), the BMI average was also greater (23.8±4.9 kg/m2) (Figure 2).
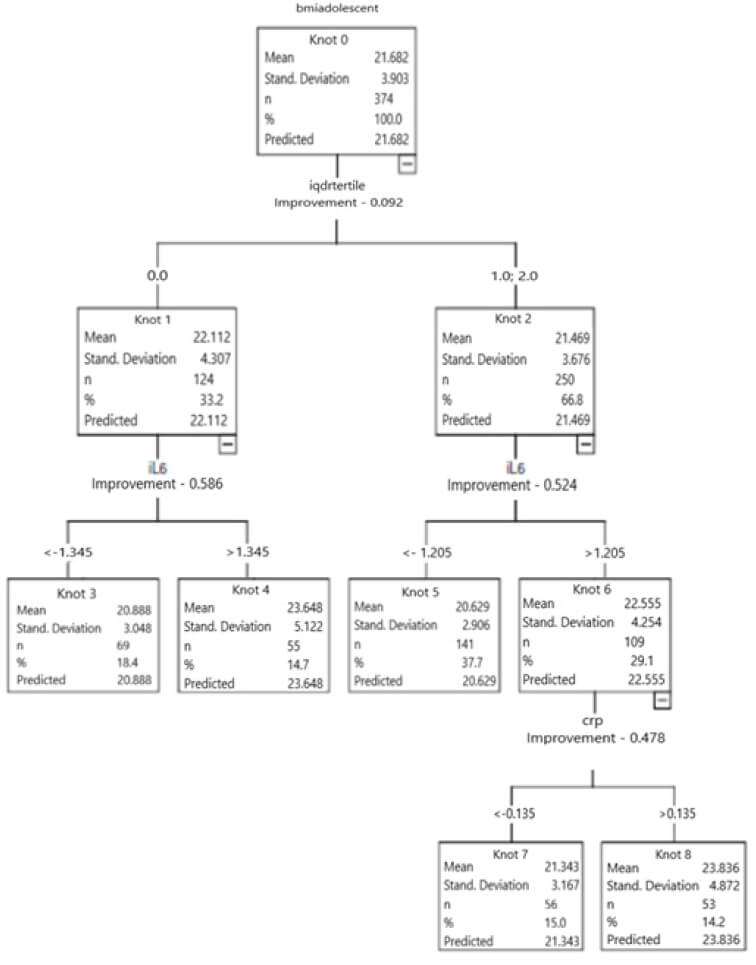
QD-R Tertile 1: tertile 1 of the IQD-R; IQD-R Tertile 2 and 3: tertiles 2 and 3 of the IQD-R. IL-6: interleukin 6; CRP: C Reactive Protein. Dependent variable: BMI; Independent variables: gender, physical education, IQD-R, and inflammatory markers (CRP, IL-6, and TNF-α).Figure 2. Decision Tree of the studied sample
Discusion
In the present study, the mean of the total IQD-R showed that the diet of the evaluated adolescents needs modifications, and only 2.4% of them had a healthy diet. The average values of the BMI ranged with the tertiles of diet quality and with the serum levels of the inflammatory markers (IL-6 and CRP-us).
Endorsing the present study, Andrade et al. also used a 24hR to determine the IQD-R and observed a close average score (59.7) for the adolescents in the Health Survey in the state of São Paulo (ISA-SP) (11). Other national research performed with adolescents identified higher average values of IQD-R, ranging from 62.4 to 75.1 points (7,8,13). However, these authors used the FFQ to evaluate the consumption and to determine the IQD-R. Such instrument can limit the variety of the evaluated food and, possibility, interfere with the scores of the IQD-R.
In this study, the consumption of fruits, whole cereals, milk and derivatives and vegetable oils was below the recommended. The low intake of food and vegetables was observed in European adolescents, comparing to the investigations in other countries such as Australia, Canada, United Kingdom and USA (22).
In Brazil, Castilhos et al. also observed low averages for the consumption of total fruits and milk and derivatives when evaluating the diet of adolescents from Pelotas (RS) (8). The low intake of milk and derivatives may be a result of the omission of breakfast, a practice that is very common in the population. In addition, milk consumption is possibly being substituted by the ingestion of sugary beverages (7). This negative aspect of the present study needs to be reversed, since this habit could compromise the calcium intake, a mineral that is essential for growth and skeletal maturing in adolescents (23).
The low consumption of fruits and whole cereals observed in this study can compromise the ingestion of micronutrients and fibers and contribute to a higher calorie density diet and risks for cardiovascular diseases, obesity, diabetes, and cancer (24).
In the scoring of the “SoFAAS” group, it was not possible to include calories from trans fat due to the lack of information on the software. Nevertheless, the low scores indicate high consumption of other food components in this group. In this investigation, the consumption of “SoFAAS” was similar to that observed in other national studies (7,8,13). It is important to highlight that the high intake of such component is a negative aspect in the diet of the evaluated adolescents, since it indicates high consumption of ultra processed food, constituted mainly of sugars and fats, and which predispose the consumer to the development of NCDs (25).
On the other hand, a positive aspect of the diet was a higher score for “meat, eggs, and legumes”, “vegetables”, and “green/orange vegetables and legumes”, indicating higher consumption of these food. This finding differs from results observed in other national studies with adolescents, which presented low consumption of these groups (7, 26).
Despite the fact that national studies showed reduction in consumption of beans by Brazilians (27), The National Adolescent School-based Health Survey (PeNSE) identified the frequent consumption of such food by adolescents, supporting the results of the present study (28). The ingestion of beans by adolescents in this research contributed to the increase in the score of “meat, eggs, and legumes”, “vegetables”, and “dark green/orange vegetables and legumes”. Therefore, it is possible that the consumption of meats and eggs and dark green/orange vegetables is overestimated due to the inclusion of legumes in the scores of these groups according to the method adopted to calculate the IQD-R. It is important to mention that, although beans are considered a source of low biological value protein, this food is important in the diet of low income populations, because it contributes to the calculation of the total protein in the diet (29).
The consumption of saturated fat was near what is considered adequate (6) and deviated from studies performed with adolescents in the Southern and Central-West regions of Brazil (7, 9), which observed greater ingestion of this nutrient. This was one more favorable aspect of the present study, since the high consumption of saturated fat is associated with alterations in the lipidic profile and development of cardiovascular diseases (29).
In this investigation, the adolescents in the lowest tertile of diet quality had a BMI average greater than those in higher tertiles, suggesting a possible inverted relationship between diet quality and BMI. Similarly, Pinheiro and Atalah identified lower scores of IQD-R associated to excess weight in the Chilean population (12). This relationship is still controversial in the field, since other studies performed in Brazil have not found correlation between BMI and IQD-R (11,13). It is worth mentioning that the mean BMI values among the adolescents in this study are within acceptable levels (30).
Another relevant aspect was that the adolescents located in higher tertiles of the IQD-R did not necessarily have good quality diet. In these tertiles, the scores of the IQD-R were intermediate and only 2.4% of the adolescents in the highest tertile presented scores that indicate good quality diet.
Literature confirms that excess weight, especially obesity, is associated to inflammation. However, it is still inconsistent if inflammation is a consequence of obesity or if obesity is a result of the inflammatory disease (3).
The inflammatory trigger in obesity is metabolic, caused by the excessive consumption of nutrients and energy. Thus, inflammation is capable of compromising metabolic homeostasis over time, affecting different organs (31). Among the adult population, in which the exposure time to excess weight contributes to the development of the inflammatory process, this association seems to be well established. However, the youth population still needs to be more explored and studied in order to investigate if the process of subclinical inflammation would already be present (3).
In the present study, the adolescents in lower tertiles of the IDQ-R had greater BMI average and lower concentrations of IL-6, while those in the highest tertiles had higher BMI averages when they had higher concentrations of IL-6 and PCR-us.
A few studies that found an association between diet and inflammatory markers, after adjustments for the nutritional status, did not observe a preservation of this association. Bibiloni et al., when evaluating Spanish adolescents, verified an association of the dietary patterns of the Mediterranean to higher plasmatic concentrations of adiponectin. At the same time, the Western dietary pattern was negatively associated to adiponectin and positively associated to IL-6 in female adolescents. It is important to highlight that such findings were not significant after adjustment for BMI (32).
Experimental studies suggest that the increase of adiposity is associated to inflammatory markers, cardiovascular diseases and, consequently, to lesions in the coronary arteries since adolescence (33). Silva et al. observed that the CRP content was positively correlated to all of the evaluated anthropometric parameters, including BMI (34). Other authors found positive association between CRP and BMI in adolescents (35).
A positive association between overweight/obesity and IL-6 has been observed among adolescents, reinforcing the hypothesis about the relationship between this marker with lipids metabolism (5).
Arouca et al. emphasize that, in the youth population, a diet that is high in antioxidants and essential nutrients, which is considered healthy, can reduce the concentration of inflammatory biomarkers caused by adiposity. However, a diet that is low in these components seems to contribute to the beginning of the inflammatory process and oxidative stress (36).
This study presented as a limitation the transversal design, which does not allow for the establishment of causality relationships between diet quality, excess weight, and inflammatory markers. Although the IQD-R is an instrument used to evaluate diet quality in populational groups, it does not deduct from the scores of components that are considered healthy when the consumption is excessive (7).
The strength of this study is the use of early inflammatory markers in a young population and the use of two 24hR to investigate the food consumption, which enabled the evaluation of the usual intake of nutrients and diet quality.
Conclusion
It is concluded that the diet quality of adolescents needs modifications. The participants with the worst diet had higher BMI averages and serum levels of IL-6. Similarly, but with less intensity, the adolescents that were in the highest tertiles of IQD-R and had greater levels of IL-6 also presented higher BMI averages. Those that also presented more elevated concentrations of CRP-us had an even greater BMI average, despite being in the highest tertiles of IQD-R.
Acknowledgements
The authors are grateful to the Foundation for Research in the State of Maranhão (FAPEMA), Department of Science and Technology from the Ministry of Health – DECIT, and for the National Council for Scientific and Technological Development – CNPq for the financial support, and to individuals who agreed to participate.
Conflicts of interest
The authors report no conflicts of interest.
References
- World Health Organization. Global Status Report on Noncommunicable Diseases. Geneva, 2014. Disponível em: < https://www.who.int/nmh/publications/ncd-status-report-2014/en/ >. Acesso em: 08 de setembro de 2020.
- Melo S, Cesse E, Lira P, Rissin A, Cruz R, Filho M. Doenças crônicas não transmissíveis e fatores associados em adultos numa área urbana de pobreza do nordeste brasileiro. Ciênc Saúde Colet, 2019; 24(18): 3159-3168.
- Miraglia, F, Mello, E. Como avaliar o processo inflamatório em crianças com excesso de peso? Rev. HCPA. 2012; 32(3): 332-339.
- Teixeira BC, Lopes AL, Macedo RCO, Correa CS, Ramis TR, Ribeiro JL et al. Marcadores inflamatórios, função endotelial e riscos cardiovasculares. J Vasc Bras, 2014; 13(2):108 – 115.
- Guedes J, Neto J, Santos J, Cândido R, Andaki A, Mendes E. Concentrações de IL-6, TNF-α e MCP-1 em crianças com excesso de massa corporal. ABCS Health SCI. 2015; 40(2): 85-91.
- Previdelli A, Andrade S, Pires M, Ferreira S, Fisberg R, Marchioni D. A revised version of the Healthy Eating Index for the Brazilian population. Rev Saude Publica. 2011; 45(4): 794-8.
- Wendpap L, Ferreira M, Rodrigues P, Pereira R, Loureiro A, Silva R. Qualidade da dieta de adolescentes e fatores associados. Cad Saude Publica, 2014; 30(1):97-106.
- Castilhos C, Schneider B, Muniz L, Assunção M. Qualidade da dieta de jovens aos 18 anos de idade, pertencentes à coorte de nascimentos de 1993 da cidade de Pelotas (RS), Brasil. Ciênc Saúde Colet, 2015; 20(11): 3309-3318.
- Tanaka L, Dias R, Medeiros A, Roma T, Mendes E, Souza H. Poor diet quality among Brazilian adolescents with HIV/AIDS. J Pediatr, 2015; 91(2): 152-159.
- Ferrari T, Cesar C, Alves M, Barros M, Goldbaum M, Fisberg R. Estilo de vida saudável em São Paulo, Brasil. Cad Saúde Pública. 2017; 33(1).
- Andrade S, Barros M, Carandira L, Goldbaum M, César C, Fisberg R. Dietary quality index and associated factors among adolescentes of the state of Sao Paulo, Brazil. J Pediatr, 2010; 156(3): 456-60.
- Pinheiro A, Atalah E. Propuesta de una metodología de análisis de lacalidad global de laalimentación. Rev Med Chil, 2005; 133(2):175-82.
- Ramos, J. M. Índice de Qualidade da Dieta e Indicadores do Estado Nutricional de Adolescentes Assistidos no Programa Médico de Família em Niterói-RJ: Projeto CAMELIA. [Dissertação]. Universidade Federal Fluminense, Instituto de Saúde da Comunidade, 2010.
- Torres, R. H. Componentes inflamatórios e antiinflamatórios da dieta, perfil metabólico e aptidão física em meninas adolescentes. [Dissertação]. Universidade Federal do Paraná, Setor de Ciências Biológicas, 2014.
- ABEP. Associação Brasileira de Empresas de Pesquisa. Critério de classificação econômica Brasil - CCEB. São Paulo: ABEP, 2008. Disponível em: < http://www.abep.org/criteriobrasil >. Acesso em: 20 de julho de 2017.
- Farias-Júnior J, Lopes A, Mota J, Santos M, Ribeiro J, Hallal P. Validade e reprodutibilidade de um questionário para medida de atividade física em adolescentes: uma adaptação do Self - Administered Physical Activity Check list. Rev. Bras. Epidemiol., 2012; 15(1): 198-210.
- Biddle S, Sallis J, Cavill N. Young and active? Young people and health enhancing physical activity: Evidence and implication. London: Health Education Authority, 1998.
- World Health Organization. Multicenter Growth References Study Group. WHO Child Growth Standards: length/height-for-age, weight-for-age, weight-for-length, weight-for-height and body mass index-for-age: methods and development. Geneva, 2007.
- Bowmann S, Lino M, Gerrior S. The Healthy Eating Index: 1994-96. U.S. Department of Agriculture. Center for Nutrition Policy and Promotion. 1998.
- Pett MA, Lackey NR, Sullivan JJ. Making sense of factor analysis: the use of factor analysis for instrument development in health care research. Sage Publications, 2003.
- Breiman L, Friedman R, Stone C. Classification and regression trees. Belmont: Chapman & Hall; 1984.
- Ayuso-Mielgo J, Valtueña J, Huybrechts I, Breidnassel C, Cuenca-García M, De Henauw S et al. Fruit and vegetables consumption is associated with higher vitamin intake and blood vitamin status among European adolescents. Eur J Clin Nutr, 2017; 71(4): 458-467.
- Leal G, Philippi S, Matsudo S, Toassa E. Food intake and meal patterns of adolescents, São Paulo, Brazil. Rev. Bras. Epidemiol. 2010; 13(3): 457-67.
- Silva F, Menezes A, Duarte M. Consumo de frutas e vegetais associados a outros comportamentos de risco em adolescentes no nordeste do Brasil. Rev Paul Pediatr. 2016; 34(3): 309-315.
- Louzada M, Martins A, Canella D, Baraldi L, Levy R, Claro R et al. Alimentos ultraprocessados e perfil nutricional da dieta no Brasil. Rev Saúde Pública. 2015; 49(38): 1-11.
- Previdelli, A. N. Padrões de dieta de adolescentes do município de São Paulo e fatores associados: estudo de base populacional [Tese]. Universidade de São Paulo, Faculdade de Saúde Pública 2013.
- Meléndez G, Mendes L, Pessoa M, Sardinha L, Yokota R, Bernal R et al. Tendências da frequência do consumo de feijão por meio do inquérito telefônico nas capitais brasileiras, 2006 a 2009. Ciênc. Saúde Colet. 2012; 17(12): 3363-3370.
- Brasil. Instituto Brasileiro de Geografia e Estatística. Coordenação de População e Indicadores Sociais. Pesquisa Nacional de Saúde do Escolar (PeNSE). Rio de Janeiro, 2016.
- Brasil. Ministério da Saúde. Secretaria de Atenção à Saúde. Guia alimentar para a população brasileira: promovendo a alimentação saudável. Brasília/DF, 2006.
- Bloch K, Klein C, Szklo M, Kuschnir M, Abreu G, Barefaldi L et al. ERICA: prevalences of hypertension and obesity in Brazilian adolescents. Rev Saúde Pública. 2016; 50(1):1-13.
- Saltiel A, Olefsky J. Inflammatory mechanisms linking obesity and metabolic disease. J Clin Invest. 2017; 127(1): 1-4.
- Bibiloni M, Llompart I, Pons A, Tur JA. Dietary factors associated with subclinical inflammation among girls. Eur J Of Clin Nutr, 2013; 67 (12): 1264-70.
- Miranda V, Peluzio M, Franceschini S, Priore S. Marcadores inflamatórios na avaliação nutricional: relação com parâmetros antropométricos, composição corporal e níveis de atividade física. Rasbran, 2014; 6(1): 61-72.
- Silva I, Sanches L, Mello A, Damasceno N. Impacto da proteína-C reativa no risco cardiovascular de adolescentes. Arq Bras Cardiol. 2010; 94(5): 585-95.
- Oliveira AC, Oliveira AM, Almeida MS, Silva AM, Adan L, Adeia AM. Alanine aminotranferase and high sensivity C-reactive protein: correlates of cardiovascular risk factors in youth. J Pediatr. 2008; 152(3): 337-42.
- Arouca A, Moreno A, Gonzalez-Gil E, Marcos A, Widhalm K, Molnár Denes et al. Diet as moderador in the association of adiposity with inflamatory biomarkers among adolescentes in the HELENA study. Eur J Nutr. 2018.