Introduction
The World Health Organization declared coronavirus disease 2019 (COVID-19) a global pandemic on March 11, 2020 (1) and has led to a global public health crisis, so far affecting 107,686,655 people in 223 countries (2). Spain, one of the first countries affected by this health crisis, is the country with the third-highest number of confirmed cases in Europe and seventh in the world when writing this article, reaching a total of 3,041,454 confirmed cases (2).
Several countries ordered widespread lockdown and social distancing measures to prevent severe acute respiratory syndrome coronavirus 2 (SARS-CoV-2) from further spreading. In Spain, the State of Alarm declaration of March 14, 2020 (3) included measures that urged people to stay at home, limiting outings to purchases of food and other essential products, and the closure of shops, restaurants, schools, or sports centers. These measures can affect eating behavior (EB) and other psychological, economic, and social determinants that influence food consumption. Other psychological determinants such as stress or boredom, economic such as income level, or those linked to lifestyle also influence the way we eat (4). These behaviors towards eating are largely determined by the family environment and various economic, social and cultural factors (5).
During the lockdown, several channels have highlighted the importance of maintaining healthy and sustainable eating habits in the household (6,7). Prolonged confinement can cause higher stress or boredom levels, increase the consumption of less healthy food, and other consequences that increase the probability of being overweight or obese (4,8,9). This situation has been apparent during the first weeks of lockdown, where several media outlets highlighted that consumers had purchased more food than e (10). There can also be positive changes in EB due to there being more time to cook, or households might seek to consume healthier foods taking into account the health benefits this can bring (11).
Our research's main goal was to analyze the influence of individual, and household factors on eating behavior and other determinants related to food consumption during home confinement carried out in the Covid-19 pandemic to establish a fundamental basis to offer the necessary services and recommendations more efficiently.
Materials and Methods
1. Participants
A sample of locked-down adults was observed. The information was collected by employing a self-administered online survey open for 24 days (April 17 to May 10 2020), ending with Phase 1 of Spain's de-escalation plan. This survey was open to people aged 18 years or older. Due to our methodology's nature, people with limited computer literacy or without internet access were excluded.
We advertised our research with a web portal, diffusion on social media, and traditional media (press and radio) to encourage participation. Our research followed the Declaration of Helsinki.
2. Survey
The final electronic survey designed in Spanish includes sociodemographic and health data and a survey on eating behavior changes. The survey was uploaded and shared on the Google online survey platform and included an introductory page describing the background and the aims of the survey and ethics information for participants. Participants' answers were anonymous and confidential. For this research, the results obtained have been analyzed, addressing the following aspects:
2.1. Sociodemographic and health data
Sex, age, anthropometric measurements (weight and height), country of residence, duration of lockdown, household type, setting (rural/urban), number of people in the household, ages, number of daily meals, monthly income, religion, special nutritional needs, receipt of food assistance and whether they have observed ‒or not‒ changes in their levels of stress, boredom, body weight, physical activity, and eating habits. Also included is the first question from the food security scale FIES (12) (Before lockdown, were you worried in your household about not having enough food to eat due to a lack of money or other resources?). This question makes it possible to discern between a household with or without uncertainty or concern with food access but does not reveal information on the different degrees of severity of food insecurity.
2.2. Survey on changes in eating behavior.
In the first place, a survey composed of 35 items was designed specifically for this study based on a search of the scientific literature (13-15). Then, through a panel of health and nutrition experts, 12 items were selected by consensus.
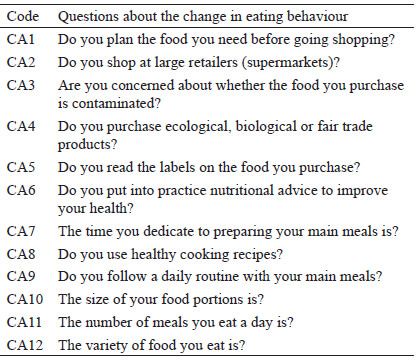
These 12 questions (Table 1) include information related to procuring, preparing and consuming food, quantity and quality of the food, with a Likert-style answer structure: "much less", "less", "the same", "more", "much more", and "do not know".
Table 1. Questions included in the survey related to the change in eating behaviour
The survey was applied again to a subgroup of study participants (n = 91) after 10-30 days to assess reliability. The intra-class correlation coefficient showed satisfactory and high reproducibility (values between 0.59 and 0.88) (p<0.001). Cronbach's alpha for the survey was 0.71.
3. Statistical analysis
SPSS v20 has been used for the statistical analysis. A descriptive analysis was done using mean and standard deviation for continuous measures and the counts and percentages for categorical variables. The Mann–Whitney U test (p<0.05) was applied to analyze the factors studied that presented two classification categories: country (Spain/outside Spain), setting (rural/urban areas), sex (female/male), BMI classification (Overweight or obese/ Underweight or normal weight), lockdown period (less than a month/more than a month), a household with children under 15 (Yes/No) and nutritional needs (Yes/No). For IMB classification, although the data allows a distinction between underweight (3%), normal weight (58%), overweight (27%), and obese (10%), we decided to group the two first and two last categories for the statistical analysis. Table 3 shows the significance levels obtained.
For factors with three or more classification categories, the Kruskal–Wallis test was used (p<0.05): age groups, household type, household size, income, and religion. In the cases where the Kruskal–Wallis test was significant (p<0.05), Mann–Whitney U tests were applied to the two-by-two comparisons of the factor categories. Table 4 shows the significance levels for the Kruskal–Wallis tests and tables Z1 to Z5, the significance levels obtained by the Mann–Whitney U test when the Kruskal–Wallis levels were significant (p<0.05).
Although the survey contains questions that we use as factors with several answers, when carrying out the statistical analysis, some of the answers of the factors have been grouped, which does not distort the orientation of the factor but prevents the formation of categories with a very low number of answers that make a statistical analysis difficult. Whenever possible, we have tried to keep the answers in each category to a similar number.
Results
1057 household surveys were collected, of which two were discarded due to the high number of unanswered questions or DK/NA choices. The results showed that the participants' mean age was 44.15 ± 11,7 years, with 73% females. We must point out that the percentage of DK/NA or blank answers has been meager(approximately 1%), except for the question about household income, which rises to 15%.
1. Descriptive analysis of the results
1.1. Reduction in monthly household income
Globally, 43% of those surveyed answered this question affirmatively; however, it has been one of the questions most affected by the classification factors we chose for the study, which will be commented on later.
1.2. Level of stress, boredom, changes in body weight, and physical activity.
Figure 1 shows the general distribution of percentages of responses to these questions. The effects of the factors on these responses will be analyzed later. In general terms, almost half of the people surveyed declared an increase in stress due to lockdown, and approximately 40% increased boredom. More than half of the population declared no body weight changes, though those who experienced an increase doubled the number of those who experienced a decrease in weight. Lastly, 61% declared a reduction in physical activity.
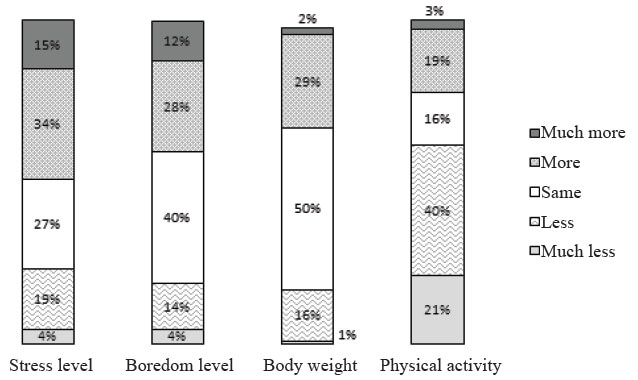
Figure 1. Effect of lockdown in Spainon the parameters of stress, boredom, change in body weight and physical activity
1.3. Concern about a lack of resources for food and receipt of aid through social programs.
6.3% of the households surveyed state that they are concerned about not having sufficient food to eat due to a lack of money or other resources and are affected by some of the factors analyzed. As for the receipt of food aid, 99.3% of those surveyed answered negatively. Consequently, it was not considered for the statistical analysis.
1.4. Change in eating habits
Only 25% saw no change in their eating habits, while 55% declared just a small change, 15% quite a lot, 3% a lot, and 2% a complete change.
1.5. Effects on eating behavior
Figure 2 shows a set of 12 questions related to eating behavior. Most of them have been affected by the factors detailed in the next epigraph. Also, we present statistical significance summarised in Tables 3, 4, and 4.1 to 4.5.
In Figure 2, we can observe the factors that have generally remained the same before and after lockdown: use of large retailers (61%); consumption of ecological food (74%); reading of labels (81%); heeding nutritional advice (69%); use of healthy recipes (66%); routine meal times (65%); portion sizes (74%); the number of meals (62%) and food variety (61%).
The aspects that have seen an increase in interest or frequency are planning (63% in total, 25% much more), concern about food contamination (52% in total, 21% much more), and time dedicated to meals (58% in total, 18% much more).
A quite peculiar behavior is access to large retailers, where 16% have experienced an increase while 23% reduced it, possibly due to the distance between the household and these retailers and limitations on vehicle use.
2. Influence of the factors studied on the eating behavior and other social and health variables during the lockdown in Spain.
Table 2 shows the factors studied and a description of the sample (n 1055). The statistical tests commented on in the statistical analysis section have enabled us to show how the factors studied have had on the global answers (tables 3 and 4), which we will analyze by factor and characterize the study population. There will be no comments on the questions that did not yield statistically significant results, as there has already been a global description of them.
Table 2. Demographic and health information of the respondents (N = 1055) April-May 2020.
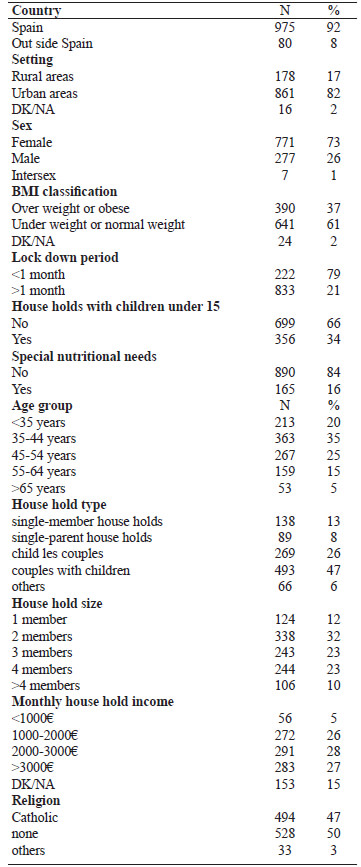
DK/NA= Don't know / No answer BMI=Body Mass Index
2.1. Country
This factor was significant in the answers obtained on reduction in income (Table 3), where the percentage of those surveyed who answered affirmatively was higher in other countries (61%) than in Spain (41%). It similarly affected the answers related to changes in eating habits, wherein Spain 26% of households were not affected, while abroad it was 14%, with a higher percentage who answered quite a lot.
Table 3. Influence of the factors studied on the eating behaviour and other social and health variables in Spain during the lockdown (April-May 2020).
Significance level of the Mann–Whitney U tests applied to assess dichotomous factors (N 1055)
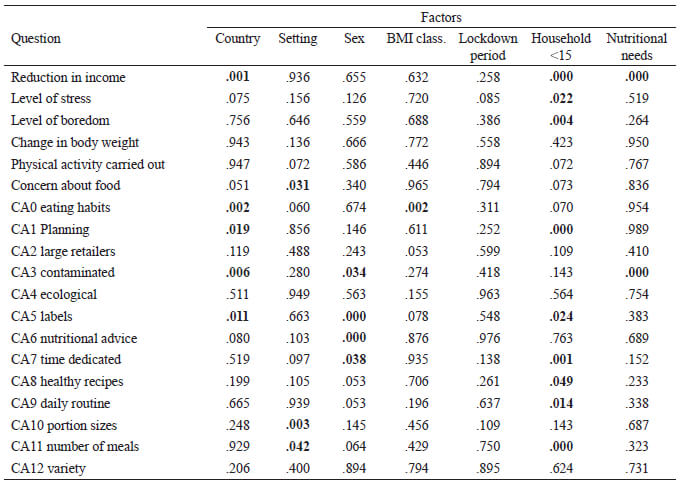
In bold p<0.05
As for planning meals and concern on food contamination in Spain, there is a predominance of those who do not report changes. Abroad, the answer to both questions is higher. Regarding reading labels in Spain, 82% report no change; while abroad, this value falls to 61% both among people who read them and those who do not.
2.2. Setting
There is a strong bias, with 82% of households responding from urban areas (Table 2). This factor affects (Table 3) the question on concern about there being sufficient food available in the household, with a higher percentage of households in this situation in rural areas than in urban areas. The setting also affects the portion sizes, increasing slightly in rural settings and falling somewhat in urban areas. As for the number of meals, there is a higher percentage of households in rural areas.
2.3. Sex
Women completed 73% of the surveys, and the intersex option was chosen by less than 1% of the people surveyed (Table 2); therefore, this option was not used for statistical purposes. This factor influenced the answers (Table 3) on food contamination, where 23% of women reported that they were much more concerned, as opposed to 15% of men. On the other hand, women declare that they read labels less, while men are more concerned about nutritional advice than before lockdown. There is also a higher percentage of women than men who report an increase in time dedicated to preparing food.
2.4. Classification by Body Mass Index (BMI)
This factor only affected the question on changes in eating habits (Table 3), where 27% of the under-/normal weight subjects reported no changes than the 21% overweight. In this group, a higher number reported noticing the change of habits quite a lot.
2.5. Lockdown period
This factor was collected utilizing the related question on weeks of lockdown and contrasted with surveying the questionnaire's date. Although answers were established by weeks, two groups were created for statistical purposes: those who had been in lockdown for less than one month and those in lockdown for a more extended period (79%). In any event, this factor did not affect the questions we use as variables (Table 3).
2.6. Households with children under 15
This factor affects the answers to several questions (Table 3). Regarding income reduction, 38% of those who do not have children in the <15 age range report that it has affected them, and 53% of those who have children. Those who have children, concerning those who do not, present higher levels of stress, plan meals much more, are more likely to read labels, dedicate much more time to meals, prepare healthier food, and increase their daily mealtime routines the number of meals. The opposite occurs with the reported level of boredom, which is higher than those who do not have children.
2.7. Special nutritional needs
Only 16% declare that a member of their household has special nutritional needs (Table 2) and has one condition some answers (Table 3), such as a reduction in income. 58% of those with special nutritional needs have seen a reduction in income. This fact is opposed to 40% of those who do not have such needs. As for the concern on food contamination, 33% indicate that it is much higher among those with nutritional needs than a 19% who do not.
2.8. Age group
Based on the question on age (age was indicated in years), 5 age groups were established: under 35 (20%), 35-44 (35%), 45-54 (25%), 55-64 (15%) and >64 (5%) (Table 2). The age distribution affected the reduction in income (Table 4), producing differences between practically all age groups except among the youngest and those immediately above, among whom there were barely any differences (Table 4.1), while those over 64 were the least affected (89% unaffected) as opposed to an average 57% of the total surveyed who were unaffected.
Table 4. Influence of the factors studied on the eating behaviour and other social and health variables in Spain during the lockdown (April-May 2020). Significance level of the Kruskal–Wallis tests applied to assess factors with more than two categories concerning questions in the questionnaire (N 1055)
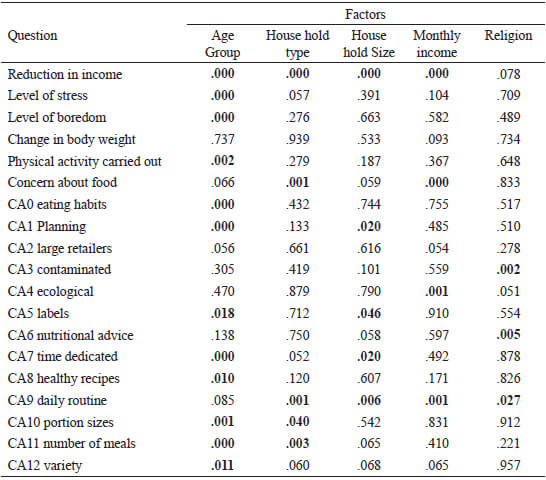
In bold p<0.05
The level of stress also affects most age groups differently (Table 4.1), where generally those over 64 suffer the least changes in stress (64% report the same stress, as opposed to an average of 27% reporting the same stress in the survey), with differences mainly between the youngest and oldest groups (Table 4.1). The same occurs with the level of boredom and physical activity (Table 4), where the youngest group presents differences with the rest of the groups, mainly a smaller impact on the reduction of physical activity (14% maintain their physical activity and 35% increase it) and more boredom (54%) (Table 4.1).
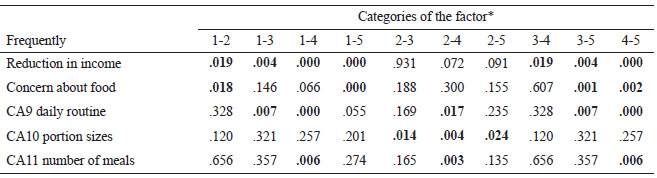
Table 4.1. Significance level of the Mann–Whitney U tests applied to the p<0.05 significance levels in the Kruskal–Wallis tests for the age groups factor (N = 1055)
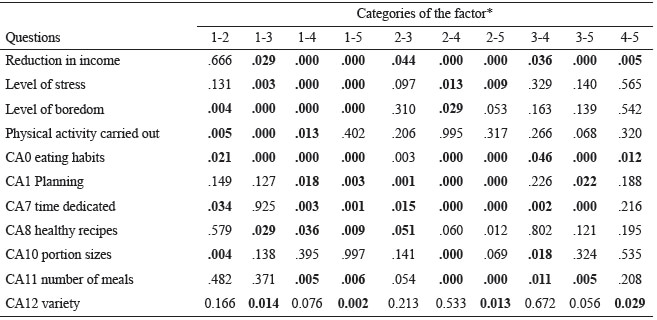
*Categories: [1] Under 35 [2] 35-44 [3] 45-54 [4] 55-64 [5] Over 64. In bold p<0.05.
Changes in eating habits show differences between all the age pairs studied (Table 4.1). Data evidence a progressive increase by age in the percentage of surveyed subjects who report being unaffected (15% among <34 to 53%, among >64).
Changes in planning are also different depending on age groups (Table 4), affecting all the age pairs studied, except for some cases of nearby age groups (Table 4.1). Those who experience the least changes in planning are the higher age groups, and those who report the most are in the 35-44 age group. The time dedicated to cooking is also affected by age (Table 4), and the differences are practically between all the groups formed, though with fluctuations between 40% who report dedicating the same time, 40% some more time, and 18% much more time (Figure 2).
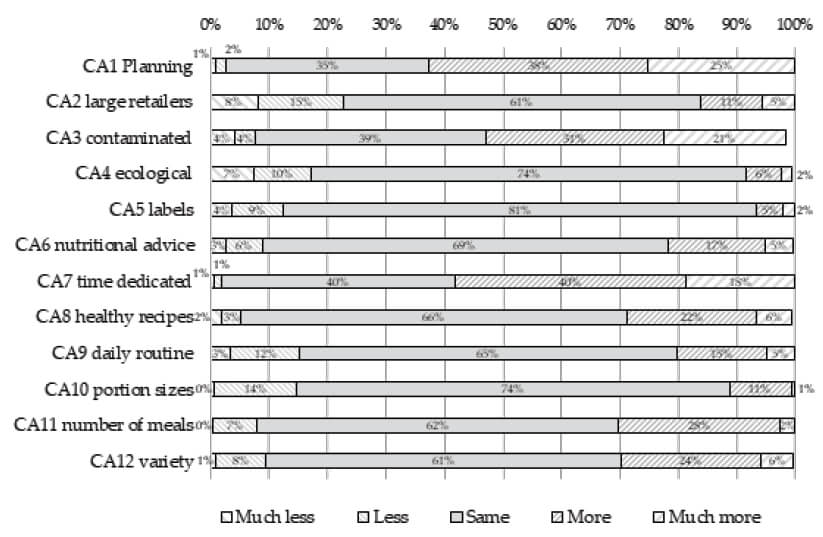
Figure 2. Effect of lockdown in Spain on different parameters of eating behaviour
The use of healthy cooking recipes, which is also influenced by age (Table 4), mainly shows differences between the youngest groups and the highest three age groups and the second youngest with the oldest (Table 4.1).
As for the size of portions, there are differences between the two youngest age groups and between the 55-64 age group concerning the two immediately younger groups (Table 4.1). Regarding the number of meals, the differences are mainly between the two youngest age groups (Table 4.1) concerning the others; 87% of those over 64 maintain the same number, while this percentage progressively falls to 50% among those under 34 who maintain the same number. Another significant difference is observed concerning the variety of the diet. Among the younger age groups, it has increased up to 38%; while those who have least changed this aspect in their diet are over 64 (79% responded the same as opposed to 11% who improved it).
2.9. Household type
This question was structured with 10 possible answers, trying to cover the highest number of cases possible, though the answers focused on four categories and one miscellaneous category of "others". We find 13% are single-member households, 8% single-parent households, 26% childless couples, 47% couples with children, and 6% correspond to "others" (Table 2).
The questions affected by household type (Table 4) are, on the one hand, a reduction in income (Table 4.2) where single-member households are different to all the rest; and childless couples show differences with those who do have children and with the "others" group. Single-member households are those with the smallest percentage experiencing a reduction in income (25%), while couples with children and the "others" group are higher than 50%.
Table 4.2 Significance level of the Mann–Whitney U tests applied to the p<0.05 significance levels in the Kruskal–Wallis tests for the household type factor (N = 1055)
*Categories: [1] Single-member[2] Single Father/Mother sharing the household with one or more children [3] Couple without children in the household [4] Couples sharing the household with one or more children [5] Others. In bold p<0.05
Another question affected is that which refers to concern about not having enough food to cover their nutritional needs (Table 4.2). The households characterized as "others" and single-parent households have a higher percentage in this situation (17% and 9%, respectively) and are significantly different from single-member households or those formed by couples with or without children.
Concerning changes in daily routines for the main meals, we again find how the single-member group differs, particularly with respect to couples with children and single-parent households (Table 4.2). 20% of single-member households report a reduction in maintaining a routine and 5% much less. There is also a difference between the "others" group concerning couples and single-parent households with couples with children.
The size of portions in single-parent households is different from that of couples and "others" (Table 4.2), mainly because the former have reduced their size in a higher proportion (17%). In turn, about the number of daily meals, couples with children behave differently to single-member and single-parent households (Table 4.2), as the former are those who have most increased the number of meals (33%), for the other two groups (16% and 22% respectively).
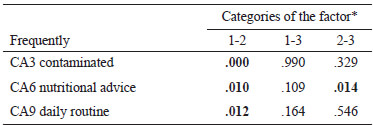
2.10. Household size
This factor was obtained based on the number of members by age in the household. Again, we have grouped them when the number surpasses 4 due to the low number of cases. From 1 to 4 household members, we have 12%, 32%, 23%, 23%, respectively; and with more than four members, 10% (Table 2).
The reduction in income shows differences between all groups (Table 4.3), with the percentage of those affected increases with the number of household members, from 23% (one member) to 56% (>4 members).
Table 4.3. Significance level of the Mann–Whitney U tests applied to the p<0.05 significance levels in the Kruskal–Wallis tests for the household size factor (N = 1055)
*Categories: [1] 1 person [2] 2 people [3] 3 people [4] 4 people [5] More than 4 people .In bold p<0.05
As for planning, households with three members present differences with the others, possibly more influenced by the household type (Table 4.3). An effect can also be observed regarding the change related to the reading label. In particular, we highlight the groups at each end of the spectrum and between households with 2 and 4 members.
Regarding time dedicated to cooking, the households with the most members present fewer changes and are different from the rest (Table 4.3). As for daily routines, group 1 is distinguished from the rest, reducing routines.
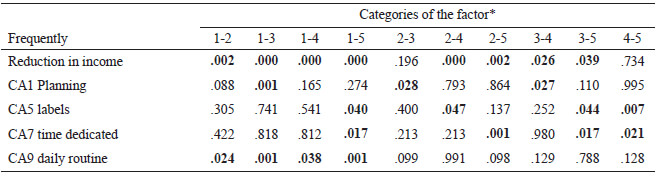
2.11. Monthly household income
Income reduction was affected by this classification (Table 4), observing differences in all groups, except those in the €1000-€2000 and €2000-€3000 ranges (Table 4.4). Generally, the lower the purchasing power, the higher the income reduction. As it can be observed, there is a 68% in the <€1000 group and 29% in the >€3000 group.
Table 4.4. Significance level of the Mann–Whitney U tests applied to the p<0.05 significance levels in the Kruskal–Wallis tests for the monthly household income factor (N = 1055)
*Categories: [1] <€1000 [2] €1000-€2000 [3] €2000-€3000 [4] > €3000. In bold p<0.05
As for the concerns about not having enough food, the households with the lowest income (<€1000) differ from the others (Table 4.4) with a percentage three times higher (27%) than the next income range (€1000- €2000), with 9% of households in this situation. This reduction occurs for the following income ranges (€2000- €3000 and >€3000) where this type of households fall to 3.4% and 2%, respectively.
Differences in the purchase of ecological products between groups mainly occur among those with the lowest purchasing power concerning the rest (Table 4.4), as 27% of those at <€1000 reported purchasing much fewer ecological products, as opposed to the survey average, which was at 7%. Most considerable routine changes in routines occur among the group with the lowest income, concerning the two highest groups and €1000-€2000 for those in the >€3000 group.
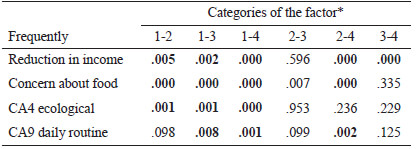
2.12. Religion
Although the list of religious beliefs that it was possible to choose from was pervasive, the answers were practically limited to Catholic (47%) or none (50%), with the rest grouped as "others" (3%) (Table 2). According to religion, the answers that show differences are mainly between Catholic and none (Table 4.5), except for nutritional advice where there are differences between Catholic and "others." This is mainly due to a notable increase following this advice in the "others" group.
Table 4.5. Significance level of the Mann–Whitney U tests applied to the p<0.05 significance levels in the Kruskal–Wallis tests for the religion factor (N = 1055)
*[1] Catholic [2] No religion [3] Other religions. In bold p<0.05
Discussion
The coronavirus (COVID-19) pandemic and the lockdown decreed in many countries affect our lifestyles and, therefore, how we eat. The extensive scientific evidence that links healthy eating with illness prevention and the already worrying situation of rising obesity worldwide (16) makes diet quality and eating behavior even more concerning.
Studies that link lockdown in homes with nutritional state or eating behavior are scarce (4,8,11, 13,15-19). The current situation has been ongoing for several months, and it can even be repeated. There is an urge for an in-depth exploration so as to observe the effects of lockdown on household EB. Thus, it is essential to design short and medium-term strategies that can minimize the adverse effects of lockdown on eating and which can maintain or promote the positive effects.
In line with our study, the EU Commission highlights that the population is aware of the importance of healthy eating (20); however, current trends worldwide towards eating out and dedicating less time to preparing food are related to unhealthy diets (21). The closure of shops, restaurants, schools, transport, workplaces, etc. has undoubtedly varied these less healthy aspects. However, on the other hand, we observe an increase in stress or boredom, changes to eating behavior in households, and reduced physical activity, leading to an increase in overweight and obesity during this period. According to our study results, the setting (urban/rural) in which the lockdown was carried out has not influenced physical activity, stress, or boredom. However, it would be convenient to delve into the effect that green spaces' availability for outdoor activities can have during home confinement.
Previous research had already alerted the permanent effects that body weight changes occurring during relatively short periods can have (22). Situations of stress and boredom can lead to an increase in weight, which can be permanent, particularly in people who were previously overweight or obese (23). 30% of the population surveyed declare that their body weight has increased during these weeks, and we find significant differences regarding changes in eating habits in households with overweight people. The recent studies that highlight obesity as one of the risk factors for severe illness due to COVID-19(18) make it essential to propose strategies such as virtual nutritional advice in the home during the lockdown and the subsequent de-escalation period, to combat the increased prevalence of overweight and obesity (17).
The effect of lockdown on eating behavior in households varies towards negative or positive aspects, which are mainly influenced by the households' structure and the effects that the pandemic has had on the family economy. Focusing on the household, the space where societies' eating culture is developed (5,21), can play an essential role in changing eating behavior; therefore, we analyze it below in detail.
Households with children, as opposed to those without, tend to plan meals much more and pay closer attention to labels, two positive changes highlighted by the FAO in its latest report to avoid food waste (24). Despite higher levels of stress and having suffered a more significant reduction in income, these households dedicate more time to their nutrition, have increased their daily routines, and try to prepare healthier meals. These changes show a recovery of culinary skills and family meals that should be encouraged, as it is a desirable change due to its link to healthy eating (8,11,21). On the other hand, we observe that households with children have increased the number of daily meals. In addition to the link that stress has with a higher number of meals, this difference concerning households without children <15 years old can be explained by the lockdown situation of infancy and early adolescence.
During these weeks, Food Banks in Spain and other countries have highlighted an increase in people requesting food aid (25). Although our study has not analyzedhouseholds benefiting from food aid programs, the percentage of the households surveyed concerned about not having enough food is 6.3%. This situation mainly affects households characterized as "others" and single-parent households. An aspect worth highlighting among single-parent households is the reduction in the size of portions, as the experience of food insecurity in households starts with the uncertainty about the ability to procure food (mild food insecurity) and as the seriousness increases, the size of the portions drops (moderate-to-severe food insecurity) (12). However, these data should be viewed with caution. One limitation of the study has been using a single question from the FIES scale, which does not allow us to identify the severity of household food insecurity. Later studies could delve into this aspect.
Studies on the eating habits of people who live alone are fewer than those on the rest of households(26). In our study, people who live alone report a higher increase in boredom than the rest of households, which has already been linked in previous studies to an increase in unhealthy eating behaviors (27). Some studies indicate that eating alone is associated with faster meals due to lower motivation to cook(26). Although in our study we have not found differences in the time dedicated, we observe that people who live alone have worsened their daily routines for their main meals, probably because this is related to the higher flexibility of work timetables.
We must consider that the health crisis due to the coronavirus disease has affected the population over the age of 64 to a greater extent. This age group is associated with an increased mortality risk due to COVID-19(28). However, similar to the study published recently on the psychological impact of the COVID-19 outbreak on a Spanish population sample (29), being in the older age group is linked negatively to stress. Our study observes the group that is equally or less bored (55% and 21% respectively) and reports the least changes in eating habits.
Another aspect that should be analyzed is related to the eating behaviors that promote more sustainable eating. The purchase of ecological, biological, or fair trade products has been affected by the reduction in income, which has affected 43% of the households surveyed. These data are in line with those observed in the study by Rodríguez-Bermudez et al.(30), which shows that although most people have a favorable opinion about ecological food and consider it beneficial for their health, they point out its price as the main barrier for its consumption.
The sustainability of diets involves reducing the environmental impact so that current and future generations can lead a healthy lifestyle. Food waste in households has continuously grown in recent years and has become an increasingly significant problem (16). The increase in the planning of purchases and meals shown during lockdown (63%) is a change in eating behavior that reduces food waste if prolonged over time (31). Another aspect that influences waste reduction is labeling, as it informs the consumer about the adequate, useful lifetime of a food product (32, 33). We observe that women tend to read labels less during the lockdown, and among households, those who have children or people with nutritional needs read them more. Increasing the consumer's interest in reading the labeling on food can prevent household waste and even promote healthy food choices (33), but it must be accompanied by measures that improve their comprehension. Another suggestion is to provide information and more knowledge for households about strategies that improve the storage and management of provisions (33).
As for purchases of food at large retailers, the results do not show a significant change. Some households have increased their use of this option by 16%, while others have reduced it (23% of the total). These results are probably due to the distances between the household and food retailers and the initial prohibition during the state of alarm of outdoor food markets, which enable the sale of local and seasonal products.
According to the latest European survey on food security, the most important factors influencing the purchase of food by order of relevance are its origin, cost, food safety, and taste (34). After analyzing the results, we see that concern about food contamination has increased (52%), in particular among households where there are people with allergies or some form of food intolerance, although currently there is no evidence that food may be a source or transmission route of the virus (35). However, we consider that this answer may be overestimated and include fears about contamination in food and the packaging. The media's impact on the results of a study published showing that the causative agent of COVID-19 persists for 24 hours on cardboard and several days on other surfaces such as plastics (36) may have influenced the answer. Besides, in this sense, a previous study carried out in Italy, specifically with patients who require a gluten-free diet, found that they did not feel more vulnerable to the disease (35). However, it is crucial to continue insisting on the importance of hygiene measures such as disposing of external packaging before storage, washing hands after shopping, thoroughly cleaning fresh fruit and vegetables, and continuing to insist on other normal rules to avoid food intoxications in the home and ensure food safety (38).
Although a limitation of the study is convenience sampling and there is a bias towards the participation of urban households, this study reflects the effects that lockdown is having on households' eating behavior and will make it possible in the future to analyze whether they are acquired as permanent habits.
Conclusion
We can indicate that confinement has modified some aspects of eating behavior and other determinants of food consumption, depending on some of the individual and household factors analyzed.
There is differentiation by sex at the individual level, being those of the female sex those who have increased concern about food contamination, interest in labeling has decreased, and they spend more time preparing meals. In contrast, interest in nutritional advice has increased among men. Among overweight or obese people, there has been a more significant indicate change in eating habits.
Special attention must be paid to households with children between households, which have seen a more remarkable change in eating behavior. This study enables us to highlight positive like dedicating more time to meals, raising interest in healthy recipes, or strengthening the daily routine of main meals, which, accompanied by more planning in purchases and interest in labeling, leads to healthier and more sustainable eating. On the contrary, people who live alone report a higher increase in boredom, which worsens their daily routines for their main meals.
Acknowledgements
The authors thank Javier Fernández Cruz for the English language revisions.
Disclosure of conflict of interest
No conflict of interest.
Funding
This research does not received external funding.
Referencias
- WHO: WHO Director-General´s opening remarks at the media briefing on COVID-19 - 11 March 2020 [Internet] Available online: https://www.who.int/dg/speeches/detail/who-director-general-s-opening-remarks-at-the-media-briefing-on-covid-19---11-march-2020
- WHO: Coronavirus disease (COVID-19) pandemic 2020 [Internet] Available online: https://www.who.int/emergencies/diseases/novel-coronavirus-2019 (accessed on 15 Feb 2021)
- España. Real Decreto-ley 463/2020, de 14 de marzo, por el que se declara el estado de alarma para la gestión de la situación de crisis sanitaria ocasionada por el COVID-19. Boletín Oficial del Estado, núm. 67, 14 de marzo 2020, páginas 25390 a 25400. Available online: https://www.boe.es/eli/es/rd/2020/03/14/463 (accessedon 27 may 2020)
- Haddad, C., Zakhour, M., Boukheir, M. et al. Association between eating behavior and quarantine/confinement stressors during the coronavirus disease 2019 outbreak. J Eat Disord 8, 40 (2020). https://doi.org/10.1186/s40337-020-00317-0
- Domínguez-Vásquez P, Olivares S, Santos JL. Influencia familiar sobre la conducta alimentaria y su relación con la obesidad infantil. Arch Lat Nutr 2008, 58(3) 249-55.
- Muscogiuri G, Barrea L, Savastano S, et al. Nutritional recommendations for CoVID-19 quarantine. Eur J Clin Nutr 2020. Doi: 10.1038/s41430-020-0635-2
- FAO. Maintaining a healthy diet during the COVID-19 pandemic. Rome, Italy 2020 2 p [Internet]. Available online: Doi: 10.4060/ca8380en
- Cherikh F, Frey S, Bel C, et al. Behavioural Food Addiction During Lockdown: Time for Awareness, Time to Prepare the Aftermath. [published online ahead of print, 2020 May 13]. Obes Surg 2020, 1‐3. Doi: 10.1007/s11695-020-04649-3
- Odriozola-González P, Planchuelo-Gómez Á, Irurtia MJ, et al. Psychological effects of the COVID-19 outbreak and lockdown among students and workers of a Spanish university. Psychiatry Res 2020 doi: 10.1016/j.psychres.2020.113108
- Viejo M. The psychological explanation of the top shopping list during lockdown: beer, olives and crisps. El País 2020 [Internet] Available online: https://elpais.com/espana/madrid/2020-04-01/la-explicacion-psicologica-a-la-lista-estrella-de-la-compra-en-cuarentena-cerveza-anchoas-aceitunas-y-patatas-fritas.html
- Pérez-Rodrigo C, Gianzo Citores M, Hervás Bárbara G, et al. Changes in eating habits during the lockdown period due to the COVID-19 pandemic in Spain. Rev Esp Nutr Comunitaria 2020, 26(2). Doi: 10.14642/RENC.2020.26.2.5213
- Ballard TJ, Kepple AW, Cafiero C. The Food insecurity experience scale [Internet] FAO, 2013 51p [Internet] Available online: http://www.fao.org/documents/card/en/c/1f25bb40-7c4e-49e0-b79b-4d8b5e6354b5
- Lima-Serrano M, Lima-Rodríguez JS, Sáez-Bueno Á. Design and validation of two scales to measure attitudes towards eating and physical activity during adolescence. Rev Esp Salud Pública 2012, 86(3):253-68.
- Guerrero G, López J, Villaseñor N, et al. Design and validation of a questionnaire on eating habits and physical activity for schoolchildren aged 8-12. Rev Chil Salud Pública 2014, 18(3):249-56. Doi:10.5354/0719-5281.2014.33915
- Lera L, Fretes G, Gloria González C, et al. Validity of an instrument for assessing food consumption, food habits and cooking skills in 8-11years old students. Nutr Hosp 2015, (5):1977-88.
- FAO, IFAD, UNICEF, WFP and WHO: The State of Food Security and Nutrition in the World, 2020. Rome, FAO [Internet]. Available online: http://www.fao.org/documents/card/en/c/ca9692en
- Bhutani S, Cooper JA. COVID-19 related home confinement in adults: weight gain risks and opportunities. Obesity 2020 Doi:10.1002/oby.22904
- Kass DA, Duggal P, Cingolani O. Obesity could shift severe COVID-19 disease to younger ages. Lancet 2020, 395(10236):1544-5. Doi: 10.1016/S0140-6736(20)31024-2
- Rodríguez-Pérez C, Molina-Montes E, Verardo V, et al. Changes in Dietary Behaviours during the COVID-19 Outbreak Confinement in the Spanish COVIDiet Study. Nutrients 2020, 12, 1730. Doi: 10.3390/nu12061730
- European Commission. Initiatives on Nutrition and Physical Activity, 2019. Available online: https://ec.europa.eu/health/sites/health/files/nutrition_physical_activity/docs/2019_initiatives_npa_en.pdf
- Méndez CD, Espejo IG. Homogeneity and fragmentation of eating habits in Spain. A response through an analysis of timetables, relationships and nutritional standards. Rev Int Sociol 2018, 76(3):102. Doi: 10.3989/ris.2018.76.3.17.360
- Bhutani S, Wells N, Finlayson G, et al. Change in eating pattern as a contributor to energy intake and weight gain during the winter holiday period in obese adults. Int J Obes 2020, 1-10. Doi: 10.1038/s41366-020-0562-2
- Mediouni M, Madiouni R, Kaczor-Urbanowicz KE. COVID-19: How the Quarantine could lead to the Depreobesity. Obes Med 2020, 100255. Doi: 10.1016/j.obmed.2020.100255
- FAO: The State of Food and Agriculture in the World, 2019 [Internet] Available online: http://www.fao.org/state-of-food-agriculture/en/
- FESBAL: We fight against hunger 2020 [Internet] Available online: https://www.fesbal.org.es/inicio (accessed on 27 may 2020)
- Yates L, Warde A. Eating together and eating alone: meal arrangements in British households. Br J Sociol 2017, 68(1):97-118. Doi: 10.1111/1468-4446.12231
- Kauffman BY, Bakhshaie J, Manning K, et al. The role of emotion dysregulation in the association between subjective social status and eating expectancies among college students. J Am Coll Health 2020, 68(1):97-103. Doi: 10.1080/07448481.2018.1515761
- Du RH, Liang LR, Yang CQ, et al. Predictors of mortality for patients with COVID-19 pneumonia caused by SARS-CoV-2: a prospective cohort study. Eur Respir J 2020, 55(5), 2000524. Doi: 10.1183/13993003.00524-2020.
- González-Sanguino, C.; Ausín B.; Castellanos, MÁ.; Saiz, J.; López-Gómez, A.; Ugidos, C.; Muñoz, M. Mental health consequences during the initial stage of the 2020 Coronavirus pandemic (COVID-19) in Spain. Brain Behav Immun 2020 (In press) Doi: 10.1016/j.bbi.2020.05.040
- Rodríguez‐Bermúdez R, Miranda M, Orjales I, et al. Consumers’ perception of and attitudes towards organic food in Galicia (Northern Spain). Int J Consum Stud 2019, 44(3):206-19. https://doi.org/10.1111/ijcs.12557
- Romani S, Grappi S, Bagozzi RP, et al. Domestic food practices: A study of food management behaviors and the role of food preparation planning in reducing waste. Appetite 2018, 121:215-27. Doi: 10.1016/j.appet.2017.11.093
- Kavanaugh M, Quinlan JJ. Consumer knowledge and behaviors regarding food date labels and food waste. Food Control 2020, 115:107285. Doi: 10.1016/j.foodcont.2020.107285
- Toma L, Costa Font M, Thompson B. Impact of consumers’ understanding of date labelling on food waste behaviour. Oper Res 2020, 20(2):543-60. Doi: 10.1007/s12351-017-0352-3
- European Commission: SpecialEurobarometer Wave EB91.3. Food safety in the EU. EFSA; 2019 104p. Available online: https://www.efsa.europa.eu/sites/default/files/corporate_publications/files/Eurobarometer2019_Food-safety-in-the-EU_Full-report.pdf (accessed on 27 may 2020)
- EFSA: Coronavirus: no evidence that food is a source or transmission route 2020 [Internet]. Available online: https://www.efsa.europa.eu/en/news/coronavirus-no-evidence-food-source-or-transmission-route (accessed on 28 may 2020)
- Van Doremalen N, Bushmaker T, Morris D. H, et al. Aerosol and Surface Stability of SARS-CoV-2 as Compared with SARS-CoV-1. N Engl J Med 2020, 382(16):1564-7. Doi: 10.1056/NEJMc2004973
- Siniscalchi M, Zingone F, Savarino EV, et al. COVID-19 pandemic perception in adults with celiac disease: an impulse to implement the use of telemedicine: COVID-19 and CeD. Dig Liver Dis (In press) 2020. Doi: 10.1016/j.dld.2020.05.014
- AESAN: Covid-19 and food safety. AESAN, 2020 12p. [Internet] Available online: http://www.aecosan.msssi.gob.es/AECOSAN/docs/documentos/noticias/2020/Recomendacion_consumidor_COV19.pdf (accessed on 29 may 2020)