Introduction
Non-communicable diseases (NCDs) are the main cause of death in Europe (1). The causes of NCDs may be genetic, behavioural, and environmental. Epigenetic processes might be modulated by environmental factors such as diet, which has been associated with the onset of several conditions, including obesity and cardiovascular disease (2). A recent study showed that adherence to a Mediterranean diet could exert beneficial health effects through anti-inflammatory action, which is thought to be mediated by epigenetic mechanisms (3).
Specific foods such as fast food and sugar-sweetened beverages (SSBs) have been related to NCDs (4).
Eating habits can have various effects on cardiometabolic health markers, including obesity, lipid profile abnormalities, insulin resistance, and high blood pressure. Furthermore, data suggest that irregular eating patterns make it difficult to achieve a healthy cardiometabolic profile (5).
University students are an especially interesting population, and it has been reported that biomedical education is inefficient in inducing a healthy lifestyle among health science students (6).
Young adults are heavily targeted by fast-food marketing. The food industry has recently undergone dramatic diversifications and now offers newer non-carbonated beverages (e.g. sports drinks) and non-traditional fast-food outlets (e.g. quick-service sandwich shops and ethnic restaurants), which play a key role in the diet of this population group (7). Consumption of non-alcoholic beverages has grown considerably in recent years, and it is in this group that consumption has grown most in Spain (8).
Understanding the relationships between lifestyle factors is important for the development of effective programmes to promote healthy eating and active living in university students.
In this study, we examined the lifestyle habits of first- and fourth-year nursing students in Madrid, Spain. Our objectives were to analyse the consumption of non-alcoholic beverages and the consumption of fast food among these nursing students.
Materials and Methods
We performed a cross-sectional study in a sample of university nursing students during the autumn semester of the academic year 2018-2019. The study was approved by the Institutional Review Board of the Complutense University of Madrid, Madrid, Spain.
Subjects
We recruited a convenience sample of 436 university students who were in their first and fourth year at the Faculty of Nursing, Complutense University of Madrid. During the academic year 2018-2019, a total of 5,914 nursing students were attending public universities in Madrid (9). The sample in the present study represents 7.4% of that population. This data is included to contextualize the research. The sample is not representative of the total university nursing population of the Community of Madrid.
Students were invited to participate, and the purpose of the study was explained. Once they agreed to participate, the students completed a self-administered questionnaire, which was distributed by trained staff.
Self-administered questionnaire
Students reported anthropometric data (weight and height), demographic data (age, gender, marital status), and data on their level of physical activity (daily physical activity: ≥ 10 minutes; weekly physical activity: ≥75 minutes of vigorous and/or ≥150 minutes of moderate physical activity; monthly physical activity: ≥75 minutes of vigorous and/or ≥150 minutes of moderate physical activity in each of the weeks that make up the month; infrequent physical activity: no regular exercise, daily, weekly or monthly) (10). The anthropometric measurements included BMI (11), which was calculated as the weight in kilograms divided by the square of the height in meters and was compared with the WHO standards for categorization of BMI, as follows: ≤18.5 kg/m2 (underweight), >18.5 to 24.9 kg/m2 (normal weight), 25 to 29,9 kg/m2 (overweight), 30 to 34.9 kg/m2 (obesity I), 35 to 39.9 kg/m2 (obesity II), and ≥40.0 kg/m2 (obesity III) (12).
The survey was developed by Nelson and Lytle (13) as a brief screener to estimate consumption of fast foods and beverages. Reliability testing in the validation of the survey showed that item reliability was high, with adequate test-retest agreement. The Spearman correlations and kappa statistics of most items were >0.60. This extremely simple and useful questionnaire was adapted through translation and back-translation to be able to use it in Spanish.
We defined the following beverage groups: i) non-diet cola or carbonated drinks, including soft drinks with added sugars, tonic water, soda, and ginger ale; ii) diet cola or carbonated drinks including the same drinks as in the previous group, but with sweetener; iii) sports drinks such as isotonic drinks with mineral salts; iv) other sweetened drinks, including teas, fruit juice, and lemonade with sweetener; v) milk; vi) coffee and similar drinks (latte, mocha). The reliability analysis based on Armor’s Theta coefficient indicated moderate internal consistency of the items (Armor’s Theta = 0.67).
Fast food was defined as food obtained from restaurants without a waiter/waitress service. Acquisition or consumption of food and beverages in 11 different types of establishments (burger bars, Mexican fast-food outlets, pizza parlours, fried chicken outlets, sandwich or sub shops, Asian fast-food takeaways, bakeries, bagel shops, coffee shops, ice cream parlours, and snack bars) on a dichotomous scale (yes, no). The internal consistency coefficient KR-20 yielded a value of 0.69, indicating moderate reliability.
Statistical analysis
Data were analysed using IBM SPSS Statistics for Macintosh, Version 22.0. We performed a univariate descriptive study of all the variables by calculating the means and standard deviations of the numeric variables and the frequencies and percentages of the qualitative variables. For ordinal variables, the median was also calculated. The analysis of the relationship between quantitative variables (age, weight, height, and BMI) and ordinal variables was performed using the Spearman rho correlation coefficient. The relationship between gender and the frequency of consumption of beverages was assessed using the Mann-Whitney test for 2 independent samples. The association between frequency of physical activity and frequency of food/beverage consumption was assessed using the Kruskal-Wallis test. We used the t test for 2 independent samples to study the association between age and BMI and the consumption (yes or no) of foods and beverages in the aforementioned establishments. Finally, the chi-square test was applied to analyze the relationship between gender (Yate’s correction) and frequency of physical activity and the consumption of foods and beverages in the aforementioned establishments. Statistical significance was set at p<0.05.
Results
A total of 436 students completed the survey (84.1% were women). The analysis of sociodemographic data revealed that 95.2 % were single, 3.7 % were married, 0.2 % were divorced, and 0.9% had another marital status.
The mean age (SD) of the subjects was 22.0 years (6.8); as expected, the fourth-year students were older than the first-year students (24.0 [6.7] vs. 20.7 [6.6] years, p<0.001). The total prevalence and gender-specific prevalence for both groups (fourth-year students vs. first-year students) according to the classification of BMI were as follows:
- Underweight, 26.2 %: female, 28.2 %; and male, 15.9 % (23.9 % vs. 27.9 %).
- Normal, 67.6 %: female, 66.5 %; and male, 72.6 % (73.6 % vs. 63.8 %).
- Overweight, 3.9 %; female, 3.3 %; and male 7.2 % (0.6 % vs. 5.5 %).
- Obesity I, 1.9 %: female, 1.7 %; and male, 2.9 % (1.3 % vs. 2.4 %).
- Obesity II, 0.2 %: female, 0 %; and male 1.4 % (0.6 % vs. 0 %).
- Obesity III, 0.2 %: female, 0.3 %; and male 0 % (0 % vs. 0.4 %).
Participants were also asked about their level of physical activity: 14.9 % of students reported daily activity (17.2 % vs. 13.1 %), 45.7 % reported weekly activity (46.0 % vs. 46.2 %), 12.2 % monthly activity (14.1% vs. 11.5 %), and 27.1 % infrequent activity (22.7 % vs. 29.2 %).
The frequency of beverage consumption (except water) among nursing students is given in Table 1. Statistically significant differences between the groups were only observed for sports drinks, where the prevalence of fourth-year students who consumed them more than twice per week was 5 times higher than in the first-year students (1.2 % vs. 6.1 %, p<0.05).
Table 1. Frequency of beverage consumption.
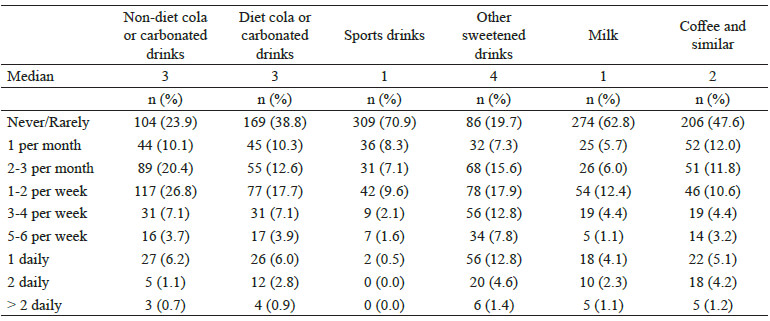
n: sample size
As for water consumption, 49.3 % of the participants drank between 5 and 8 glasses per day in both groups.
Almost one-quarter (24.5 %) of the total encuested students (26.3 % vs. 22.2 %) reported not having consumed food in fast-food outlets during the previous month, whether in a specific establishment, drive-through, or self-service. For most students (63.5 %), the frequency of visits to fast-food outlets was 1-3 times per month (62.6 % vs. 64.8 %). At least 10.4 % of students visited a fast-food outlet once a week (11.2 % vs. 13 %) and a few students visited them once a day (1.6 %). No statistically significant differences were observed in the number of purchases between the groups during the previous month (χ2[S]=2.671; p=0.751>0.05).
Figure 1 shows the fast-food establishments visited in the previous month, most of which were burger bars and pizza parlours. When both groups (first year vs. fourth year) were compared, significant differences were observed in the number of visits to mexican food outlets (16.7% vs. 7.6 %, p<0.05) and outlets selling sandwiches (19.4% vs. 33.2 %, p<0.01) and baguettes (4.8 % vs. 13.3 %, p<0.05). First-year students consumed more bakery products (32.6 % vs. 41.4 %) and ice cream (9.4 % vs. 16.8 %).
The Spearman correlation analysis (Table 2) revealed the following modest and moderate positive relationships:
- Age and BMI with the amount of diet cola or carbonated drinks and water consumed.
- BMI with diet cola or carbonated drinks (frequency) and fast food consumed.
- Non-diet cola or carbonated drinks (frequency) with diet cola or carbonated drinks (frequency), sports drinks, other drinks, milk, and fast food.
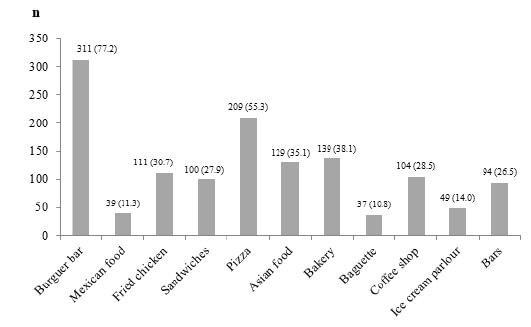
Figure 1. Number of visits (n); percentage (%) of total visitors to establishments.
Table 2. Spearman rho: non-parametric correlations.
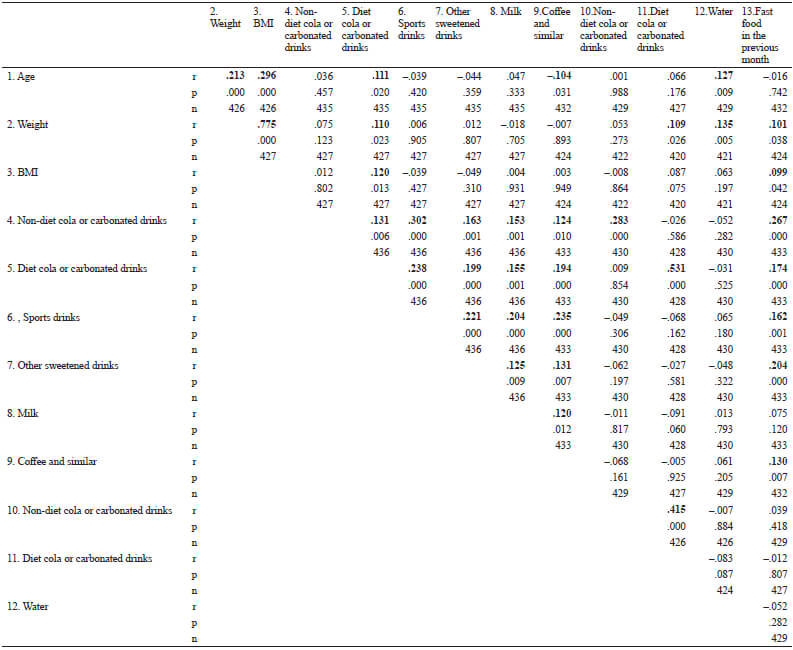
Variables: 1, age; 2, weight; 3, BMI; 4, non-diet cola or carbonated drinks (f); 5, diet cola or carbonated drinks (f); 6, sports drinks (f); 7, other sweetened drinks (f); 8, milk (f); 9, coffee and similar (f); 10, non-diet cola or carbonated drinks (a); 11, diet cola or carbonated drinks (a); 12, water (a); 13, fast food in the previous month. f: frequency; a: amount; r: Spearman’s rho coefficient; p: p value; n: sample size.
No correlations were observed between BMI and consumption of milk (frequency) and fast food.
The frequency and amount of beverage and fast-food consumption are shown according to gender in Table 3. Non-diet cola and carbonated drinks were more frequently consumed by men than women (p<0.05); water was more frequently consumed by men (p<0.05).
Table 3. Consumption of drinks and fast food by gender (Mann-Whitney).
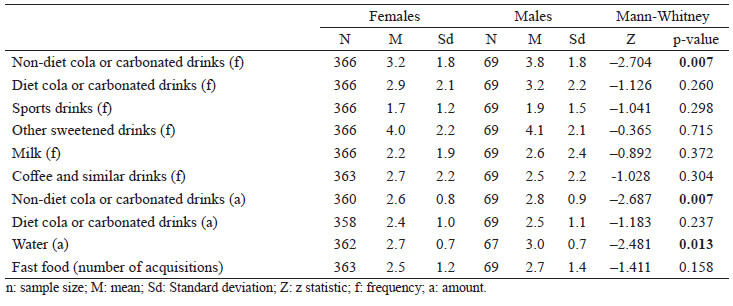
n: sample size; M: mean; Sd: Standard deviation; Z: z statistic; f: frequency; a: amount.
Table 4 shows the number and percentage of visits to the different types of fast-food outlets according to gender and BMI. Men visited fried chicken outlets more frequently than women, whereas women more frequently visited coffee shops. BMI was higher in students who did not visit bagel or coffee shops.
Table 4. Visits to the different types of fast-food outlet according to gender and Body Mass Index
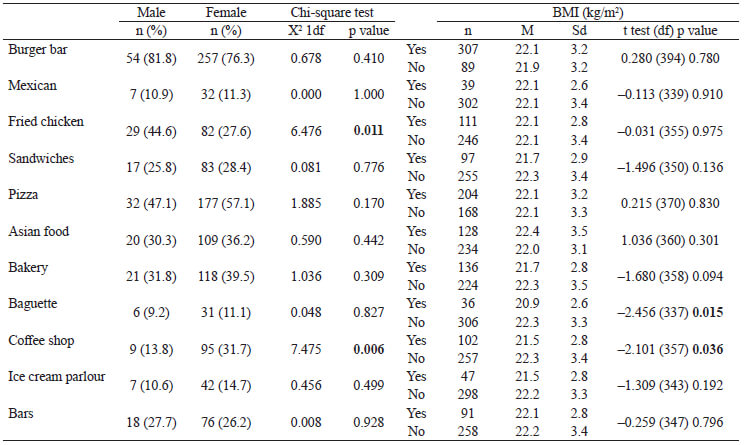
n: sample size; M: mean; Sd: standard deviation; df: degree of freedom
With respect to physical activity, statistically significant differences were only observed for water. The Mann-Whitney test showed, as expected, that respondents with daily or weekly physical activity consumed more water. Finally, no statistically significant relationship was observed between physical activity and visits to fast-food restaurants.
Discussion
The study population comprised 436 adults (84.1% women). The prevalence of underweight was 26.2 %; this percentage washig her among women and first-year students and much higher than that recorded in another Spanish university population in 2016 (8.8 %) (14).
Consistent with the results of other studies performed in Spanish universities (15), more than half of the population investigated had normal weight, and only 6.3 % of the sample (11.5 % of men and 5.3 % of women) had weight excess (BMI ≥ 25 kg/m2). These values were higher in first-year students. Women visited coffee shops more often than men. In addition, people who did not visit these establishments tended to have high BMI values (Table 4).
Although most students in this study had normal weight, the syndrome known normal-weight obesity (NWO), which is defined as normal BMI with excess body fat, must be taken into account (16). In a recent study, Männistö et al (17) reported the proportion of participants with a normal BMI to be 28 % in males and 42 % in females. Of these, 34 % of the males and 45 % of the females had NWO syndrome.
Moreover, some authors (18) found no differences in the prevalence of obesity according to sex, whereas others did (19).
During the last few decades, studies carried out among Spanish adults have showed an increase in the prevalence of overweight and obesity. In the ANIBES study in 2013, the prevalence of overweight and obesity was 35.8 % and 19.9 %, respectively (i.e., 55.7 % of the whole sample; 63.1 % of men and 48.7 % of women were overweight) (20). In the ENRICA study, 2008-2010, the prevalence of overweight and obesity was 37.6 % and 19.7 %, respectively (19), and in a representative sample of Spanish adults the prevalence of overweight and obesity was 34.2 %
and 13.6 %, respectively (20). According to the European Health Survey in Spain in 2020, 16.5% of men aged 18 and over and 15.5 % of women suffer from obesity. Regarding overweight, 44.9 % of men and 30.6 % of women are overweight. In relation to underweight, the prevalence of underweight in women aged 18 to 24 stands out, 8.9 % of women compared to 3.3 % of men (21).
Reduction of body mass is important, especially in young adults with NWO syndrome. Modest weight loss was accompanied by favourable changes in the systemic metabolic profile (22). A recent prospective cohort study covering the period 1968-2005 showed a steep increase in the risk of early heart failure associated with increasing body weight starting at levels that are considered normal and increasing nearly 10-fold in the highest weight category (23).
In the present study, the prevalence of overweight and obesity was 3.9 % and 2.3 %, respectively, with higher values in the first-year students. These results are more encouraging than those of the Spanish adult population and those observed in other universities (18.6 % and 5.8 %, respectively) (14). Confirmation of these results in future studies could signal the beginning of a major change in the prevalence of overweight and obesity. However, it is necessary to point out the limitation of the fact that the BMI was obtained from self-administered data.
Only 14.9 % of the students surveyed reported daily physical activity. Despite being aware of the health benefits of a proper diet and adequate levels of physical activity, students of medicine and related disciplines (physiotherapy, nursing, and midwifery) do not put theory into practice (24).
An analysis of water intake revealed that more than 80 % of the study population consumed less than the recommended 10 glasses. Men consumed more water (Table 3). Both results are consistent with recent published data for the Spanish population (25).
We found that a high percentage of daily beverage intake (Table 1) was accounted for by other sweetened drinks (12.8 %), followed by non-diet cola or carbonated and diet drinks (6.2% and 6.0 %,
respectively). These results are similar to those indicated reported the Spanish Food Consumption Panel for 2018: the highest consumption per capita was observed for soft drinks, followed by juices and nectars (26).
Taking into account frequency and amount (Table 3), men consume a high percentage of non-diet drinks, as described in other countries and in Spain (25).
Moreover, as shown in Table 1, up to 18.8 % of respondents consumed some form of SSBs (non-diet cola or carbonated drinks and sport drinks, mainly in first-year students, and coffee and similar drinks).
The association between consumption of SSBs and its potential effects on obesity and other metabolic disorders has been widely debated for several years. From 1990 to 2000, diets based on healthy items improved globally, whereas diets based on unhealthy items worsened. While consumption of healthier foods and nutrients has increased modestly during the past two decades, consumption of unhealthy foods and nutrients has increased to a greater extent (27).
In many European countries, including Spain, the distribution of macronutrients is worsening. Various associations with total and cause-specific mortality have been established for the different types of dietary fats. Policies to improve labelling or simply remove trans fatty acids from processed food in restaurants and fast foods reduced deaths from coronary heart disease (28).
The incorporation of fast food into the Spanish diet has contributed to increased meat consumption, observed in the last few decades. In Spain, fast food was present in the diet of the most of the respondents, although a high intake is mentioned in other countries (29).
Recent studies show how fast food can affect human health. A cross-sectional study of the U.S. population suggested a consistent, positive association between recent fast-food consumption and exposure to phthalates (phthalates have potentially adverse health effects). Scarce but growing evidence suggests that hamburgers may be a source of phthalates (30). Burger bars were one of the establishments most visited by the students in the present study (Figure 1).
We found that the positive relationships shown in Table 2 agree with findings from other authors. In a sample representing the civilian non-institutionalized U.S. adult population, Park et al. (31) showed that higher intake of drinks such as regular soda, sweetened coffee/teas, fruit drinks, and milk was significantly associated with greater odds of consuming sports and energy drinks (≥1times per week). In addition, fast-food consumption was positively associated with BMI. In the study by De Vogli et al. (32), although all the countries included experienced increases in fast-food consumption and mean BMI over the study period (1999-2008), those that adopted more stringent regulations experienced slower increases in both.
We did not observe remarkable differences between the 2 cohorts studied, possibly owing to the academic nature of the studies, which are not focused on lifestyle modifications. As previously mentioned, the main differences were observed for BMI, higher prevalence of underweight and overweight-obesity, and higher consumption of sports drinks in first-year students, whose preferences for fast-food establishments are also significantly different.
The type of establishment that the students visited in our study depended mainly on gender (Table 4). It is interesting to note that the high frequency of eating at fast-food outlets could be due to the fact that during recent years, fast-food outlets now include more low-energy and low-fat foods on their menus (33), with the result that these establishments now offer a wide range of healthy, low-calorie options. These factors should be taken into account when designing interventions to reduce consumption of fast food.
The main limitation of the present study is that all the data, including height and weight, were self-reported. Consequently, our findings cannot be generalized to all nursing students.
In conclusion, we provide new epidemiological data from a specific university population that, despite their limitations, could be useful to complete or promote more studies that help design appropriate strategies to increase a healthy lifestyle.
More research is needed to determine whether the low prevalence of excess weight and obesity in this study is similar to that observed in other populations. It is also necessary to perform studies on eating habits in Spanish universities to facilitate the development of effective programmes that promote a healthy lifestyle.
Acknowledgements
We thank the Faculty of Nursing for their valuable assistance and help for the correct translation of this manuscript.
Conflict of interest
We declare that there is no conflict of interest.
References
- Hunter RF, Wickramasinghe K, Ergüder T, Bolat A, Oğuz H, Hüseyin, et al. National action plans to tackle NCDs: role of stakeholder network analysis. BMJ. 2019; 365: l1871. https://doi.org/10.1136/bmj.l1871.
- Swinehart S, Fuller R, Kupka R, Conte MN. Rethinking Aid Allocation: Analysis of Official Development Spending on Modern Pollution Reduction. Ann Glob Health. 2019; 85(1):132. https://doi.org/10.5334/aogh.2633.
- Tuttolomondo A, Simonetta I, Daidone M, Mogavero A, Ortello A, Pinto A. Metabolic and Vascular Effect of the Mediterranean Diet. Int J Mol Sci. 2019;20(19):4716. https://doi.org/10.3390/ijms20194716.
- Rico-Campà A, Martínez-González MA, Alvarez-Alvarez I, de Deus R, de la Fuente-Arrillaga C, Gómez-Donoso, et al. Association between consumption of ultra-processed foods and all cause mortality: SUN prospective cohort study. BMJ. 2019;365: l1949. https://doi.org/10.1136/bmj.l1949.
- St-Onge MP, Ard J, Baskin ML, Chiuve SE, Johnson HM, Kris-Etherton P, et al. Meal Timing and Frequency: Implications for Cardiovascular Disease Prevention: A Scientific Statement from the American Heart Association. Circulation. 2017;135(9): e96-e121. https://doi.org/10.1161/CIR.0000000000000476.
- Alzahrani SH, Malik AA, Bashawri J, Ageel S, Mamdouh M, Abdulaziz A, et al. Health-promoting lifestyle profile and associated factors among medical students in a Saudi university. SAGE Open Med. 2019; 7:2050312119838426. https://doi.org/10.1177/2050312119838426.
- Laska MN, Hearst MO, Lust K, Lytle LA, Story M. How we eat what we eat: identifying meal routines and practices most strongly associated with healthy and unhealthy dietary factors among young adults. Public Health Nutr. 2015;18(12):2135–45. https://doi.org/10.1017/S1368980014002717.
- Serrano M, de Lourdes M, Varela G. Composition and Nutrient Information of Non-Alcoholic Beverages in the Spanish Market: An Update. Nutrients. 2016;8(10):618. https://doi.org/10.3390/nu8100618.
- Ministerio de Ciencia, Innovación y Universidades. Estadística de Estudiantes Universitarios. Curso 2018/2019. Educa Base. Available at: http://estadisticas.mecd.gob.es/EducaJaxiPx/Datos.htm?path=/Universitaria/Alumnado/1GradoCiclo/Matriculados//l0/&file=GradoMatriculadosAmbitoCA.px&type=pcaxis
- World Health Organization. Global recommendations on physical activity for health. Geneva: World Health Organization. 2010. Available at: https://www.who.int/publications/i/item/9789241599979
- Ortega FB, Sui X, Lavie CJ, Blair SN. Body Mass Index, the Most Widely Used But Also Widely Criticized Index: Would a Criterion Standard Measure of Total Body Fat Be a Better Predictor of Cardiovascular Disease Mortality? Mayo Clin Proc. 2016; 91(4):443-55. https://doi.org/10.1016/j.mayocp.2016.01.008.
- World Health Organization. Diet, nutrition and the prevention of chronic diseases. Report of a joint OMS/FAO Expert Consultation. Technical Report Series No.916. Geneva: World Health Organization. 2003. Available at: https://www.who.int/nutrition/publications/obesity/WHO_TRS_916_spa.pdf.
- Nelson MC, Lytle LA. Development and evaluation of a brief screener to estimate fast food and beverage consumption among adolescents. J Am Diet Assoc. 2009;109(4):730-734. http://doi.org/10.1016/j.jada.2008.12.027.
- Navarro-González I, Ros G, Martínez-García B, Rodríguez-Tadeo A, Periago MJ. Adherencia a la dieta mediterránea y su relación con la calidad del desayuno en estudiantes de la Universidad de Murcia. Nutr Hosp. 2016; 33(4):901-908. http://doi.org/10.20960/nh.390.
- Soto MN, Aguinaga I, Canga N, Guillén-Grima F, Hermoso J, Serrano I, et al. Modificación del peso corporal de los estudiantes universitarios en Navarra durante los tres primeros años de universidad. Nutr. Hosp. 2015;31(6): 2400-2406. https://doi.org/10.3305/nh.2015.31.6.8686.
- De Lorenzo, A, Del Gobbo, V, Premrov, MG, et al. (2007) Normal-weight obese syndrome: early inflammation. Am J Clin Nutr 85 (1): 40–45. https://doi.org/10.1093/ajcn/85.1.40
- Männistö S, Harald K, Kontto J, Lahti-Koski M, Kaartinen NE, Saarni SE, et al. Dietary and lifestyle characteristics associated with normal-weight obesity: the National FINRISK 2007 Study. Br J Nutr. 2014;111(5):887-894. https://doi.org/10.1017/S0007114513002742.
- Rodríguez-Rodríguez E, López-Plaza B, López-Sobaler AM, Ortega RM. Prevalencia de sobrepeso y obesidad en adultos españoles. Nutr Hosp. 2011;26(2):355-363. http://doi.org/10.3305/nh.2011.26.2.4918.
- Gutiérrez-Fisac JL, Guallar-Castillón P, León-Muñoz LM, Graciani A, Banegas JR, Rodríguez-Artalejo F. Prevalence of general and abdominal obesity in the adult population of Spain, 2008-2010: the ENRICA study. Obes Rev. 2012; 13(4):388-392. https://doi.org/10.1111/j.1467-789X.2011.00964.x.
- López-Sobaler AM, Aparicio A, Aranceta-Bartrina J, Gil Á, González-Gross M, Serra-Majem L, et al. Overweight and General and Abdominal Obesity in a Representative Sample of Spanish Adults: Findings from the ANIBES Study. BioMed Res Int. 2015; 2016:8341487; https://doi.org/10.1155/2016/8341487.
- Instituto Nacional de Estadística. Encuesta Europea de Salud en España 2020. INE-MSCBS. [cited 2022 Mar 18]. Available at: https://www.ine.es/ss/Satellite?L=esES&c=INESeccion_C&cid=1259926457058&p=1254735110672&pagename=ProductosYServicios/PYSLayout¶m1=PYSDetalle¶m3=1259924822888#:~:text=Seg%C3%BAn%20la%20Encuesta%20Europea%20de,5%25%20de%20mujeres%20padecen%20obesidad
- Würtz P, Wang Q, Kangas AJ, Richmond RC, Skarp J, Tiainen M, et al. Metabolic signatures of adiposity in young adults: Mendelian randomization analysis and effects of weight change. PLoS Med. 2014;11(12):e1001765 https://doi.org/10.1371/journal.pmed.1001765.
- Rosengren A, Åberg M, Robertson J, Waern M, Schaufelberger M, Kuhnet G, et al. Body weight in adolescence and long-term risk of early heart failure in adulthood among men in Sweden. Eur Heart J. 2016;38(24):1926-1933 https://doi.org/10.1093/eurheartj/ehw221.
- Likus W, Milka D, Bajor G, Jachacz-Łopata M, Dorzak B. Dietary habits and physical activity in students from the Medical University of Silesia in Poland. Rocz Panstw Zakl Hig. 2013;64 (4):317-324.
- Nissensohn M, Sánchez-Villegas A, Ortega RM, Aranceta-Bartrina J, Gil Á, González-Gross M, et al. Beverage Consumption Habits and Association with Total Water and Energy Intakes in the Spanish Population: Findings of the ANIBES Study. Nutrients. 2016;8(4):232. https://doi.org/10.3390/nu8040232.
- Ministerio de Agricultura, Alimentación y Medio Ambiente. Informe del Consumo de Alimentación en España 2018. 2019. Available at: https://www.mapa.gob.es/es/alimentacion/temas/consumo-y-comercializacion-y-distribucion-alimentaria/20190807_informedeconsumo2018pdf_tcm30-512256.pdf
- Imamura F, Micha R, Khatibzadeh S, Fahimi S, Shi P, Powles J, et al. Dietary quality among men and women in 187 countries in 1990 and 2010: a systematic assessment. Lancet Glob Health. 2015;3 (3): e132- 134 https://10.1016/S2214-109X(14)70381-X
- Allen K, Pearson-Stuttard J, Hooton W, Diggle P, Capewell S, O'Flaherty M. Potential of trans fats policies to reduce socioeconomic inequalities in mortality from coronary heart disease in England: cost effectiveness modelling study. BMJ. 2015;351:h4583 http://doi.org/10.1136/bmj.h4583.
- Varela-Moreiras G. La Dieta Mediterránea en la España actual. Nutr Hosp. 2014;30 (Supl. 2):21-28. https://doi.org/10.3305/nh.2014.30.Sup2.8106.
- Zota AR, Phillips CA, Mitro SD. Recent Fast Food Consumption and Bisphenol A and Phthalates Exposures among the U.S. Population in NHANES, 2003-2010. Environ Health Perspect. 2016;124(10):1521-1518. https://doi.org10.1289/ehp.1510803.
- Park S, Onufrak S, Blanck HM, Sherry B. Characteristics associated with consumption of sports and energy drinks among US adults: National Health Interview Survey, 2010. J Acad Nutr Diet. 2013;113(1):112-119. https://doi.org/10.1016/j.jand.2012.09.019.
- De Vogli R, Kouvonen A, Gimeno D. The influence of market deregulation on fast food consumption and body mass index: a cross-national time series analysis. Bull World Health Organ. 2014; 92 (2):99-107. https://doi.org/10.2471/BLT.13.120287.
- Bleich SN, Wolfson JA, Jarlenski MP. Calorie changes in chain restaurant menu items: implications for obesity and evaluations of menu labeling. Am J Prev Med. 2015;48 (1):70-75.