
 ,
Elba Cubero-Castillo2 ,
Alvaro Azofeifa3 ,
Maria Laura Montero4 ,
Adriana Araya-Morice2
,
Elba Cubero-Castillo2 ,
Alvaro Azofeifa3 ,
Maria Laura Montero4 ,
Adriana Araya-Morice2
Introduction: Rice is a staple food in Costa Rica representing almost 24 % of the total calorie intake in the diet. Consumers have become more quality conscious about the rice consumed, so producers need to focus on the quality of rice along with production. Objective: The aim of this study was to investigate the physicochemical profile and consumer preference of five Costa Rican rice varieties: Palmar 18, Basmatico, Chin Chin, INTA-Miravalles, and CR- 5272. Materials and methods: Proximate analysis, amylose, and mineral content were performed in the raw grain. Two different sessions were performed (n=120 each) to evaluate consumer preference measurements using the John Brown R-Index (RJB) index. The first sensory panel selected the best cooking preparation and the second, the preferred rice variety. Instrumental color measurements (L*, C*, hº, DE) were applied to the cooked rice varieties (76-96ºC for 38 min). Results: Regarding the physicochemical characterization, INTAMiravalles showed the highest protein content (8.2%), while Basmatico and Chin Chin, the lowest. Four varieties presented high amylose content (AC) and INTA-Miravalles reported an intermediate AC. The mineral content varied among varieties. INTA-Miravalles showed the highest N, followed by Palmar 18. The cooking preparation from the regulatory agency was preferred by consumers. The consumers’ preference of the varieties ranked from high to low: Basmatico>Chin Chin=CR5772>Palmar 18=INTA-Miravalles. Conclusions: This study suggests that consumer preference for cooked rice was influenced by physicochemical characteristics such as protein, AC, mineral content, and aromatic attributes. Consumer acceptance is an important factor to consider when new varieties are developed. The water-to-rice ratio during cooking played an important role in cooked rice sensory quality. Arch Latinoam Nutr 2022; 72(3): 185-195.
Key words: rice, cooking preparation, preference measurement, proximal analysis.
Introducción: el arroz es un alimento básico de consumo en Costa Rica que representa casi el 24% de la ingesta total de calorías en la dieta. Los consumidores se han vuelto más conscientes de la calidad del arroz que consumen, por lo que los productores deben enfocar esfuerzos en la calidad y producción del arroz. Objetivo: El objetivo de este estudio fue investigar el perfil fisicoquímico y la preferencia del consumidor de cinco variedades de arroz de Costa Rica: Palmar 18, Basmatico, Chin Chin, INTA-Miravalles y CR-5272. Materiales y métodos: Se realizó el análisis proximal, contenido de amilosa (CA) y de minerales en el grano crudo y color instrumental en el arroz cocido. Se realizaron dos mediciones de preferencia de los consumidores (n=120) utilizando el índice R de James Brown (RJB). En la primera se seleccionó el mejor método de preparación y en la segunda, la variedad de arroz preferido. El color instrumental (L*, C*, hº, DE) se midió a las variedades de arroz cocinado (76-96ºC por 38 min). Resultados: Miravalles mostró el mayor contenido en proteínas (8,2%), mientras que Basmatico y Chin Chin, el menor. Cuatro variedades presentaron un alto CA y el INTAMiravalles reportó un CA intermedio. El contenido mineral varió entre las variedades. INTA-Miravalles mostró el mayor contenido de nitrógeno, seguido de Palmar 18. El método de cocción del ente regulador fue el preferido por los consumidores. La preferencia de los consumidores por las variedades de mayor a menor fue: Basmatico > Chin Chin = CR5772 > Palmar 18 = INTA-Miravalles. Conclusiones: La preferencia de los consumidores por el arroz cocido se vio influenciada por características fisicoquímicas como proteína, CA, minerales y atributos aromáticos. La aceptación de los consumidores es un factor importante cuando se desarrollan nuevas variedades. La relación agua/ arroz durante la cocción desempeñó un papel importante en la calidad del arroz cocido. Arch Latinoam Nutr 2022; 72(3): 185-195.
Palabras clave: arroz, método de preparación; análisis sensorial de preferencia; análisis proximal.
https://doi.org/10.37527/2022.72.3.004
Autor para la correspondencia: Adriana Araya Morice, E-mail: [email protected]
Rice is a staple food for two-thirds of the world’s population and one of the most consumed cereals by humans (1). In Costa Rica, rice consumption represents almost 24 % of total calorie intake. This level of consumption accounts for 49 kg per capita consumption annually (2). Rice also provides around 20 % of dietary protein, approximately 2 % of dietary fat of the daily nutritional requirements, and contributes to nutritionally-significant amounts of micronutrients such as thiamin, riboflavin, niacin, and zinc (3). Oliveira et al. (4) have shown that rice protein has high levels of glutamic acid and aspartic acid but lacks lysine. To provide complete, adequate nutrition, other foods are needed. Central American diets are based on rice, beans, and corn, meaning that the knowledge of the nutritional contribution of different rice varieties is essential to help fighting malnutrition. Many factors influence the nutrient content of rice, including the variety, agricultural practices, postharvest conditions and handling, and cooking preparations (5).
The importance of rice in the Costa Rican diet leads to a well-defined consumer behavior with respect to purchase decisions. Tuorila & Hartmann (6) have indicated that consumer purchasing choices are more associated with sensory characteristics, such as taste and hedonics, rather than nutritional benefits. Costa Rican consumers associate the quality of cooked rice with whiteness and textural attributes, especially looseness. Consequently, consumers have become more quality conscious about the rice varieties they consume. Therefore, producers need to focus on the quality of rice along with production (7).
The Costa Rican rice industry determines which varieties are cultivated based on industrial efficiency and sales. However, the industrial rice quality methods have been traditionally empirical, using different cooking preparations but without standardized sensory evaluation techniques. Consequently, the evaluation of new varieties might be complex and questionable.
Several local efforts have been made to improve the rice varieties by plant breeding techniques to develop well adapted varieties to local field conditions. Efforts have focused on good rice quality characteristics (e.g., agronomical yield, disease resistance, industrial yield, and empirical consumer quality attributes) (data non-published). As a result, some Costa Rican traditional rice varieties currently have appropriate agricultural yields and, therefore, are the most widely cultivated and commercialized varieties include (e.g., "Palmar 18", "Lazarroz FL", and "CR-5272") (2). Other agronomic varieties which have similar cooking and textural characteristics to Palmar 18 could be of agronomical interest, for example "Chin Chin", and "INTA-Miravalles". Other non-traditional aromatic varieties could be of local industrial interest as a novel way to increase profits. For example, the "Basmatico" variety was recently adapted to Costa Rican farming conditions, as an alternative to imported Basmati rice.
A review of literature shows a gap in information related to the chemical and sensory characterization of the abovementioned Costa Rican rice varieties. Physicochemical and sensory characteristics differ among varieties. Moisture and amylose content (AC), starch type, color, grain texture, rupture resistance of the grain and others attributes are deciding factors that affect the quality of cooked rice (8,9). A different chemical composition of rice varieties significantly affects the physicochemical properties, morphology, and cooking properties. AC, amylose: amylopectin relation, cooking techniques, processing methods, ripening and storage, all have a substantial impact on the texture of the cooked rice and therefore the rice sensory profile (10).
The present study aimed to determine the physicochemical characteristics and consumers’ preference for five Costa Rican rice varieties, using a cooking preparation based on consumer preference.
Four indigenous indica rice varieties (CR-5272, Palmar 18, Chin Chin, INTA-Miravalles) and one indigenous aromatic variety (Basmatico) were cultivated and harvested in 2017 in Guanacaste, Costa Rica. These varieties were supplied by the rice germplasm bank of the Seeds and Grains Research Center (CIGRAS) of the University of Costa Rica. All aged rice samples were cleaned, milled, and packed in high-density polyethylene bags. The bags were stored at 25 ºC until either chemical analysis on the uncooked grains or sensory and physical analysis of the cooked rice were performed. This study was conducted from 2017 to 2018.
The proximate composition of raw grains of the five different rice varieties was determined on a dry basis. The following AOAC standard methods were used: water, protein, fat, ash, content determination (11). Total carbohydrates were calculated by difference.
Amylose content was determined with the colorimetric method described by Morrison & Laignelet (12). An aliquot (1 ml) of starch with urea-dimethylsulphoxide (UDMSO) solution was weighed, and 9 ml ethanol were added from a pipette. After 15 min the tube was centrifuged for 10 min at 2000 g, and the supernatant was decanted. The starch was redissolved by cautiously adding 1 ml UDMSO and mixed. The solution was heated at boiling temperature for 20 min, and then filtered into a 100ml flask with 95 ml of distilled water and 2 ml of I2-KI reagent until color development. The absorbance was measured at 635 nm after 15 min.
Total nitrogen was measured using a dry combustion with autoanalyzer by the DUMAS method (LECO FP-2000, LECO, Germany). Fosforous, calcium, magnesium, potassium, sodium, iron, copper, manganesum and borum were determinated by inductively-coupled plasma atomic emission (ICPMS) (NexION® 2000, Perkin Elmer, Spain) (13).
The instrumental color was measured with a tristimulus Color Flex EZ (Hunter Lab, USA) in cooked rice samples using the CP chosen in section 2.3.2. Color measurements were done in triplicates. Prior to colour measurements, the instrument was calibrated with a white and black calibration tile. The colorimeter was set to an illuminant condition D65 (medium daylight) and a 10° (field of view) standard observer. Rice grains were selected to assure similar size and arranged in one layer to perform the measurements. Color was expressed as L* (lightness), C* (chroma/ saturation), and hº (hue) according to the CIELab system. The chroma (C*) value indicates color intensity or saturation, calculated as C*= (a*2+b*2)1/2, and hue angle (hº) was calculated by h° = tan−1 (b*/a*). The DE was calculated as DE=√(L*2+a*2+b*2) (9).
Participants in the study were selected based on their availability and their frequency of consumption of white rice. The participants (age ranged: 18-65 years old) were recruited through social media and purposive sampling on the campus (students, staff, and visitors). The sensory analysis took place at the sensory analysis laboratory of the Department of Food Science, University of Costa Rica (UCR).
Participants were asked to sign an informed consent form in accordance with the sensory procedures of the study that were reviewed and approved by the Scientific Ethics Committee from the UCR (nº VI-4141-2014). The consumers received a compensation for their participation.
A total of 240 consumers participated on Study 1 and 120 consumers on Study 2.
To determine the most preferred cooking preparation (CP), two different rice blends were used. One blend consisted of 50:50 Palmar 18/CR-5272, and the other 50:50 Palmar 18/ Lazarroz FL. The selection of these blends was done based on two criteria, rice varieties most frequently consumed in Costa Rica (CR-5272, Palmar 18, and Lazarroz FL) and blends that are commercially available in the Costa Rican market (2).
Four different CPs were evaluated for each rice blend (Table 1). Cooking was performed using rice cookers with a controlled temperature of 76-96ºC for 38 min.
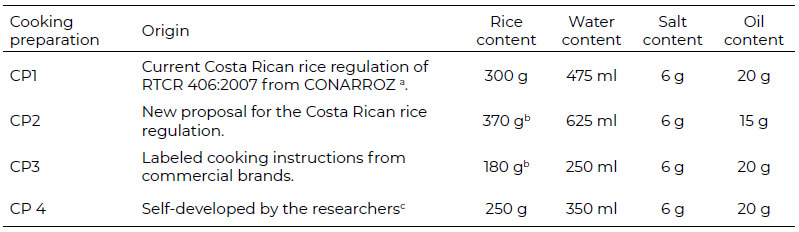
Two different sessions, with 120 consumers each, were held to evaluate each rice blend. In each session, the consumers tested a total of four cooked samples, each one corresponded to a specific cooking preparation. The cooked rice samples were presented at room temperature (21-25 ºC) in a random, counterbalanced order and labeled with three-digit codes. The sensory evaluation was conducted in individual booths provided with white light. Water was available for rinsing in between sample tastings.
The consumers’ preference for the rice samples was determined using the verbal 9-points hedonic scale (from dislike extremely to like extremely) with “only words” method described by Xia et al. (13), with language adaptation to Spanish. The consumers rated their preference, in a paper scale, by placing the sample in front of the appropriate category of the verbal 9-points hedonic scale. In the case that more than one sample was placed on the same category of the scale, the participants were asked to check if the preference within those samples was the same or different. If there was no difference in the preference of the samples, it was a tie and if there was a difference the participants ranked the samples accordingly (14).
The CP with the highest preference was selected for the preparation of samples that were tested on Study 2 and for the determination of color of the five different varieties.
A total of 120 consumers evaluated the five rice samples: CR-5272, Palmar 18, Chin Chin, INTA-Miravalles, and Basmatico.
Rice samples were presented in random and counterbalanced order and labeled with three-digit codes. Samples were evaluated at room temperature (21-25 ºC). The sensory evaluations were made in individual booths under white light and water was used as a palate cleanser. The verbal 9-point hedonic scale was used to rate/rank consumers’ preference of the samples.
Chemical of uncooked grains and color measurements of cooked rice varieties were carried out in triplicate for the five rice varieties. The results are reported as means ± standard deviation. A one-way analysis of variance (ANOVA) test was performed. A mean comparison was performed using Tukey’s test when the factor was significant. The statistical analysis was performed using the software JMP v.8 (SAS Institute, USA).
For preference tests, a non-parametric data analysis was carried out. The data from the 9-point hedonic scale was ranked and analyzed using the R-index values as described by Xia et al. (13). The rice variety ranked first was considered as the most liked and the one ranked fifth as the least liked. The ranking eliminated the effect of any artifactual ties introduced when the labels on the category scale were replaced by numbers.
The R-index values (John Brown R-Index [RJB]) were calculated by comparing every possible pair, getting in this case 12 RJB values. The equation to compare product 1 (P1) and product 2 (P2) was:
R_JB=P1→P2= X/N*100 (1)
where,
P1: Product 1
P2: Product 2
X: Counting the number of consumers who placed ‘P1’ before ‘P2’ in the rankings
N: Number of judges
A critical value was determined to define statistical differences between cooking preparations using RJB tables with a 0.05 alpha and two tails (15). According to Bi & O`Mahony (14), a significant RJB index, with a critical value of 57.22, means that the first sample was more preferred than the other. If the RJB index is lower than the critical value, there are non-significant differences between both samples. When the RJB index is lower than 50%, the major preference is with the other product.
The chemical characterization of the four indigenous indica varieties and one aromatic (Basmatico) is shown in Table 2. Moisture content for the five samples ranged between 11.0 % - 13.0 %. The rice varieties characterized in this study presented protein content values that ranged from 6.6 % to 8.2 %. The fat content of the five varieties ranged from 0.42±0.02 % to 0.75±0.06 % and overall, the carbohydrate content of the varieties ranged from 78.8 % to 81.3 %. Basmatico showed the highest carbohydrate content compared to the other four varieties.
Four of the five varieties presented high AC values (Table 2), Palmar 18 and Chin Chin were the varieties with the highest values (39.0 % - 41.4 %), while INTA-showed an intermediate AC.
Results of mineral content are reported in Table 2. INTA-Miravalles presented the highest level of nitrogen (N); Chin Chin contained the lowest. Calcium (Ca) was only found in the Basmatico variety. Only non-significant differences of sulfur (S) and copper (Cu) were found among all the varieties, approximately 100 mg/100g for S and from 5.00 to 9.33 ppm for Cu. magnesium (Mg) (167 to 300 ppm), phosphorus (P) (1000 to 1200 ppm), potassium (K) (600 to 1300 ppm), zinc (Zn) (16.7 to 20.7 ppm) and manganese (Mn) (9.0 to 15.7 ppm) were also found.
Color parameters are shown in Table 3. Luminosity (L*) values did not differ significantly between samples, values ranged from 72.5 to 79.3. Chroma (C*) values (Table 5) were found to be significantly higher in INTA-Miravalles (12.8), compared to Basmatico, Palmar 18 and Chin Chin (9.6-9.8). The hue values of the five rice varieties ranged from 64º to 74º (Table 5). All varieties presented a DE value below 5.
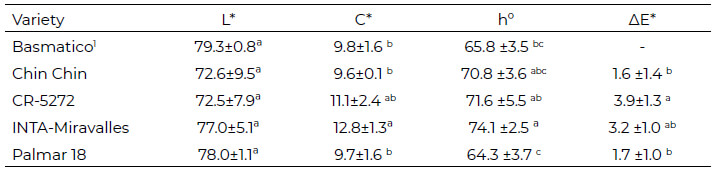
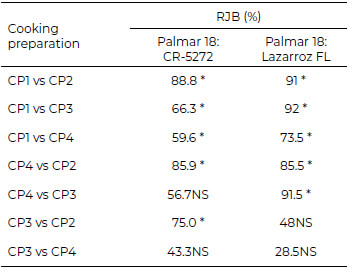
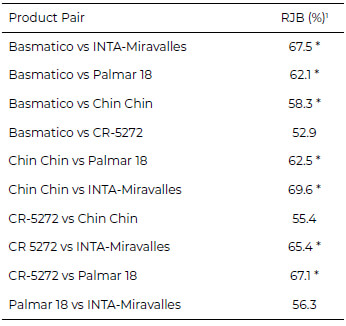
Table 4 shows the RJB index of preference for the four cooking preparations. The rice cooked with CP1 was the most preferred by consumers for both rice blends (Table 4), followed by the rice cooked with CP4 (developed in this study). Rice cooked with CP3 and CP2 were the least preferred by the consumer panel.
The preference R index for the comparison of the five rice varieties are presented in Table 5. Only the RJB higher than 50 % are shown, since lower values indicate that the second product is preferred over the first one. Basmatico was significantly preferred over three of the four varieties. Chin Chin and CR-5272 were significantly preferred over two of the four varieties, without significant differences between these two varieties (P>0,05). Palmar 18 and INTA-Miravalles were always the least preferred when compared to Basmatico, Chin Chin, and CR-5272; however, Palmar 18 was slightly preferred (non-significant) than INTAMiravalles. The preference order from higher to lower according to the RJB index was: Basmatico > Chin Chin = CR-5272 > Palmar 18 = INTA-Miravalles.
Moisture content for the five evaluated rice varieties coincided with the values reported for traditional Costa Rican varieties (16) and those reported in literature for similar rice varieties (7,17). Although moisture content in rice does not significantly affect the textural quality of cooked rice, it plays an important role in the shelf life of the rice. Erma & Rivastav (18) suggest a limit of 12.0 % moisture to assure the stability of rice during a long period of storage.
Regarding the protein content, Basmatico and Chin Chin showed the lowest protein values (P>0.05); therefore, they may provide less nutritional contribution in terms of protein content compared to the other varieties. INTA-Miravalles variety showed the highest percentage of protein. Patindol et al. (19) reported similar values for white rice, between 7.3 and 8.3 %.
Carbohydrates are by far the largest component of cooked rice. Milled rice carbohydrate composition is mainly starch while bran retains the fiber content. Basmatico showed the highest content (P>0.05) compared to the other four varieties (Table 2). These finding are in agreement with carbohydrate percentages reported for white rice varieties (7,17).
However, studies have found that, rather than the starch content, the type of starch, specifically the amylose/amylopectin ratio, is the primarily influence on the textural properties of cooked rice (20). Several studies have related rice quality to amylose content (AC) and rice texture (21). Lu et al. (20) reported that high-amylose rice (higher than 30%) appeared harder and less sticky than low-amylose rice, i.e. waxy rice varieties, those varieties less than 17% AC.
Costa Rican rice consumption habits are linked with very specific cooking quality characteristics. Whiteness and looseness are the attributes that Costa Rican consumers use to define good quality of rice. In Costa Rica, from 2016 to 2017, Palmar 18 was the most harvested variety, not only for its good agronomic characteristics but also because of its good cooking quality according to Costa Rican consumers (2). These characteristics are probably attributable to its high AC (Table 2). On the contrary, the results showed an intermediate AC for the INTA-Miravalles variety, a characteristic which could affect its texture and, therefore, consumer perception.
Although the AC is highly corelated with cooked rice texture, it is not the only factor that affects this parameter, since varieties with similar AC often displayed differences in texture (22). Studies have demonstrated that molecular structure of amylose and amylopectin are also related to hardness, stickiness, and other textural attributes of rice (20,22). Further structural studies might be of interest to determine the textural behavior of the varieties in the present study.
The mineral content is related to the number of ashes in a sample. The five rice varieties contained ash within the established range for white rice, between 0.3 % and 0.8 % (Table 2) (18). Mineral composition of the rice grain depends on the availability of soil nutrients, the degree of milling, and the removal of the outer layer in white rice (7). The high nitrogen (N) content showed for INTA-Miravalles (Table 2) could be linked to lower amylose content in the raw grain (23), also shown from these results. On the contrary, high N content in Chi Chin variety is related to its high AC.
Ca was only found in Basmatico variety. According to Verma and Srivastav (7), Ca content is higher for aromatic varieties than indica varieties, so this could explain our finding. This study showed the Ca content of aromatic rice was similar to that of Basmatico variety. Other minerals S, Cu, Mg, P, K, Zn and Mn showed similar values as the ones reported in the literature for similar varieties. Erma and Rivastav (18) reported slightly lower values than those found in this study for Mg content (100 - 183 ppm) and K (265 - 500 ppm), but similar values for Zn content (9.0-17.0 ppm). Wang et al. (23) found Zn (19.4 - 21.4 ppm) and Mn (10.3 - 11.2 ppm) values like those of this study, while Mg (98 - 177 ppm) values were again slightly lower.
Whiteness is one of the most important attributes of white rice (10). Champagne et al. (24) found similar values (76.2 -78.1) for Basmati premium rice samples, meaning that the five varieties evaluated in this study had bright colors comparable to those in premium rice.
Higher C* values for INTA-Miravalles are indicative of this variety having a grayer, duller color compared to Basmatico, Palmar 18 and Chin Chin. Syafutri et al. (9) reported lower C* values (from 5.63 to 7.10) affected by cooking preparations and not by rice variety. In contrast, in our study a standardized cooking preparation was used to cook the five varieties; thus, the reported C* differences are related to the varieties, their chemical composition and specific changes each underwent during the cooking process.
INTA-Miravalles, Chin Chin and CR-5272 varieties presented higher hº values, aligning towards green. Hue angles around 60º-70º are towards yellower, greener colors. This range of color angles is expected in polished rice, which turns white color after milling (26).
However, the change in direction towards yellow-green, in combination with a high L*, is perceived as white. Similar values were found by Syafutri et al., (9) in non-waxy Indonesian rice varieties.
In this study, the comparison reference was Basmatico, as it turned out to be the preferred sample in the sensory preference test. Only CR-5272 presented a significantly high (P<0.05) DE compared to the other three varieties. Nevertheless, as DE values in the four varieties were below 5 (Table 5), therefore, the difference can be distinguished but is not obvious (27). Delta E values over 5 units mean that the difference against a reference is evident to the human eye (27). Consequently, the results suggest that color did not affect the consumer preference for the rice varieties evaluated below.
The R index is based on comparisons rather than absolute values (14). The value given to a sample depends on the score of the other samples. Therefore, the results might vary if other cooking preparations are evaluated.
The results of the present study showed that consumers preferred the rice cooked with CP1 rather than CP3 (Table 4). Even though, CP1 is the official rice cooking preparation (16), the rice industry is suggesting, in their rice bag labels, other cooking preparations (CP3). This finding is relevant in promoting the use of the governmental cooking preparation. The amount of cooking water appears to have influenced the consumers’ preference. The intermediate water amount of CP1, was probably the just-about-right amount of water required to obtain the preferred cooked rice quality (Table 4). Although CP4 also used intermediate water content, the quantity was not enough to achieve the desired quality of cooked rice. The highest (CP2) and the lowest (CP3) amounts of cooking water negatively impacted the consumer preference.
Several studies have related consumer preference and liking of cooked rice to the preparation used for cooking because of its direct effect on the behavior of the rice kernels during cooking and on the final quality. Also, the cooking quality of rice is influenced by the physical and biochemical characteristics of the raw grain (8,25,28). Thus, selecting the correct cooking preparation based on specific consumer demands is essential for the rice industry. Therefore, the rice industry will be able to provide cooking instructions to the consumers and to have a consistent quality control tool for the evaluation of rice quality.
Regarding consumer preference, because CP1, the current governmentally approved method, is the technique that resulted in the highest consumer preference, CONARROZ should not modify the established cooking preparation from the current regulations (CP1) to the new proposal (CP2).
Basmatico was the most preferred variety. Rice consumers, especially in countries where rice is a staple food, have strong preferences for the sensory characteristics of rice (25). Studies have related aroma and flavour as key attributes of consumer liking of cooked rice (29). Thus, the aromatic attribute of Basmatico may have been a determining factor in the increased preference for this variety, over the non-aromatic varieties.
It has been demonstrated that flavour is negatively affected by the nitrogen content (30). The high nitrogen content of the INTAMiravalles variety (Table 2) may explain its lowest preference (Table 5).
On the other hand, in terms of texture characteristics, high AC is related to the looseness and hardness of rice, both important sensory qualities for Costa Rican consumers. The highest ACs were observed in Palmar 18 and Chin Chin; however, Palmar 18 was one of the least preferred varieties. Although the AC is related to texture, the size and arrangement of starch molecular structures might influence the absorption of water during cooking and, therefore, the final texture quality (hardness). Basmatico, Chin Chin and CR-5272 presented a high AC measurement; such high values suggest that texture accounts for the preference for these varieties. On the other hand, the anticipated lower preference for the INTAMiravalles variety might be influenced by its intermediate AC (Table 2), and therefore, inferior textural quality.
Chin Chin variety was determined to be the second most liked variety (Table 4). Chin Chin is not commonly cultivated due to inefficient varieties and disease susceptibility, both of which require special agronomic management (31). However, results obtained suggests a higher preference for Chin Chin compared to the most widely cultivated variety (Palmar 18). This preference level points to the potential of Chin Chin as a new variety for commercialization. Further studies must be executed to improve field performance. To the knowledge of these authors, there are no published references of similar studies in rice varieties developed in Costa Rica.
The cooking quality of rice depends not only on the chemical composition of the varieties and rice blends, but also on the method of preparation. The amount of water used during rice cooking is a very important factor that influences consumer preferences. In this study, rice cooked by the official cooking preparation of CONARROZ (CP1) was the most preferred by consumers, probably due to the use of just-about-theright amount of water. In striving to achieve a prefer quality of cooked rice, the rice industry should choose and recommend CONARROZ cooking preparation to ensure optimal consumer satisfaction, along with Chin Chin as a potential new variety for commercialization. The results of this study contribute to the literature by relating information about physicochemical characteristics of Costa Rican rice varieties to consumer preference, and it demonstrates that the chemical characterization and the preference measurement play important roles in the selection of new rice varieties, rather than only using the agronomical improvement approach traditionally applied.
This work was supported by the University of Costa Rica under the grant [735- B7-055].
These authors acknowledge Carolina Cortés, from the Laboratory of Chemistry of CITA, for the chemical analysis contribution and Elizabeth Siler, from the Washington State University, for the editing and proofreading contribution to this paper.
The authors state that there are no conflicts of interest.
Recibido: 24/04/2022
Aceptado: 01/07/2022