
 ,
Mariane H. de Oliveira1 ,
Débora B. dos S. Pereira1 ,
Graciela C. Gregolin1 ,
Wolney L. Conde1
,
Mariane H. de Oliveira1 ,
Débora B. dos S. Pereira1 ,
Graciela C. Gregolin1 ,
Wolney L. Conde1
. Introduction. We propose the following hypothesis: ultraprocessed foods in the global food supply contribute to the worldwide increase in obesity. Objective. To analyze the association between a higher consumption of ultraprocessed foods and the obesity in adulthood in the United States. Materials and methods. United States National Survey of Health and Nutrition Examination (NHANES) (2009-2018) data were used. We included subjects of both sexes, aged between 18-64 years old, with anthropometric, health, income, race/ethnicity and physical activity (PA) data. The association between the ultraprocessed food intake and obesity was calculated using a binomial logistic regression. In addition, we also evaluated a subsample with subjects who did not consume more than their adequate daily energy requirements. Results. We evaluated 13,310 subjects in total, and 4,788 in our subsample. Of these 33% were committed to obesity, and in the subsample the prevalence was even higher, around 49%. In our analysis, we found five factors (ultraprocessed food consumption, sex, age, race/ethnicity, and sedentary lifestyle) that were positively associated with the development of obesity. Compared to subjects who consumed less than 20% of ultraprocessed foods, subjects who consumed between 20 to 40% of ultraprocessed food had 16% more odds of developing obesity [95%CI:1.06–1.26]. For the subsample, the odds were even higher, being around 27% [95%CI:1.11–1.46]. Conclusions. Our results showed a positive association between obesity and the amount of ultraprocessed food consumption, even though, in those who consumed no more than their adequate daily energy requirements. Arch Latinoam Nutr 2023; 73(2): 113-121.
Keywords: obesity; adult; industrialized foods; food consumption; food Industry; sedentary behavior.
Introducción. La hipótesis planteada es que los alimentos ultraprocesados contribuyen al aumento de la obesidad a nivel global. Objetivo. Analizar la asociación entre un mayor consumo de alimentos ultraprocesados y la obesidad en adultos en Estados Unidos. Materiales y métodos:. Se utilizaron datos de la Encuesta Nacional de Examen de Salud y Nutrición de los Estados Unidos (NHANES) (2009-2018). Se incluyeron individuos de 18 a 64 años de ambos sexos, con datos antropométricos, de salud, ingresos, raza/ etnia y actividad física. La asociación entre la ingesta de alimentos ultraprocesados y la obesidad se calculó utilizando un modelo de regresión logística binomial. Además, evaluamos una submuestra con sujetos que no consumieron más que sus requerimientos energéticos diarios adecuados. Resultados. Evaluamos 13.310 sujetos en total y 4.788 en nuestra submuestra. De estos, el 33% comprometidos con la obesidad, y en la submuestra la prevalencia era aún mayor, alrededor del 49%. En nuestro análisis encontramos cinco factores (consumo de alimentos ultraprocesados, sexo, edad, raza/etnia y sedentarismo) asociados positivamente con el desarrollo de obesidad. En comparación con los sujetos que consumían menos del 20% de los alimentos ultraprocesados, aquellos que consumían entre el 20 y el 40 % de los alimentos ultraprocesados tenían un 16% más de probabilidades de desarrollar obesidad [95%IC: 1,06-1,26]. Para la submuestra, las probabilidades fueron aún mayor, rondando el 27% [95%IC: 1,11-1,46]. Conclusiones. Nuestros resultados mostraron una asociación positiva entre la obesidad y la cantidad de consumo de alimentos ultraprocesados, incluso en aquellos que no superaron sus requerimientos energéticos diarios adecuados. Arch Latinoam Nutr 2023; 73(2): 113-121.
Palabras clave: obesidad; adulto; alimentos Industrializados; ingestión de alimentos; agroindustria; conducta sedentaria.
https://doi.org/10.37527/2023.73.2.003
Autor para la correspondencia: Stephani Filgueiras Mashki, e-mail: [email protected]
Obesity is a public health issue with increasing prevalence. According to the World Obesity Atlas 2023, it is estimated that by 2035, the prevalence of obesity in the United States (US) will reach 58% of the population (1). Obesity is positively associated with the rise in the prevalence of non communicable diseases (NCDs), which has been reported by several studies in the last decades in the United States (2). Approximately 22.72% of the burden of NCDs could have been attributable to overweight in adulthood (3).
Obesity is a multifactorial disease, being also affected by changes in the global food system, particularly the expansion in the variety and amount of ultraprocessed foods available in the world’s food supply and corresponding changes in eating behaviors (4). The ultraprocessed foods are manufactured with substances extracted from foods or synthesized in laboratories (dyes, flavorings, and other additives), high amounts of fat, sugar, and salt and a high energy density and low fiber content (5). Besides that, these food products are also extremely palatable and habit-forming, convenient, sold in large portion sizes, and aggressively advertised and marketed (6–8).
The NOVA classification system is a tool to categorize foods according to the extent of food processing in four groups: unprocessed and minimally processed foods, processed foods, ultraprocessed food products and food industry ingredients (9–11). In addition, a higher proportion of ultraprocessed foods in the diet, greater than 20%, in comparison with lower consumption, was associated with an increased risk of obesity in several countries (4). This generates a negative impact on dietary quality (2).
Several studies point out that higher ultraprocessed food intake was associated with excessive weight gain, and a higher risk for developing obesity (3, 5, 12–15). Furthermore, other studies point out an association between food processing and the risk of increased adiposity tissue (4, 16). Besides that, the high consumption of ultraprocessed foods is also related with the development of NCDs (2,17).
Therefore, the aim of this study is to analyze the association between a higher consumption of ultraprocessed foods and the obesity in adulthood in the United States, even though in subjects who consume no more than their adequate daily energy requirements.
This is a cross-sectional study conducted according to the STROBE guidelines (18). Data from NHANES from 2009 to 2018 was used in this study. NHANES is a cross- sectional study conducted every two years since 1999, that aims to assess and to monitor the nutritional and health status of the United States population, who are not institutionalized. NHANES evaluates biochemical, physical, lifestyle, anthropometric, nutritional, clinical, and sociodemographic data (19,20). Trained health professionals that follow a standardized protocol are responsible for collecting the NHANES data (19–21). The data that support the findings of this study are openly available in NHANES Data Portal repository at [https://wwwn.cdc.gov/nchs/nhanes/].
In this study, subjects of both sexes, aged between 18-64 years old, with anthropometric, health, income, race/ethnicity, and PA data were selected. As applied in another study, pregnant women and subjects with cognitive inability or conditions that prevented the application of the questionnaire, and the anthropometric screening were excluded (21).
An average of the 24-hour food recall of two days was used to evaluate the food consumption. Subjects who were on a special diet or who were consuming less than an average of 500 calories (kcal) per day were excluded from our analysis.
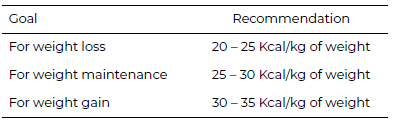
In addition, we selected a subsample with subjects who were not consuming more than the upper limit of their recommended daily calorie intake based on the average of two days. For this, the subject recommended daily calorie intake was calculated using the kcal per kilo (Kg) recommended by the Martins and Cardoso (22). This is calculated according to subject nutritional status (based on the Body Mass Index) and consists of multiplying the recommended kcal value by weight. Upper and lower limits were established as 5% more or less of this calculated kcal value. The recommended kcal per kg according to the Body Mass Index (BMI) values are shown in Table 1.
For the food category classification, the NOVA classification system proposed by Monteiro (9– 11) was used. This classification is a new tool to categorize foods according to the extent of food processing: unprocessed and minimally processed foods, processed foods, ultraprocessed foods and processed culinary ingredients. The amount of each type of food was performed considering the total of food grams intake (average of 2 days) and the total of each food category consumed by the participants. The ultraprocessed food consumption was classified into one of the following categories: a) less than 20%; b) ≥ 20% e < 40%; c) ≥ 40% e < 60% and ≥ 60%.
Height and weight measurements were self-reported by the participants and the nutritional status was calculated according to the BMI formula, which consists of dividing the weight in kilograms by the squared height in meters (21, 23). It was classified according to the World Health Organization (WHO), 2000, reference values (24). To carry out the analyses, we categorized obesity by BMI ≥ 30kg/m², as proposed by WHO, 2000 (24).
The physical activity (PA) level was assessed according to WHO (2010)(25) reference values. It was considered that met the physical activity guidelines when subjects practiced 150 minutes or more of moderate or intense PA per week, or at least 75 minutes of higher intensity PA and that they did not meet the physical activity guidelines if the practice of PA were non-existent or below the recommendations.
The descriptive analyses of the data were presented as proportions. The association between obesity and the amount of ultraprocessed food consumption was calculated through the binomial logistic regression (26). The model was adjusted for sex (male, female), age as a continuous variable (years), race/ethnicity (Hispanics, non-Hispanic Whites, non-Hispanic Blacks, and other races), and physical PA (Meets or does not meet the physical activity guidelines). We also tested the adjustment for education level and according to the NHANES waves, but they did not show significance in our model, being removed from the analysis.
The quality of the model fit was assessed using the Hosmer and Lemeshow test (1980). This test analyzes the model through the distance between the adjusted probability and the observed probabilities and it determines that the model fit is adequate when the p-value is greater than 0.05. All statistical analyses were performed using software R, version 4.0, at a significance level of 0.05 and a 95% confidence interval (CI).
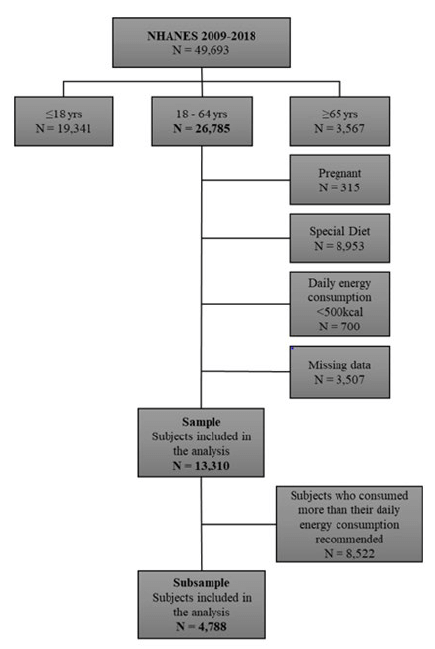
After applying the inclusion and exclusion criteria, 13,310 subjects were selected in total, and for the subsample remained 4,788 subjects, as shown in Figure 1.
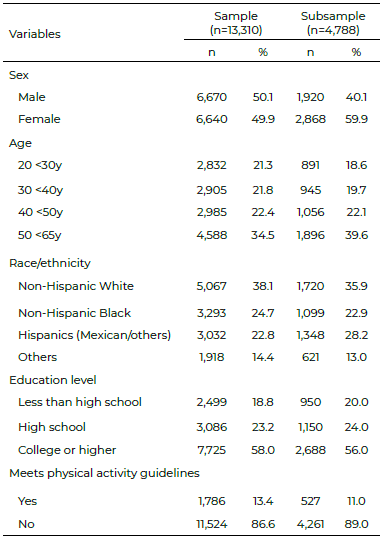
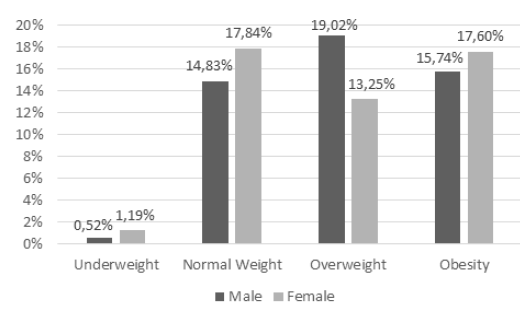
Our sample was composed of half men and half women, with subjects aged between 50 to 64 years old (34.5%) and from the race/ ethnicity of non-Hispanic Whites (38.1%). Regarding the education and physical activity levels, 58.0% had college or higher education and 86.6% did not meet physical activity guidelines. In our subsample, the majority was female (59.9%), in the age group of 50 to 64 years old (39.6%) and non-Hispanic White (35.9%). In addition, 56.1% of this subgroup had college or higher education and 89.0% did not meet physical activity guidelines. Sociodemographic data and lifestyle conditions are described in Table 2, while the nutritional status is shown in Figure 2 and Figure 3.
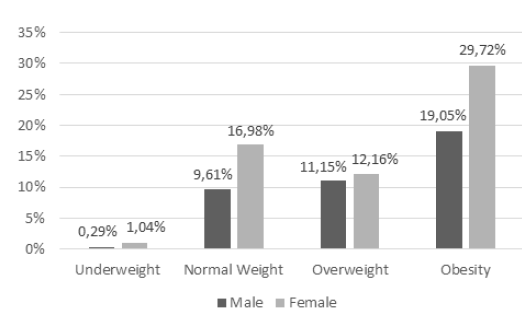
Regarding the daily ultra-processed food consumption 39.1% of the sample intake less than 20%, 33.5% intake between ≥20 to <40%, 16.6% intake between ≥40 to <60%, and 10.2% intake ≥60%.
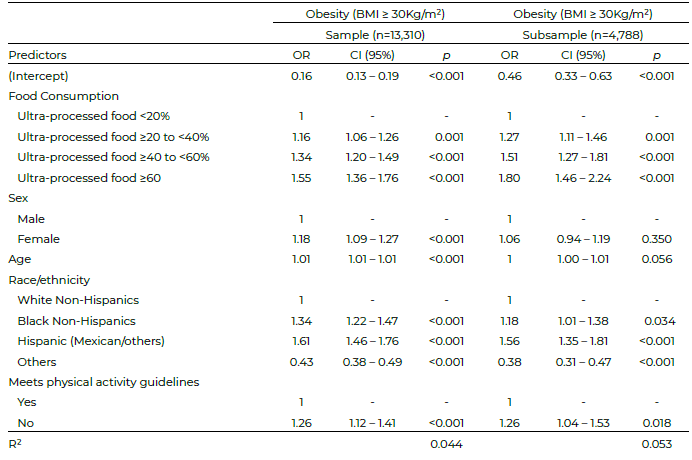
For every 1-year increase in age, the OR of developing obesity increases around 1% [95% CI:1.01–1.01] and women presented an increased OR of 18% when compared to men [95% CI: 1.09 – 1.27]. Regardless of race/ ethnicity, being a non-Hispanic Black had 34% more odds for obesity [95% CI: 1.22–1.47] than non-Hispanic Whites, while Hispanics had even a higher odd(61%) [95% CI: 1.46–1.76]. Furthermore, the OR was increased by 26% in subjects who did not meet physical activity guidelines [95% CI:1.12–1.41].
Our analyses show a higher consumption of ultraprocessed foods is positively associated with the development of obesity, even among subjects who did not consume more than their recommended daily calorie intake. Compared to subjects who consumed less than 20% of ultraprocessed foods, subjects higher being around 27% [95% CI:1.11–1.46]. For those who consumed between 40 to 60%, the OR was increased by 34% [95% CI:1.20– 1.49]. In the subsample it was even higher, around 51% [95% CI: 1.27–1.81]. Subjects who had daily food consumption based mostly on ultraprocessed foods (>60%) had 55% odds to develop obesity [95% CI:1.36–1.76]. In the subsample, the OR was increased by 80% [95% CI:1.46–2.24].
The odds of obesity according to the food consumption type and sociodemographic data is shown in Table 3. Regarding the model fit applied, the Hosmer and Lemes how test (1980), showed a p-value of 0.83 for the sample and 0.06 for the subsample, which indicates a good fit of the models applied in this study.
Our findings indicate a positive association between ultraprocessed foods and the odds of developing obesity, even though among subjects who consume their daily energy requirements. This suggest that the quality of diet and a sedentary lifestyle are more related to obesity than just caloric intake, as point out in other studies (14,27–30).
According to the studies conducted by Swinburn et al. (31) and Rauber et al. (32) the major factor that increases in obesity in high- and low-income countries is the changes in the global food system. This indicates the production of more ultraprocessed, accessible, and marketable foods, and consequently, lead to excessive consumption of these foods (31,32).
Studies that evaluated the high consumption of ultraprocessed foods and food containing high glycemic load and/or carbohydrates and/or fats and/or sodium showed a high risk for developing obesity. This condition is related to several diet-related NCDs, such as type II diabetes, hypertension, and some type of cancers (29,33).
When we compared the differences of obesity OR among men and women, our analyses suggested that women had a higher odd to develop it than men as found out in other studies (34–36). Moreover, a study showed that hormonal factors and changes in body composition throughout lifespan increased the incidence of obesity in women. It is also associated with changes in the reproductive cycle with reduced fertility, as well as an increased risk of polycystic ovary syndrome (PCOS) and infrequent or absent ovulation. Women committed to overweight and PCOS are more susceptible to develop insulin resistance and/or type II diabetes in later life (35).
In our study, we found out a positive association between age and obesity. Regarding to this, a systematic review showed that obesity risk increases along with age (37). In addition, this study also pointed out differences according to the income level of the countries (37). It showed that young adults in developing countries have an average weight gain of 1 kg/year greater than young adults from developed countries (0.4–0.9 kg/year)(37).
Another factor that contributes to the incidence of obesity is ethnicity. Studies show a relationship between poor socioeconomic status with black or mixed color/race (38) and worse health outcomes (39), which includes obesity (40, 41), that confirms the results found in this study. However, a higher income level may indicate greater food power purchasing, being also a odds factor for obesity(42).
Regarding factors at an individual level, lifestyle contributes significantly to the incidence of obesity. According to Swinburn et al. (31) lack of physical activity is a determinant of the behavior that contributes to this condition, which corroborates to the findings of this study. Furthermore, the American College of Cardiology/American Heart Association Task Force on Practice guidelines and the Obesity Society (AHA/ ACC/TOS) guidelines recommend a loss of 3–5% of weight for the management of obesity in adults (43). In this context, practice of PA is important, because it increases the metabolic rate, which results in energy expenditure and weight loss (44).
The Centers for Disease Control and Prevention (CDC) indicates that maintaining a regular frequency of PA helps to reduce high blood pressure, the risk of type II diabetes, heart attack, stroke, several types of cancer, arthritis pain, osteoporosis, falls, and symptoms of depression and anxiety (45). Moreover, a study conducted by Silva et al. (46) with 506 adults (≥ 20 years) in the city of Brasília (Brazil) point out an inversely association between the consumption of ultraprocessed foods and the time of physical activity. People committed by overweight or obesity who do not follow the guidelines recommendation had a higher ultraprocessed food intake than normal weight adults or subjects who met the PA guidelines (46).
Additionally, a review study showed that the association between physical inactivity and obesity goes beyond energy balance (47), indicating that physical inactivity is positively associated with adiposity. It affects the mechanisms of satiety and appetite control (47). This occurs because low levels of physical activity generated appetite signals fail and the body does not recognize that it is being overfed (47).
The strengths of this study are: we used data from NHANES, which is a representative sample of the United States population, and that follows a rigorous methodological process capable of guaranteeing the reliability and reproducibility of the data; we used a new food classification system which considers the food composition and the type of food processing. Our analyses were conducted also in a subsample composed just of subjects who did not consume more than their recommended daily calorie intake, and the results were also consistent in this group. Besides that, there are some limitations: memory bias in the information in the 24-hour food recall, once it depends on the participant's memory to remember the food intake and their amounts, which can cause underestimation on food intake; we just assessed 2 days of food consumption, which may not reflect on the food routine of the subjects; the possibility of error in classifying foods based on the level of processing must also be considered, due to the difficulty of contextualizing the food preparation itself. Additionally, the NOVA classification focuses on the extent of food processing and does not take into consideration other factors such as the nutritional composition of the food.
This is a study using representative data from the US adult population between 2009 and 2018 that evaluated the association between obesity and consumption of ultraprocessed foods. Our results showed a positive association between ultraprocessed foods and developing obesity, even though among subjects who consume no more than their daily energy requirements. In this way, the quality of food consumption seems to be more related to obesity than the calories intake by itself, which suggests a need to review the approach in the assessment of food intake in people affectedby overweight and obesity.
Considering the increasing prevalence of obesity worldwide, which is associated with various NCDs and directly related to lifestyle factors, including the consumption of ultraprocessed foods, the results of this study highlight the importance of public health policies that targeted dietary guidelines, with the goal of reducing this type of food.
National Health and Nutrition Examination Survey, and to the Centers for Disease Control and Prevention for making these datasets available to researchers. Data Sharing: Data described in the manuscript, code book, and analytic code will be made available upon request pending.
This work was supported in part by the Coordenação de Aperfeiçoamento de Pessoal de Nível Superior – Brazil [CAPES] – Finance Code 001 under Grant 88887.461765/2019-00, 88887.356471/2019-00.
The authors report no conflicts of interest.
Recibido: 28/04/2023
Aceptado: 21/06/2023