Introduction
Due to the nutritional transition, eating patterns have undergone substantial changes during the last 30-40 years. Calorie availability has been increasing in recent decades worldwide by approximately 450 kcal per capita per day (1). A substantial part of this caloric rebound can be attributed to the increased consumption of ultra- processed foods and beverages (2), as a response to advances in industrialization, urbanization, economic development and the globalization of markets (3).
Accompanying this trend of unhealthy diets, obesity, overweight, and associated chronic noncommunicable diseases (NCDs) have progressively increased in all age groups and have become the leading cause of death and disability in the Region of the Americas (55% of all causes in 2012, according to world health estimates from the World Health Organization (WHO)(4). In Argentina, according to data from the Second Nutrition and Health Survey, excess weight is the form of most severe malnutrition in all age groups, with a prevalence of 13.6% in children under 5 years of age, 41.1% in children and adolescents between 5 and 17 years of age, and 67.9% in people of 18 years or older (5).
Recognizing this public health problem, the WHO proposes, among other measures, the efficient implementation of nutritional labeling on the front of the package (FOP) (6), the objective of which is to reduce cognitive efforts and the time to process the information on the labels, facilitating the choice of healthier foods at the time of purchase (7). For the design and implementation of an FOP nutrition label, a nutritional profiling system (NPS) is required, defined by the WHO as tools to classify foods according to the attributes of their nutritional composition, applied with the aim of preventing diseases and promoting health (8).
There are dozens of NPSs in the world, which is a sign of their importance. A main difference between these is the nature of the information they offer. The NPSs currently used around the world can be organized into two main categories: specific nutrient indicators and, on the other hand, summary indicators (9). The methodology used for the specific nutrient is based on thresholds, evaluating the content of each nutrient, considered critical, independently, contrasting it with the proposed nutritional parameters. While summary indicators use a scoring method that, through algorithms, weights both families of nutrients (critical and positive) (10). In the category of specific nutrients, there are two main formats: numerical, such as the reference intake (RI) format initially known as guideline daily amount (GDA), developed in 2006 and applied internationally by the food industry (11) and codified by colors such as the multiple tricolor traffic light format (Multiple Traffic Lights, MTL) or simple traffic light, introduced in the United Kingdom in 2005 and in Ecuador in 2014, respectively (12-13). Finally, a novel format developed in South America corresponds to warning symbols, which are placed on foods according to their levels of certain nutrients (as in the Chilean system) (14).
Systems that implement summary indicators provide a global evaluation of the food product. Among these, we find those that use a scale of graduated scores (15) such as the NutriScore (also called 5C) implemented in France in 2017 and in Belgium and Spain in 2018 (16) and the Health Star Rating system (HSR), introduced in Australia and New Zealand in 2014 (17). And systems that use labeling with seals of approval such as Choices, implemented by the Netherlands in 2006 (18) and the Green Keyhole symbol or the lock system adopted by Sweden, Denmark, and Norway since 2009 (19) (Figure 1).
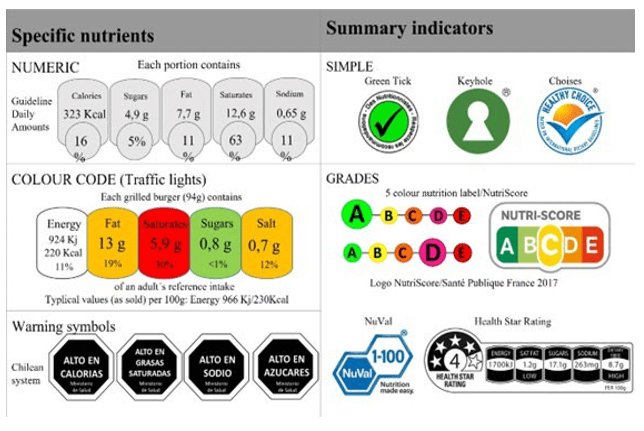
Figure 1: Types of NPS in use worldwide.
In Latin America, the FOP is mandatory in Peru, Chile, Mexico, Uruguay and recently in Argentina. The vast majority use the warning systems, these NPS are more often associated with “danger” due to the use of symbols, octagons (stopping sign) of colour black and white. Ecuador and Bolivia have implemented the simple traffic light, which is presented with green lights, indicative of the concept of “health,” and red as warning high in calories, saturated fat, free sugars, and sodium (20).
Most of the studies that have been carried out have focused on evaluating the role of NPS in helping consumers understand the nutrient compositions and general healthiness of food products, improving their knowledge about proper nutrition and healthy diet (21,22). However, the effect of NPS in persuading consumers to purchase healthier foods has been less studied.
Food shopping is the result of complex behavior that is influenced by multiple sociodemographic factors (eg, gender, race/ethnicity, age, and income level) (23) and contextual factors (eg, knowledge about nutrition, perceived health, taste preference, shopping environment, price, food product alternative, food environment, industry marketing, and political factors) (24,25). A change in the perception of the nutritional value of a food from the reading of the NPS does not necessarily translate into a modification of the purchase. Considering that food quality will ultimately be determined by the purchase and the combined consumption of food, this systematic review aimed to determine the effect of NPS on food purchase.
Materials and methods
Search strategy. A systematic search of the scientific literature was carried out, including data from June 2012 to June 2022, using the following electronic databases: Medline, Elsevier, Scielo, and Lilacs. The search algorithm included all possible combinations of keywords relating the exposure (nutrient profiling OR nutrient profiling system OR nutrient profiling model) and the outcome of interest (food purchases). The results of the study were reported according to the Preferred Reporting Items for Systematic Reviews and Meta Analyzes (PRISMA) model (26).
Selection criteria. Original experimental articles and intervention studies such as controlled clinical trials (CCTs), published in English, and studying adults over 18 years of both sexes, were included. Articles published in formal academic journals were selected. In addition, studies that analyzed perception or purchase intention were admitted.
To reduce the risk of bias, we excluded observational studies such as case-control, retrospective and prospective cohort studies, animal studies, non- original studies (meta-analyses, reviews, and comments), and intervention studies without a control group.
Selection of studies, data collection and synthesis of results. A search of the aforementioned databases was performed independently by two reviewers. The reading of the title or abstract of the articles was considered following the eligibility criteria described above. The full-text versions of all potentially eligible articles were then independently assessed by two reviewers with the aim of selecting articles for definitive entry into this study. Discrepancies were resolved through consensus. Extracted data included study authors, country, year of publication, study design (intervention), type of NPS studied, site and mode of intervention, number of participants, duration, and main outcomes.
Results
From the aforementioned search strategy mentioned, 362 Pubmed articles, 569 Science Direct articles, 29 Virtual Health Library articles, and 12 Scielo articles were identified. Considering the initial selection based on the title and abstract and after removing duplicates, 26 articles remained for evaluation of the full text and 16 of these publications were excluded for various reasons. After applying all the eligibility parameters, 14 articles were found to be suitable and were therefore included for the systematic review (Figure 2).
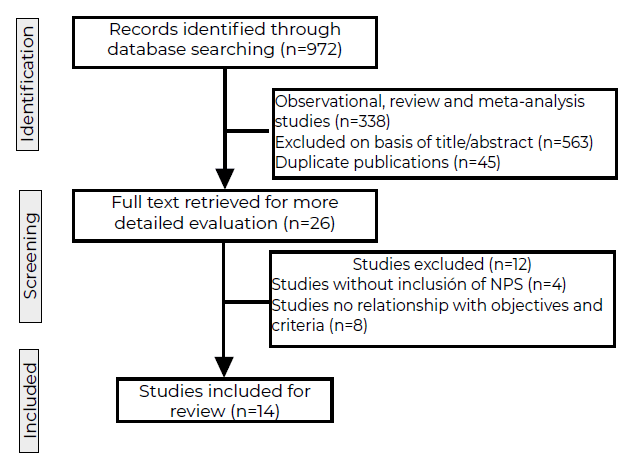
Figure 2. Flow diagram of literature search and selection of studie.
Regarding the basic characteristics of the 14 studies, all were published between 2016 and 2022. They were conducted in France (n=4), Australia (n=3), Canada (n=3), Netherlands (n=2), Mexico (n=1) and the United States (n=1). Study design included randomized controlled trials (RCT) (n=7), experimental (n=5), non-randomized controlled trial (n=1), and open-label, parallel trial (n=1). 13 studies incorporated a control group into their intervention, mostly (n=11) the methodology used was not to place the NPS on the food label and others (n=2) used the nutritional information table.
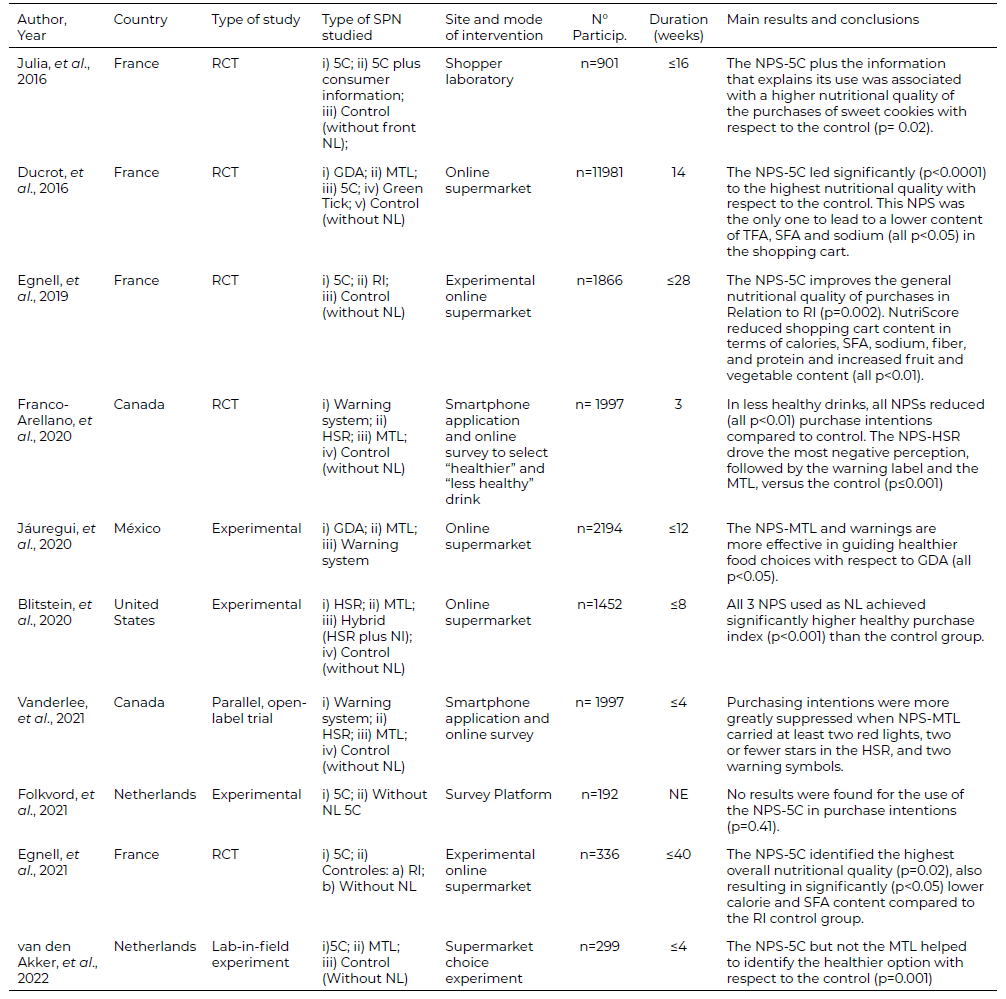
The studies were analyzed according to the intervention modality, as detailed below, actual/objective purchase and intention/ perception of purchase. The descriptive data of the included studies are summarized in Tables 1 and 2.
Table 1. General characteristics of actual or objective purchase
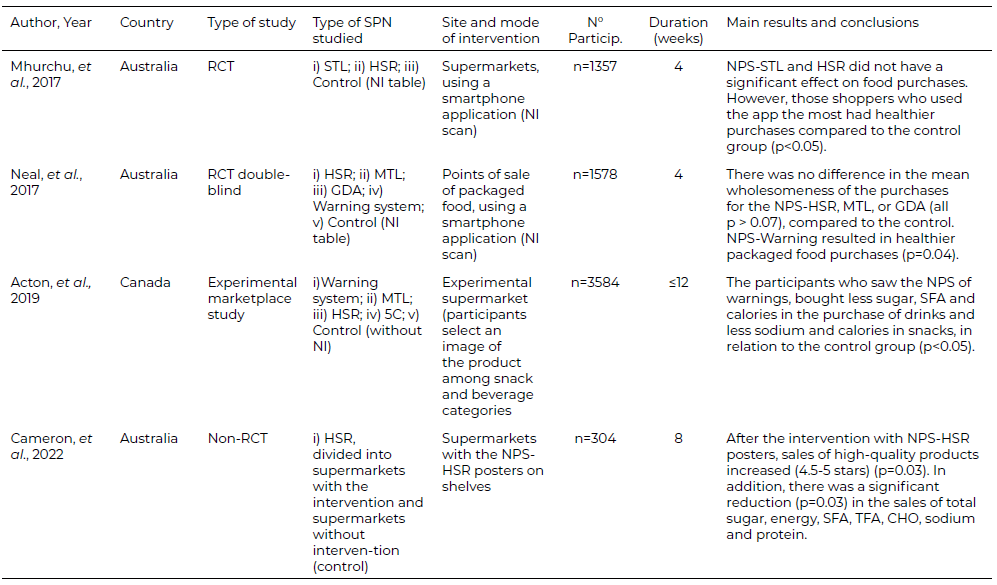
RCT, Randomized controlled trial; STL, Simple traffic light; HSR, Health Star Rating; NI, Nutritional information; NL, nutrition label; NPS, Nutritional profiling systems; Non-RCT, Non-randomized controlled trial; MTL, Multiple tricolor traffic light; GDA, Guideline daily amounts; 5C, five colors; SFA, saturated fatty acids; TFA, Total fatty acids; CHO, carbs.
Table 2. General characteristics of perception/purchase intention
NE, non-specific; RI, Reference intakes
Actual or objective purchase
Using the indicated selection criteria, 4 articles were included that analyzed the effect of NPSs in a real purchase situation (6823 subjects participated in total) (Table 1). These studies looked at a variety of NPSs, including health star rating (HSR) (n=4), multiple tricolor traffic light (MTL) (n=2), warning system (n=2), single traffic light (n=1), guideline daily amount (GDA) (n=1) and NutriScore or five colors (5C) (n=1). The interventions were carried out in a minimum of 4 weeks and a maximum of 12 weeks. These studies were conducted in naturalistic settings where people typically shop for food, such as supermarkets (27,28) and packaged goods outlets (29). In addition, a study carried out in Canada (30) was included within this category with the experimental supermarket modality, which tries to replicate the purchase behavior as faithfully as possible. To achieve this objective, the participants of said study received an amount of money to make your purchase. Of the studies that recorded purchases in a natural environment, in two of them the participants had to scan the barcodes of the products with an application on their smartphone and photographed the payment receipts (27,29). In the third, posters were placed on supermarket shelves for those packaged products that had 4.5 or 5 stars using the NPS-HSR (28) and supermarkets reported sales within a specific time window to assess purchasing behavior.
Of the studies that analyzed the NPS-HSR, three reported no effect on purchases (27,29,30); however, Mhurchu et al (30) showed that those shoppers who used the application the most had healthier purchases compared to the control group. On the other hand, the study by Cameron et al (28) showed a significant reduction (p=0.03) in the sales of total sugar, energy, total fatty acids (TFA), saturated fatty acids (SFA), carbohydrates (CHO), sodium and protein, and increased sales of high-quality products (4.5 stars) in intervention stores compared to control stores.
Among the interventions that evaluated warning systems in food purchases (29,30), one of them evidenced the purchase of healthier packaged foods (29) and Acton et al(30) reported that those participants who viewed this NPS purchased less sugar, SFA and calories in the purchase of beverages and less sodium and calories in snacks, in relation to the control group.
Figure 3 summarizes the main results of the actual or objective purchase.
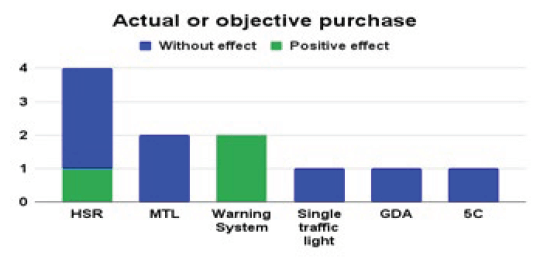
Figure 3. Main results of the actual or objective purchase according to types of NPS
Perception/purchase intention
We identified 10 interventions (22945 subjects in total) that assessed purchase perception/intention (Table 2). In relation to the study variable, the NPSs analyzed were 5C (n=6), MTL (n=6), warnings system (n=3), HSR (n=3), GDA (n=2), reference intakes (RI) (n=2), seal of approval (n=1) and hybrid (n=1). The interventions lasted between 4 and 40 weeks. 5 of these studies were conducted in a controlled intervention environment using an online supermarket methodology (32,33,35,36,39). Another 3 used online surveys, two of them through a smartphone application (34,37) and the remaining one used a survey platform (38). Finally, two studies carried out their intervention from a shopping laboratory, where the participants' choices were filmed (31,40), the particularity was that one carried out its experiment in the field, that is, in a supermarket (40).
In relation to the 6 (31-33,38-40) studies that evaluated the effects of NPS-5C or NutriScore, 5 reported that the use of this NPS allowed to identify significantly (p<0.05) the highest nutritional quality of the purchase (31-33,39,40), compared to the control group. In addition, these investigations showed that the use of NutriScore on the front of the package led to a lower content of TFA (32), SFA (32,33,39), sodium (32,33), calories (33,39), fiber and protein and an increase in the amount of fruits and vegetables (33) (all p<0.05) in the shopping cart compared to NPS- GDA, seal of approval, no nutrition label, MTL (32) and reference intakes(33,39). Julia et al (31) reported that the use of NPS-5C plus a brochure explaining its use led to a better-quality purchase for sweet cookies compared to the control group.
Regarding the 4 interventions that used NPS-HSR, MTL and warning system, all studies showed positive results with one of these NPS. Jauregui et al (35) showed that the NPS-MTL and warnings are more effective in guiding healthy food choices with respect to GDA. Similarly, Blitstein et al (36) reported that the healthy shopping index had a higher score with the MTL and HSR, with respect to the non-incorporation of an NPS on the food label. In addition, Franco- Arellano (34) showed regarding the purchase of less healthy beverages, that the use of the NPS-MTL, HSR and warning system on the front of the package decreased their purchase intentions and that HSR promoted the perception more negative, followed by the warning system and the MTL, compared to the control (p≤0.001). Finally, Vanderlee et al (37) found that purchase intentions were greatly suppressed when the NPS-MTL had at least two red lights, the HSR two or fewer stars, and two warning symbols.
Figure 4 summarizes the main results of the perception/purchase intention.
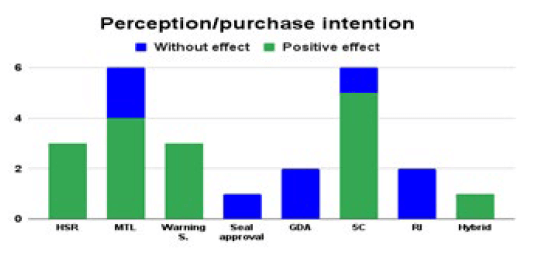
Figure 4. Main results of the perception/purchase intention according totypes of NPS.
Discussion
This study, a systematic review on the effect of NPSs on the front of the package in food selection during purchases, provides convincing results of the beneficial influence of the use of NPSs, as it would guide the consumer to healthier food choices at the time of purchase.
We identified 14 relevant and adequate studies published from 2016 to 2022. These studies provided evidence from 29838 people from various countries. A variety of NPSs were evaluated, including stoplights, NutriScore, health star ratings, guideline daily amount, warning system, and seal of approval.
When studying the experimental interventions according to the response variable, it is observed that when the actual purchase and the perception of purchase were analyzed, the warning system led to healthier purchases. This may be because the graphic used is often associated with "danger" due to the use of symbols (eg, octagon, stop sign), color (black and white), and warning texts, this NPS attracts attention to consumers efficiently, and therefore requires less time to process the information (41-43). On the other hand, the warning system presents as a novel characteristic that it uses the absence of warning stamps to indicate the healthiness of a product (37). In this way, they could avoid misperceptions of consumers towards some products described as “healthy” by manufacturers, reducing the possible “halo effect” (34).
This review showed positive effects of the NPS-HSR on food purchase when perception of purchase was assessed, while the effects were mixed when purchase was actual. The HSR system is useful for comparing the nutrient profile of products within a single food category, but not between them (37,44). There is empirical evidence on the effectiveness of the HSR for the identification of products of higher nutritional quality (45,46), it would be that this type of NPS corresponds to the category of interpretative ones that use summary indicators (17). The HSR has also been shown to elicit more accurate perceptions of unhealthy food items, thus avoiding positivity bias (47). Evidence indicates that interpretive NPSs have relatively small effects on consumer food choices at the population level. The use of these NPSs on the front of the package could achieve greater effects if implemented in the real world for a longer time and accompanied by educational campaigns on their use (27).
NutriScore or the 5C logo and the MTL did not show effects in the actual purchase situation, but they did show positive changes when purchasing perception was studied. These two NPSs share the characteristic of using a color code or scale, the green and red colors, corresponding to the recognized signals, may be easier to understand and interpret, the green being associated with safety and a "go" signal and red associated with danger and the "stop" sign (48,49). Nevertheless, we must differentiate that the MTL qualifies the level of each objective nutrient, while NutriScore summarizes the general level of the nutritional quality considering all the preferable and detrimental nutrients (50). NutriScore stands out for being easily understood by consumers, even among those of low socioeconomic status (9,51). However, critics of the NPS-5C have mentioned several problems, such as that its algorithm does not consider the degree of processing of a food, thus, food products can qualify well from a nutritional point of view, even though they are highly processed (52) and on the other hand, that its score is calculated in 100g/mL and not per portion (53).
The results of our review are similar to the study by Temple (16), which observed that the NPSs that would be most successful in affecting consumers' intention to purchase healthy foods would be the warning system first, followed by the MTL, NutriScore and lastly HSR.
Strength of this review is that it used a rigorous systematic approach to evaluate the efficacy of the use of NPS on the FOP for the purchase of healthy foods, currently being such a relevant issue for public health, offering conclusions that support the implementation of these food education tools for consumers as a strategy to address unhealthy diets and NCDs. NPSs used in food empower consumers by providing nutritional information (54). Finally, nutritional labels can also induce the industry to produce healthier foods through nutrient reformulation (55,56).
However, the limitations of the study should also be mentioned. First, demographic factors that could affect the results were excluded from the analysis, such as socioeconomic level, since it is a highly determining factor when purchasing food. Second, most of the interventions included in the systematic review used simulated shopping as their experimental design; very few studies have been conducted in real-world supermarkets. Studies using this latter intervention generate results that have much more credibility than studies using a shopping simulation. This is because buyers are not part of an experiment (which could influence their behavior) and buyers have several weeks or months to adjust to NPSs instead of a single experiment
Conclusions
NPSs in the FOP had a positive impact on the decision to purchase healthier foods in 100% of the interventions that tested the warnings system, in 71% of studies that tested NutriScore, in 57% the interventions that tested HSR and in 50%of interventions that analyzed MTL. What accounts for the effectiveness of the system, even so, it is necessary to reinforce the system and policies with nutritional food education campaigns.
Acknowledgments
This work was support by project grant code 80020180100160CC funded by Universidad Católica de Córdoba and by project number VIPUCT2021PRO-WB-01, funded by Universidad Católica de Temuco, Chile. Also, we thank MINEDUC UCT21102, Government of Chile.
Conflicts of interest
The authors declare they have no conflicts of interest.
Referencias
- Vasileska A, Rechkoska G. Global and regional food consumption patterns and trends. Procedia Soc Behav Sci. 2012; 44:363-369. doi:10.1016/j.sbspro.2012.05.040.
- Monteiro CA, Moubarac JC, Cannon G, Ng SW, Popkin B. Ultra-processed products are becoming dominant in the global food system. Obes Rev. 2013;14(Suppl 2):21-28. doi: 10.1111/obr.12107.
- Organización Mundial de la Salud. Dieta, Nutrición y Prevención de Enfermedades Crónicas. Ginebra, Consulta Mixta de Expertos OMS/FAO, 2003. pp. 13-15.
- da Costa Louzada ML, Bortoletto Martins AP, Silva Canella D, et al. Ultra-processed foods and the nutritional dietary profile in Brazil. Rev Saude Publica. 2015; 49:38. doi: 10.1590/S0034-8910.2015049006132.
- Secretaria de Gobierno de Salud. Segunda Encuesta Nacional de Nutrición y Salud. Buenos Aires, Ministerio de Salud y Desarrollo Social, 2019. pp. 17-27.
- World Health Organization. Follow-up to the Political Declaration of the High-level Meeting of the General Assembly on the Prevention and Control of Non communicable Diseases. Sixty-sixth World Health Assembly, 2013. pp. 25.
- Cecchini M, Warin L. Impact of food labelling systems on food choices and eating behaviours: a systematic review and meta-analysis of randomized studies. Obes Rev. 2016; 17(3):201-210. doi: 10.1111/obr.12364.
- World Health Organization. Nutrient profiling: report of a technical meeting. London, OMS/IASO, 2010. pp. 20.
- Julia C, Hercberg S, World Health Organization. Regional Office for Europe. Development of a new front-of-pack nutrition label in France: the five-colour Nutri-Score. Public Health Panor. 2017;3(4):712-725.
- Sistemas de Perfilado Nutricional: Bases Metodológicas para su Análisis. Hernandez M, Carmuega E. 1a ed. Ciudad Autónoma de Buenos Aires: Centro de Estudios sobre Nutrición Infantil, 2018.
- Food and Drink Federation. Food and drink labelling: A tool to encourage healthier eating. London, 2013. pp. 16.
- Food Standard Agency. Front of Pack Nutritional Signpost Labelling Technical Guidance. UK: Food Standard Agency, 2007.
- Ministerio de Salud Pública (Ecuador). Reglamento de Etiquetado de Alimentos Procesados para el Consumo Humano. Registro Oficial Suplemento 318, 2014, Acuerdo Ministerial 5103.
- Carreño I. Chile's Black STOP Sign for Foods High in Fat, Salt or Sugar. Eur J Riesgo Regul. 2015;6(4):622–628.
- Britos S. Perfiles Nutricionales. Definiciones y estado de situación del tema en Argentina. Diaeta. 2017;35(160):8- 15.
- Temple NJ. Front-of-package food labels: A narrative review. Appetite. 2020; 144:104485. doi: 10.1016/j. appet.2019.104485.
- Jones A, Thow AM, Ni Mhurchu C, Sacks G, Neal B. The performance and potential of the Australasian Health Star Rating system: a four-year review using the RE-AIM framework. Aust N Z J Public Health. 2019;43(4):355-365. doi: 10.1111/1753-6405.12908
- Roodenburg AJC, Popkin BM, Seidell JC. Development of international criteria for a front of package food labelling system: the International Choices Programme. Eur J Clin Nutr. 2011;65(11): 1190-1200. doi:10.1038/ejcn.2011.101
- Swedish National Food Administration, Danish Veterinary and Food Administration, Norwegian Directorate of Health and Norwegian Food Safety Authority. Design manual for the Keyhole logo - prepacked food and generic marketing, 2012. pp. 10.
- Organización de las Naciones Unidas para la alimentación y la agricultura, Organización Panamericana de la Salud, Fondo de las Naciones Unidas para la Infancia. Etiquetado Nutricional en la Parte Frontal del Envase en América Latina y el Caribe. Santiago de Chile, 2022.
- Van Kleef E, Dagevos H. The Growing Role of Front-of- Pack Nutrition Profile Labeling: A Consumer Perspective on Key Issues and Controversies. Crit Rev Food Sci Nutr. 2015;55(3):291-303. doi: 10.1080/10408398.2011.653018.
- El-Abbadi NE, Taylor SF, Micha R, Blumberg JB. Nutrient Profiling Systems, Front of Pack Labeling, and Consumer Behavior. Curr Atheroscler Rep. 2020;22(8):36. doi: 10.1007/s11883-020-00857-5.
- French SA, Tangney CC, Crane MM, Wang Y, Appelhans BM. Nutrition quality of food purchases varies by household income: the SHoPPER study. BMC Public Health. 2019; 19:231. doi: 10.1186/s12889-019-6546-2.
- Nestle M, Wing R, Birch L, et al. Behavioral and Social Influences on Food Choice. Nutr Rev. 1998;56(5Pt2): S50-64. doi: 10.1111/j.1753-4887. 1998.tb01732. x.
- Sanlier N, Karakus SS. Evaluation of food purchasing behaviour of consumers from supermarkets. British Food Journal. 2010;112(2):140-150. doi: 10.1108/00070701011018824.
- Liberati A, Altman DG, Tetzlaff J, Mulrow C, Gøtzsche PC, Ioannidis JPA. The PRISMA statement for reporting systematic reviews and meta-analyses of studies that evaluate healthcare interventions: Explanation and elaboration. BMJ. 2009;339: b2700.doi: 10.1136/bmj. b2700
- Ni Mhurchu C, Volkova E, Jiang Y, et al. Effects of interpretive nutrition labels on consumer food purchases: the Starlight randomized controlled trial. Am J Clin Nutr. 2017;105(3):695-704. doi: 10.3945/ajcn.116.144956
- Cameron AJ, Brown A, Orellana L, et al. Change in the Healthiness of Foods Sold in an Australian Supermarket Chain Following Implementation of a Shelf Tag Intervention Based on the Health Star Rating System. Nutrients. 2022;14(12):2394. doi: 10.3390/nu14122394.
- Neal B, Crino M, Dunford E, et al. Effects of Different Types of Front-of-Pack Labelling Information on the Healthiness of Food Purchases-A Randomised Controlled Trial. Nutrients. 2017;9(12):1284. doi: 10.3390/nu9121284.
- Acton RB, Jones AC, Kirkpatrick SI, Roberto CA, Hammond D. Taxes and front-of-package labels improve the healthiness of beverage and snack purchases: a randomized experimental marketplace. Int J Behav Nutr Phys Act. 2019;16(1): 46.doi: 10.1186/s12966-019-0799-0.
- Julia C, Blanchet O, Méjean C, et al. Impact of the front-of-pack 5-colour nutrition label (5- CNL) on the nutritional quality of purchases: an experimental study. Int J Behav Nutr Phys Act. 2016; 13:101. doi: 10.1186/s12966-016-0416-4.
- Ducrot P, Julia C, Méjean C, Kesse-Guyot E, Touvier M, Fezeu LK, et al. Impact of Different Front-of-Pack Nutrition Labels on Consumer Purchasing Intentions: A Randomized Controlled Trial. Am J Prev Med. 2016;50(5):627- 636. doi: 10.1016/j.amepre.2015.10.020
- Egnell M, Boutron I, Péneau S, et al. Front-of- Pack Labeling and the Nutritional Quality of Students' Food Purchases: A 3-Arm Randomized Controlled Trial. Am J Public Health. 2019;109(8):1122-1129. doi: 10.2105/ AJPH.2019.305115
- Franco-Arellano B, Vanderlee L, Ahmed M, Oh M, L'Abbé M. Influence of front-of-pack labelling and regulated nutrition claims on consumers’ perceptions of product healthfulness and purchase intentions: A randomized controlled trial. Appetite. 2020; 149:104629. doi: 10.1016/j. appet.2020.104629.
- Jáuregui A, Vargas-Meza J, Nieto C, et al. Impact of front-of-pack nutrition labels on consumer purchasing intentions: a randomized experiment in low- and middle- income Mexican adults. BMC Public Health. 2020;20(1):463. doi: 10.1186/s12889-020-08549-0.
- Blitstein JL, Guthrie JF, Rains C. Low-Income Parents' Use of Front-of-Package Nutrition Labels in a Virtual Supermarket. J Nutr Educ Behav. 2020;52(9):850-858. doi: 10.1016/j. jneb.2020.04.003.
- Vanderlee L, Franco-Arellano B, Ahmed M, Oh A, Lou W, L'Abbé MR. The efficacy of 'high in' warning labels, health star and traffic light front-of-package labelling: an online randomised control trial. Public Health Nutr. 2021;24(1):62-74. doi: 10.1017/S1368980020003213.
- Folkvord F, Bergmans N, Pabian S. The effect of the nutri-score label on consumer’s attitudes, taste perception and purchase intention: An experimental pilot study. Food Quality and Preference. 2021;94(4):104303. doi:10.1016/j. foodqual.2021.104303.
- Egnell M, Boutron I, Péneau S, et al. Randomised controlled trial in an experimental online supermarket testing the effects of front-of-pack nutrition labelling on food purchasing intentions in a low-income population. BMJ Open. 2021;11(2):e041196. doi: 10.1136/bmjopen-2020-041196.
- van den Akker K, Bartelet D, Brouwer L, Luijpers S, Nap T, Havermans R. The impact of the nutri- score on food choice: A choice experiment in a Dutch supermarket. Appetite. 2022; 168:105664. doi: 10.1016/j.appet.2021.105664.
- Deliza R, Alcantara M, Pereira R, Ares G. How do different warning signs compare with the guideline daily amount and traffic-light system? Food Qual Prefer. 2020; 80:103821. doi: 10.1016/j.foodqual.2019.103821.
- Ares G, Aschemann-Witzel J, Curutchet MR, et al. Product reformulation in the context of nutritional warning labels: Exploration of consumer preferences towards food concepts in three food categories. Food Res Int. 2018; 107: 669-674. doi: 10.1016/j.foodres.2018.03.021.
- Nobrega L, Ares G, Deliza R. Are nutritional warnings more efficient than claims in shaping consumers’ healthfulness perception? Food Qual Prefer. 2020; 79: 103749. doi: 10.1016/j. foodqual.2019.103749
- Australian Government. Guide for Industry to the Health Star Rating Calculator (HSRC); Australian Government: Canberra, Australia, 2016.
- Ikonen I, Sotgiu F, Aydinli A, Verlegh PJW. Consumer effects of front-of-package nutrition labeling: an interdisciplinary meta-analysis. J Acad Mark Sci. 2019; 48: 360-383. doi: 10.1007/ s11747-019-00663-9.
- Lundeberg PJ, Graham DJ, Mohr GS. Comparison of two front-of-package nutrition labeling schemes, and their explanation, on consumers' perception of product healthfulness and food choice. Appetite. 2018; 125: 548-556. doi: 10.1016/j.appet.2018.02.027.
- Talati Z, Pettigrew S, Kelly B, Ball K, Dixon H, Shilton T. Consumers' responses to front-of- pack labels that vary by interpretive content. Appetite. 2016; 101:205-213. doi: 10.1016/j. appet.2016.03.009.
- Vasiljevic M, Pechey R, Marteau TM. Making food labels social: the impact of colour of nutritional labels and injunctive norms on perceptions and choice of snack foods. Appetite. 2015; 91: 56-63. doi: 10.1016/j. appet.2015.03.034.
- Julia C, Peneau S, Buscail C, Gonzalez R, Touvier M, Hercberg S. Perception of different formats of front-of- pack nutrition labels according to sociodemographic, lifestyle and dietary factors in a French population: Cross-sectional study among the NutriNet-Sante cohort participants. BMJ Open. 2017;7(6): e016108.doi: 10.1136/ bmjopen-2017-016108.
- Song J, BrownMK, Tan M, et al. Impact of color-coded and warning nutrition labelling schemes: A systematic review and network meta-analysis. PLoS Med. 2021;18(10): e1003765. doi: 10.1371/journal.pmed.1003765.
- Egnell M, Ducrot P, Touvier M, et al. Objective understanding of Nutri-Score Front-Of-Package nutrition label according to individual characteristics of subjects: Comparisons with other format labels. PLoS One. 2018;13(8):e0202095. doi: 10.1371/journal.pone.0202095.
- Romero Ferreiro C, Lora Pablos D, Gómez de la Cámara A. Two Dimensions of Nutritional Value: Nutri-Score and NOVA. Nutrients. 2021;13(8):2783. doi: 10.3390/nu13082783.
- Andreeva1 VA, Egnell M, Touvier M, Galan P, Julia C, Hercberg S. International evidence for the effectiveness of the front-of-package nutrition label called Nutri-Score. Cent Eur J Public Health. 2021;29(1):76-79. doi: 10.21101/ cejph. a6239.
- Campos S, Doxey J, Hammond D. Nutrition labels on prepackaged foods: a systematic review. Public Health Nutr. 2011;14(8):1496-1506. doi: 10.1017/S1368980010003290.
- Emrich TE, Qi Y, Cohen JE, Lou WY, L’Abbe ML. Front-of- pack symbols are not a reliable indicator of products with healthier nutrient profiles. Appetite. 2015; 84: 148-153. doi: 10.1016/j.appet.2014.09.017.
- Hawkes C, Smith TG, Jewell J. Smart food policies for obesity prevention. Lancet.2015; 385(9985): 2410-2421. doi:10.1016/S0140-6736(14)61745-1.