Introduction
Overweight and obesity are abnormal or excessive fat accumulation, posing a health risk (1). The accumulation, distribution, storage, and differences in the mobilization of adipose tissue play a significant role in the development of cardiovascular diseases (2,3). Although vascular diseases typically manifest their signs and symptoms during adulthood, some of these issues may originate from early life stages (4). University students are not exempt from this problem, as they face increased responsibilities and autonomy, including independence in decision- making. These decisions encompass not only academic matters but also dietary choices. Furthermore, changes in lifestyle, such as the number of hours of sleep, type of physical activity, and food consumption, negatively impact their body composition, potentially leading to overweight or obesity (5).
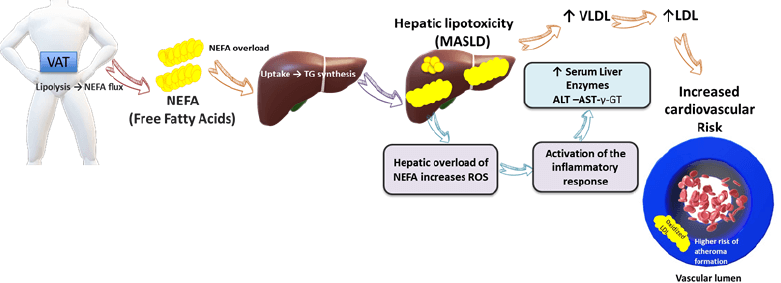
Adipose tissue is considered the organ with the greatest plasticity, as it can modify its size in response to environmental factors such as age, physical activity, diet (6), sleep quality, and even genetic factors (7). The roles of adipose tissue include fat storage, which is influenced by two processes: cellular hypertrophy, referring to the increase in the volume of pre-existing adipose cells, and hyperplasia, referring to the formation of new adipocytes (8). Several compartments related to the storage of fat are recognized in the body, including the distribution of subcutaneous adipose tissue (SAT), which is subdivided into the superficial layer of SAT (SATs) and a deeper layer (SATp). Another compartment is the gluteofemoral fat, distributed in the lower part of the body. These two compartments are the most abundant in the body (approximately 80%). Additionally, visceral adipose tissue (VAT, composed of omental and mesenteric fat) can represent 10% of total fat in women and up to 25% in men (9). VAT has been reported to be highly lipolytic, with the liver as its primary target organ. Excessive stimulation in the release of lipids by VAT can cause an excessive flow of non-esterified fatty acids, which may lead to hypertriglyceridemia due to the overproduction of very low-density lipoproteins (VLDL) and a subsequent increase in low-density lipoproteins (LDL), predisposing to the metabolic dysfunction- associated steatotic liver disease (MASLD)(10). MASLD can cause cellular damage, often associated with elevated levels of intracellular liver enzymes such as aspartate aminotransferase (AST), alanine aminotransferase (ALT), gamma-glutamyl transferase (γ-GT) (11), and increased mortality related to cardiovascular diseases. In contrast, subcutaneous adipose tissue has been associated with a protective effect against the development of cardiometabolic diseases (12).
Previous studies agree that the distribution of fat and dysfunction of adipose tissue are related to the development of obesity and associated diseases such as insulin resistance, cardiovascular diseases, diabetes, and certain types of cancer (13). In this regard, university students in northwestern Mexico represent a high-risk group, as it has been reported that 32.6% of their total energy intake derives from processed foods (PF) and ultra-processed foods (UPF) (14). Specifically, the northern region of Mexico has a higher energy intake from these sources compared to the central and southern regions of the country, in addition to being the region with the highest prevalence of overweight and obesity in adults (15). Therefore, this study aimed to find the association of liver enzymes and lipid profile with body fat distribution in Mexico university students.
Materials and methods
Study Design
This cross-sectional, descriptive, and correlational study included university students enrolled at the University of Sonora, aged between 18 and 26 years. The objective was to evaluate the association between liver enzymes and lipid profile with body fat distribution. The study period was from October 2023 to November 2024. A total of 227 participants were recruited; after applying elimination criteria (incomplete records, incomplete anthropometric measurements, or outliers), the total sample was 219 participants. Exclusion criteria were as follows: undergoing medical treatment, having any body metal implants, consumption of diuretics, engagement in strenuous exercise the day before body composition evaluation, adherencetoapriordietaryregime, pregnancy, lactation, and chronic diseases such as type 1 or type 2 diabetes, hypertension, MASLD, hypertriglyceridemia, and previously diagnosed hyperlipidemia.
Clinical Data and Laboratory Tests
All participants were scheduled for blood sample collection following a 12-hour fasting period. Blood samples were taken from the antecubital region of the arm. The obtained samples were centrifuged at 3500 rpm for 15 minutes to separate the serum. All serum samples were stored in cryovials in a freezer at -20°C until analysis. Biochemical analyses were conducted using a semi-automated clinical chemistry analyzer (SPIN-LAB, photometer-quartz-iodide lamp) manufactured in the Netherlands. All results were obtained using normal and pathological controls from Spinreact®.
Lipid Profile
Lipid profile parameters were determined following the Spinreact® kit protocols: triglycerides [glycerol phosphate dehydrogenase-peroxidase method], total cholesterol [cholesterol oxidase-peroxidase method], and high-density lipoprotein cholesterol (HDLc) [direct enzymatic method]. Very low-density lipoprotein (VLDL) was estimated using the equation: VLDL = triglycerides (mg/dL)/5, and low-density lipoprotein (LDL) using the Friedewald equation: [LDL = total cholesterol - HDL - VLDL]. Lipid biomarkers were reported in mg/dL and were analyzed as continuous variables.
Liver Enzymes
The liver enzymes determined were alanine aminotransferase (ALT) [NADH. Kinetic UV method], aspartate aminotransferase (AST) [NADH. Kinetic UV method], and gamma-glutamyltransferase (γ-GT) [carboxylated substrate-Kinetic method] using Spinreact kits. Liver enzymes biomarkers are reported in U/L and were analyzed as continuous variables.
Body Fat Distribution
Body fat distribution was assessed using dual-energy X-ray absorptiometry (DXA) equipment (PRIMUS model, OsteoSys Software Version 3.1, Osteosys Co., Ltd., Guro- gu, Seoul, Korea). DXA allowed for the measurement of visceral adipose tissue (VAT) by area (cm²) and subcutaneous adipose tissue (SAT) mass (g). VAT and SAT were determined by in a central abdominal ROI by positioning the upper pelvic marker above the iliac crests. The lateral pelvic markers were adjusted by the edge so that it crossed the femoral necks. The leg ROI was defined to isolate one lower limb, the android ROI was set to delimit the abdominal region, and the gynoid ROI for the gluteal-femoral region. The cutoff points for ratio VAT/SAT were based on those used by Fujioka et al (16). For the SAT, no cutoff points associated with health benefits have been established (17). The DXA scan also provided the fat mass index, the fat mass (kg) ratio to area (m²). Classification was based on the cutoff points proposed by Messina et al (18).
Dietary Assessment
A 24-hour recall (R24h) was used to obtain detailed information regarding the foods and beverages consumed the previous day (type, quantity, preparation method, etc.), with the technique described by Sanjur employed for this purpose (19). The SMAE 5th edition database was used to obtain the energy and nutrient intake of the participants (20).
Anthropometry
Weight and height were measured for all participants using a Seca scale model 284 with a capacity of 300 kg (± 50 g margin of error) and a stadiometer 30-220 cm (± 2 mm margin of error), following standardized techniques (21).
Pittsburgh Sleep Quality Index (PSQI)
The PSQI, validated in Spanish for the Mexican population by Jiménez-Genchi et al., was used. The PSQI evaluates sleep conditions over the past month. The cutoff points proposed were those suggested by Jiménez-Genchi et al (22).
International Physical Activity Questionnaire (IPAQ)
The short version of the IPAQ consisted of seven questions regarding the frequency, duration, and intensity of physical activity (moderate and intense) performed in the last seven days and walking and sitting time on a workday. Data obtained were classified according to the scoring described by Mantilla et al (23).
Statistical Analysis
The total population of university students was 1400, which was the basis for calculating the sample size using the G Power program (2010- 2020 Heinrich-Heine-Universität Düsseldorf) (24), through an a priori analysis with Fisher’s exact test for two tails for the independent variable HDL, while the rest were calculated with one tail. The probability of H1 was determined using a previously reported ratio by Mahmoud et al. (25) of 0.22, an alpha error of 0.05, and a beta error of 0.95, with a power of 95.1%, resulting in a sample size of 219 subjects. Descriptive tests assessed data normality using skewness, kurtosis, and the Shapiro-Wilk test. For mean comparisons, t-test and analysis of variance (ANOVA) or their non-parametric alternatives (Wilcoxon and Kruskal-Wallis, respectively) were used; the Bonferroni post hoc test was considered to determine the group evoking the difference. Categorical variables were analyzed using contrast tests (Chi-square). Implausible energy values (n=3) (<500 kcal and >6500 kcal) were eliminated and replaced by the population’s mean energy (1844.14 kcal).
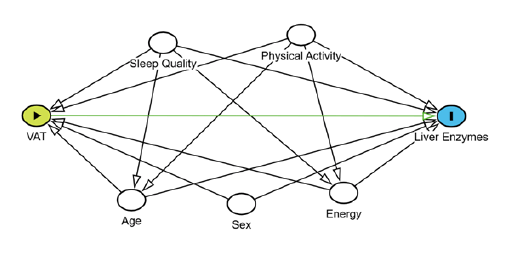
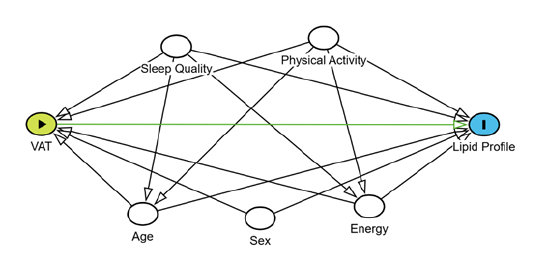
The association between lipid and hepatic profiles with body fat distribution in university students was evaluated using multiple linear regression. A crude model and an adjusted model for confounding variables: age (years), sex (male or female), physical activity (METs), energy (kcal/day), and sleep quality (points), identified considering the literature and directed acyclic diagrams (26) (Supplementary Figures 1 and 2). Independent models were created for each response variable. All analyses were performed using STATA version 17 (StataCorp. 2021. Stata Statistical Software: Release 17. College Station, TX: StataCorp LLC), setting a statistical significance level at α=0.05.
Ethical Statements
The study was conducted following the Helsinki Declaration of 1975, as revised in 2000. The study protocol was approved by the Ethics Committee of International Iberomerican University (CR-270). Everyone provided written informed consent before the laboratory test.
Results
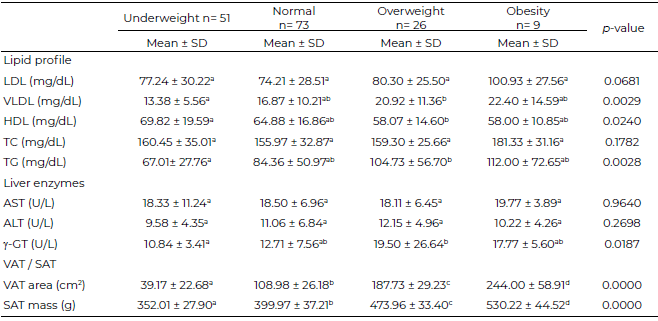
A total of 219 university students were evaluated, 72.60% were females. The mean age was 20.15 ± 1.59 years for males and 20.47 ± 2.10 years for females. Daily energy intake was higher in males compared to females (2237.18 ± 974.96 kcal/day vs. 1695.21 ± 723.34 kcal/day; p < 0.000). The values of SAT mass vs. VAT area showed differences by sex. SAT mass was similar between males and females (419.33 ± 73.21 g vs. 404.06 ± 61.21 g; p = 0.1207), whereas the VAT area was significantly lower in males compared to females (76.46 ± 76.67 cm² vs. 107.11 ± 66.44 cm²; p = 0.0039). Similarly, the fat mass index (FMI) presented significant differences between both groups (males: 4.87 ± 3.32 kg/m², females: 6.86 ± 3.39 kg/m²; p < 0.001). Detailed population characteristics are presented in Table 1.
Tabla 1. Characteristics of the population (n= 219)
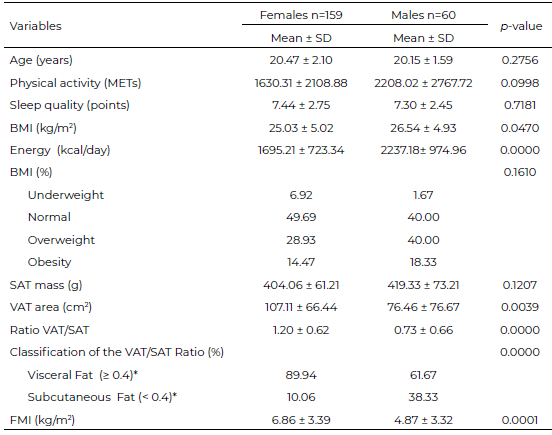
DE: standard deviation; MET: metabolic equivalent; BMI: body mass index; FMI: fat mass index; SAT: subcutaneous adipose tissue; VAT: visceral adipose tissue; FMI: fat mass index. *Cut-off point according to Fujioka et al. (16) Classification of the VAT/SAT ratio. p-value defined as alpha < 0.05.
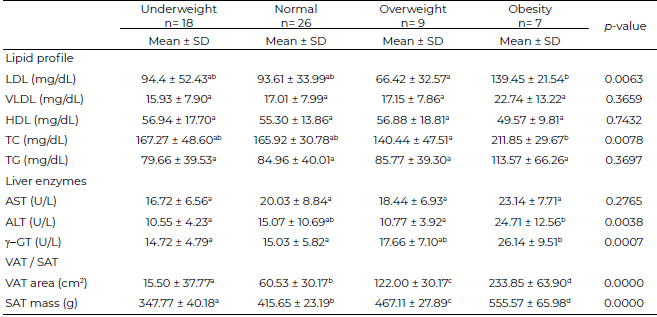
A sex-stratified analysis of body fat distribution by FMI in relation to lipid profile, liver enzymes, VAT, and SAT is shown in Table 2 y 3. In females (Table 2), there was a significant increase (p < 0.05) in the values of VLDL, HDL, triglycerides (TG), and λ-GT among overweight females compared to the underweight group. In males (Table 3), a significant increase (p < 0.05) in LDL and total cholesterol (TC) concentrations was observed in the obesity group compared to the overweight group. A significant difference (p<0.05) was observed with higher LDL and TC levels in men with normal FMI compared to the overweight group. Regarding ALT, a significant increase (p < 0.05) was found in the obesity group compared to the underweight and overweight groups. For λ-GT, a significant increase (p < 0.05) was observed in the obesity group compared to the underweight and normal weight groups. Significant differences in the amount of adipose tissue (p < 0.05) were found between all groups for both VAT and SAT in females and males, showing an increase in these deposits as individuals moved from normal weight to obesity.
Tabla 3. Body Fat Distribution According to FMI by Lipid Profile, Liver Enzymes, Visceral and Subcutaneous Adipose Tissue in Male (n=60)
FMI: fat mass index; LDL: low-density lipoprotein; VLDL: very low-density lipoprotein; HDL: high-density lipoprotein; TC: total cholesterol; TG: triglycerides; AST: Aspartate aminotransferase; ALT: Alanine aminotransferase; γ-GT: γ-Gamma glutamyltransferase; VAT: Visceral adipose tissue; SAT: subcutaneous adipose tissue. SD: standard deviation.
a - d Different literals per column indicate significant difference with Bonferroni post hoc test. p value defined as alpha < 0.05.
FMI: fat mass index; LDL: low-density lipoprotein; VLDL: very low-density lipoprotein; HDL: high-density lipoprotein; TC: total
cholesterol; TG: triglycerides; AST: Aspartate aminotransferase; ALT: Alanine aminotransferase; γ-GT: γ-Gamma glutamyltransferase; VAT: Visceral adipose tissue; SAT: subcutaneous adipose tissue. SD: standard deviation. a - d Different literals per column indicate significant difference with Bonferroni post hoc test. P value defined as alpha < 0.05.
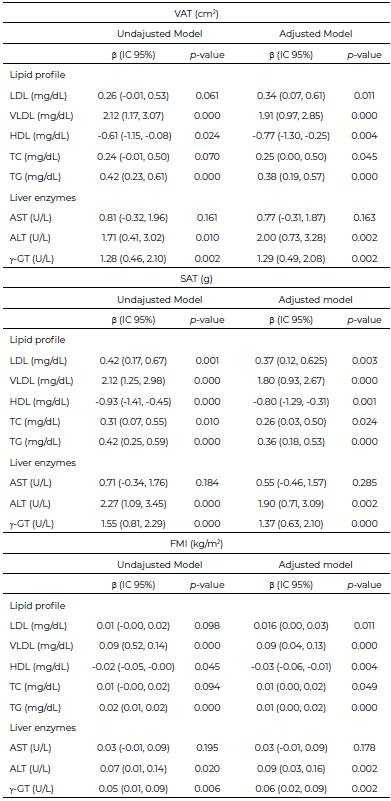
Regarding the association between lipid profile and liver enzymes with body fat distribution, a positive and statistically significant association was observed between VAT and SAT with the lipid profile (LDL, VLDL, TC, and TG), suggesting that higher VAT and SAT increase the concentrations of these lipoproteins. For HDL levels, the association was inversely significant with VAT and SAT, indicating that lower HDL concentrations correlate with higher VAT and SAT volume and mass, respectively. The same trend was observed for VAT and SAT with liver enzymes ALT and γ-GT; an increase in body composition parameters (VAT and SAT) was associated with alterations in these liver enzymes. FMI was also positively associated with liver enzymes and lipoproteins, indicating an increase in biochemical concentrations when VAT and SAT increased, except for HDL, where the association was negative, meaning HDL decreased when FMI increased (Table 4).
Discussion
Our study showed higher VAT levels in women compared with men, while the literature indicates that men tend to have higher VAT than women. However, national data from Mexico reported that women have a higher prevalence of abdominal adiposity than men (88.4% and 72.1%, respectively). It has also been reported that adults aged 20 - 29 years have a 62.1% prevalence of abdominal adiposity, and by region, Northern Mexico (which includes the state of Sonora) ranks second, with a high prevalence of this adiposity (83.5%) compared with other regions of the country, except for Mexico City, which shows the highest prevalence (88%) (15). In this regard, another study reported a subgroup of adults with a normal BMI but metabolic abnormalities called metabolically unhealthy normal weight in which 71.6% of women and 56.5% of men had elevated visceral adipose tissue (VAT); the same study also reported that 26.42% of women and 5.54% of men had central obesity (27). Similarly, in Mexican adults aged 20 - 64 years, women have been reported to engage in less physical activity than men (28), consistent with what we observed in our study population. These findings may offer a possible explanation for why men exhibited lower visceral adipose tissue (VAT) than women.
The findings of this study indicate a positive association between body fat distribution, as assessed by dual-energy X-ray absorptiometry (DXA), and biochemical concentrations of liver enzymes and lipid profiles. Furthermore, a negative association was observed between visceral adipose tissue (VAT) and subcutaneous adipose tissue (SAT) with high-density lipoprotein (HDL) concentrations. These associations were significant for most liver enzymes, except for aspartate aminotransferase (AST) (Figure 3).
Our study demonstrates that body fat distribution is related to changes in lipid biochemical parameters among university students, suggesting that an increase in body fat alters lipid concentrations, increasing the levels of lipoproteins (LDL and VLDL), TG, and TC. Previous studies align with our findings, establishing that an increase in visceral adiposity leads to elevated lipid biochemical profiles (29, 30). A descriptive, cross- sectional, prospective study determined the relationship between the degree of MASLD and quantitative lipid profile values in overweight and obese patients, reporting increased levels of TC, LDL, and TG from the early stages of fatty liver disease. Also, identified that elevated TG and LDL were indicative parameters of fatty liver disease; these are necessary to consider in diagnosis. They concluded that greater obesity and steatosis also increase LDL and decrease HDL, and significant lipid profile changes can occur even with overweight alone (31). Although hepatic steatosis was not evaluated in the patients in this study, biochemical parameters were used as risk indicators, which can be utilized for more specific studies and to prevent potential pathologies at an early age (university students).
Furthermore, we found a relationship between body fat distribution and alterations in liver enzyme parameters among university students. This indicates that an increase in visceral fat results in elevated plasma levels of liver enzymes. A previous study conducted on apparently healthy and preclinical Japanese subjects found that subcutaneous fat was not associated with significant changes in liver enzymes. Instead, visceral fat accumulation was positively associated with increased enzyme levels (32), which concurs with our study. Similarly, Kotronen et al. studied 356 American adults aged 18-70 years, reporting a significant correlation of SAT with TG (p < 0.01 females; p < 0.001 males), ALT (p < 0.05 females; P < 0.001 males) and AST (P < 0.001 males) and a negative relationship with HDL (p < 0.001 both sexes) and VAT with TG (p < 0.001 both sexes), ALT (P < 0.001 both sexes) and AST (p < 0.05 females; p < 0.001 males) and a negative relationship with HDL (p < 0.001 both sexes). These authors suggested that the association of VAT and liver enzymes might be an important indicator of increased liver fat in individuals with abdominal obesity (33). Another study by Liu et al. (34), evaluating 2986 participants (1581 with hepatic steatosis) over 18 years old, found that subjects with steatosis had higher levels of ALT, AST, TG, TC, and VAT area (p<0.001 for all) compared to those without steatosis. The association of VAT with ALT was also observed in the present study. Similarly, Mukherjee et al. evaluated 135 apparently healthy university students from Bangladesh regarding the presence of hepatic steatosis with liver enzymes and other variables, finding a positive relationship between ALT and γ-GT and hepatic steatosis, highlighting γ-GT elevation as a better predictor of fatty liver severity (regardless of etiopathogenesis) than ALT (35). Another study related to Chinese adults observed an increase in VAT associated with elevated γ-GT values (β = 0.796; P = 0.043), but not with ALT, and no significant association with other liver enzymes (36). This contrasts with our study findings. It appears that γ-GT elevation might be closely related to the progression towards developing fatty liver, and some authors have noted that this enzyme might play an important role in the formation and progression of metabolic dysfunction-associated steatotic liver disease (MASLD) (37).
FMI has proven to be a useful tool for evaluating body composition in subjects, eliminating the difference between fat-free mass and body fat associated with height. It is also useful for identifying individuals with excess muscle mass but without excess body fat (38). In this study, a significant association was found between FMI and lipid profile (LDL - p < 0.011; VLDL - p < 0.000; HDL - p < 0.004; TC - p < 0.049; TG - p < 0.000), as well as with liver enzymes (ALT – p < 0.002 and γ-GT – p < 0.002). These results align with those reported by Salinas et al. in young Mexican adults (18-25 years), who reported that an increase in FMI significantly correlated with high TG levels in both males and females (r = 0.293, p < 0.0001 females; r = 0.332, p< 0.0001 males). They also indicated that females with obesity and males with higher fat mass tend to present a higher risk of cardiovascular risk factors. The researchers confirmed that increased adiposity has an opposite association with metabolism, thereby increasing the risk of developing metabolic disorders (39).
There are biological mechanisms related to fat distribution, where different fat deposits regulate lipid metabolism differently, suggesting that metabolic dysfunction could be more associated with fat distribution (lipoproteins) (40). Additionally, visceral obesity is recognized to be associated with cardiovascular diseases (CVD) and alterations in lipid and carbohydrate metabolism. Akiyama et al. observed that patients diagnosed with increased abdominal obesity (ICT ≥ 0.5) tend to present significantly higher levels of TG, VLDL, and all VLDL subclasses (41). It has also been documented that VAT is highly lipolytic, directing lipid distribution primarily towards the liver, producing an excessive flow of nonesterified fatty acids, which can cause overproduction of VLDL, potentially leading to hypertriglyceridemia and indirectly increasing LDL levels through VLDL conversion, as well as increasing the risk of fatty liver disease (42). This accumulation of fat in the liver can also be associated with elevated liver enzymes above the normal interval (43). Denova-Gutiérrez et al. mentioned that obesity, metabolic syndrome, and insulin resistance promote increased serum levels of AST, ALT, and γ-GT (44). SAT represents the most voluminous structure of the body, and its lipolysis could affect blood lipid levels, with adipocytes in SAT potentially playing a significant role in the pathogenesis of certain diseases (45).
Our study has some limitations. Regarding the sample, it was convenience-based and non-probabilistic, comprising Health Sciences students, which may indicate a higher health awareness or lifestyle choices influenced by their academic training. Additionally, the cross-sectional design precludes the ability to establish causality, and the possibility of reverse causality cannot be ruled out. To mitigate this, participants provided a 24-hour dietary recall to reflect their usual consumption and family history. Selection bias (46) is likely due to the non- probabilistic nature of the sample, as students who opted to participate might have been more health-conscious and engaged in better self-care practices compared to those who did not participate, thereby limiting the generalizability of the findings to the broader population. Furthermore, non-differential measurement error may be inherent (47) in dietary information questionnaires, assessments of sleep quality, and evaluations of physical activity, as these tools rely on retrospective self-reporting and memory, which are subject to bias despite their continued use and validation in research. Likewise, the use of a single 24-hour dietary recall, instead of the recommended two or more recalls to capture habitual intake, may introduce recall bias and intra-individual variability, particularly for nutrients with high day-to-day variation (e.g., DHA and HEPA), since the lack of repeated measures limits the adjustment for within-person variability. Nevertheless, to mitigate this potential bias, the mean energy intake in our sample was estimated at 1823.36 kcal, which is comparable to the population mean reported by ENSANUT 2016 (1908.0 kcal) (48), supporting the validity of our group estimates and their consistency with nationally representative data. In the analysis of fat distribution by sex, overweight men were showed lower LDL and TC values compared to the normal group. This inconsistency could be explained by the sample size (overweight n=9 and normal n=26), which may have limited representativeness. It has also been reported that small samples can limit the ability to draw meaningful conclusions and generalize findings (49). Therefore, these results should be interpreted with caution, and further research with larger sample size should be conducted. Similarly, the obesity group had a smaller sample size (n=7), the magnitude of the effect was stronger in this group. This could be explained by the fact that this group had a higher amount of fat mass, which is associated with metabolic alterations (30), and the effect on LDL and TC levels was more consistent.
Our study has several important strengths. The primary one is the use of DXA, a reference standard considered one of the gold standards (50 – 52) for measuring body composition and fat distribution. It has high precision and reliability (r2=0.996) and low measurement variability (coefficient of variation [CV] less than 4%). It can estimate abdominal fat and quantify fat mass with a CV of 2%, and it has a good correlation for muscle mass compared to other methods (53). Another strength to consider is the biochemical evaluation of the lipid profile and liver enzymes using standardized methods, providing a detailed metabolic profile evaluation (54, 55). To mitigate unassessed confounding variables, multiple regression models were performed, and sample size calculation inferred greater statistical reliability.
Conclusions
The findings of this study indicate that body fat distribution (VAT and SAT) is associated with lipid levels (LDL, VLDL, TC, TG, and HDL) and certain liver enzymes (ALT and γ-GT) in university students. These may indicate the onset of metabolic alterations. Additionally, we demonstrated that FMI is a simple indicator that can function as a predictor of lipid profile and liver enzyme alterations, potentially aiding in the prevention of diseases related to excess and the type of body fat accumulation.
Acknowledgments
The authors express their gratitude to PCN. Itzel Yareli Hurtado Díaz, Víctor Oswaldo Valenzuela Bojórquez, Ana Cristina Amavizca Holguín, and Luz Fernanda Castro Campos for their valuable collaboration in taking anthropometric measurements, applying surveys, and determining VAT and SAT using DXA. We also thank PQBC. Sabrina Esquer Contreras, Marcos Eduardo Martínez Hernández, Gilberto Carlos Corella Contreras, and Dalila Rivera Gutiérrez for their support in blood sample collection and processing. Our gratitude extends to the Department of Health Sciences at the University of Sonora Cajeme campus, for providing the facilities and some materials necessary for the research development. Finally, we thank the faculty who encouraged the students to participate in this study.
Conflict of interest
The author(s) declared no potential conflicts of interest with respect to the research, authorship, and/ or publication of this article.
References
- World Health Organization. Obesity and overweight. Geneva: WHO; 2024. https://www.who.int/es/news-room/fact-sheets/detail/obesity-and-overweight
- Blüher M. Obesity: global epidemiology and pathogenesis. Nat Rev Endocrinol. 2019;15(5):288–98. https://doi.org/10.1038/s41574-019-0176-8
- Frank AP, Santos RS, Palmer BF, Clegg DJ. Determinants of body fat distribution in humans may provide insight about obesity-related health risks. J Lipid Res. 2019;60(10):1710–19. https://doi.org/10.1194/jlr.R086975
- Libby P. Inflammation during the life cycle of the atherosclerotic plaque. Cardiovasc Res. 2021;117(13):2525–36. https://doi.org/10.1093/cvr/cvab303
- López Maupomé A, Vacio Muro Mlos Á. La etapa universitaria y su relación con el sobrepeso y la obesidad. Rev Digit Univ. 2020;21(5):1–9. http://doi.org/10.22201/cuaieed.16076079e.2020.21.5.7
- Gholami F, Karimi Z, Samadi M, et al. The association between dietary pattern and visceral adiposity index, triglyceride glucose index, inflammation, and body composition among Iranian overweight and obese women. Sci Rep. 2023;13(1):13162. https://doi.org/10.1038/s41598-023-39653-x
- Loos RJF, Yeo GSH. The genetics of obesity: from discovery to biology. Nat Rev Genet. 2022;23(2):120–33. https://doi.org/10.1038/s41576-021-00414-z
- Nieto MC, Palacio MA. Alteraciones moleculares en el individuo metabólicamente obeso con peso normal. Revista Latinoamericana de Hipertensión. 2022;17(2):185–97. https://doi.org/10.5281/zenodo.6785198
- Porro S, Genchi VA, Cignarelli A, Natalicchio A, Laviola L, Giorgino F, Perrini S. Dysmetabolic adipose tissue in obesity: morphological and functional characteristics of adipose stem cells and mature adipocytes in healthy and unhealthy obese subjects. J Endocrinol Invest. 2021;44(5):921–41. https://doi.org/10.1007/s40618-020-01446-8
- Pérez MAJ, Cabrera W, Varela G, Garaulet M. Distribución regional de la grasa corporal: uso de técnicas de imagen como herramienta de diagnóstico nutricional. Nutr Hosp. 2010;25(2):207–23. https://doi.org/10.3305/nh.2010.25.2.4406
- Akter S. Non alcoholic fatty liver disease and steatohepatitis: risk factors and pathophysiology. Middle East J Dig Dis. 2022;14(2):167–81. https://doi.org/10.34172/mejdd.2022.270
- Lee MJ, Kim J. The pathophysiology of visceral adipose tissues in cardiometabolic diseases. Biochem Pharmacol. 2024;222:116116. https://doi.org/10.1016/j.bcp.2024.116116
- Mallick R, Basak S, Das RK, et al. Fatty acids and their proteins in adipose tissue inflammation. Cell Biochem Biophys. 2024;82(1):35–51. https://doi.org/10.1007/s12013-023-01185-6
- Marrón-Ponce JA, Sánchez-Pimienta TG, Louzada MLDC, Batis C. Energy contribution of NOVA food groups and sociodemographic determinants of ultra-processed food consumption in the Mexican population. Public Health Nutr. 2018;21(1):87-93. https://doi.org/10.1017/S1368980017002129
- Barquera S, Hernández-Barrera L, Trejo B, Shamah T, Campos-Nonato I, Rivera-Dommarco J. Obesidad en México, prevalencia y tendencias en adultos. Ensanut 2018-19. Salud Publica Mex 2020:682-9. https://doi.org/10.21149/11630
- Fujioka S, Matsuzawa Y, Tokunaga K, Tarui S. Contribution of intra-abdominal fat accumulation to the impairment of glucose and lipid metabolism in human obesity. Metabolism. 1987;36(1):54-9. https://doi.org/10.1016/0026-0495(87)90063-1
- Ladeiras Lopes R, Sampaio F, Bettencourt N, et al. El cociente entre la grasa abdominal visceral y la subcutánea evaluado por tomografía computarizada es un predictor independiente de mortalidad y eventos cardiacos. Rev Esp Cardiol. 2017;70(5):331–7. https://doi.org/10.1016/j.recesp.2016.09.006
- Messina C, Albano D, Gitto S, et al. Body composition with dual energy X ray absorptiometry: from basics to new tools. Quant Imaging Med Surg. 2020;10(8):1687–98. https://doi.org/10.21037/qims.2020.03.02
- Sanjur D, Rodríguez M. Evaluación de la ingesta dietaria: aspectos selectos en la colección y el análisis de datos. In: División deficiencias nutricionales. Programa de Nutrición Comunitaria. Colegio de Ecología Humana. Cornell Univ; 1997.
- Pérez AB, Palacios B. Sistema Mexicano de Alimentos Equivalentes (SMAE). Ciudad de México: Fomento de Nutrición y Salud, A.C.; 2024.
- Esparza Ros A, Vaquero Cristóbal R, Marfell Jones M J. Protocolo internacional para la valoración antropométrica. Perfil restringido. Int Soc Adv Cineanthropometry; 2019.
- Jiménez Genchi A, Monteverde Maldonado E, Nenclares Portocarrero A, Vega Pacheco GEM, de la A. Confiabilidad y análisis factorial de la versión en español del índice de calidad de sueño de Pittsburgh en pacientes psiquiátricos. Gac Med Mex. 2008;144(6):491–96. https://www.medigraphic.com/cgi-bin/new/resumen.cgi?IDARTICULO=21491
- Mantilla SC, Gómez Conesa A. El Cuestionario Internacional de Actividad Física. Un instrumento adecuado en el seguimiento de la actividad física poblacional. Rev Iberoam Fisioter Kinesiología. 2007;10(1):48–52. https://doi.org/10.1016/S1138-6045(07)73665-1
- Faul F, Erdfelder E, Lang AG, Buchner A. G*Power 3: a flexible statistical power analysis program for the social, behavioral, and biomedical sciences. Behav Res Methods. 2007;39(2):175–91. https://doi.org/10.3758/bf03193146
- Mahmoud OM, Mahmoud GAE, Atta H, Abbas WA, Ahmed HM, Abozaid MAA. Visceral and subcutaneous fat, muscle mass, and liver volume as noninvasive predictors of the progress of non alcoholic fatty liver disease. Egypt J Radiol Nucl Med. 2023;54(1):5. https://doi.org/10.1186/s43055-022-00949-z
- Textor J, vander Zander B, Gilthorpe MS, Liskiewicz M, Ellison GTH. Robust causal inference using directed acyclic graphs: the R package ‘dagitty’. Int J Epidemiol. 2017;45(6):1887–94. https://doi.org/10.0.4.69/ije/dyw341
- Lu YC, Lin YC, Yen AM-F, et al. Adipose tissues assessed by dual-energy X-ray absorptiometry in metabolically unhealthy normal-weight Asians. Sci Rep. 2019;9:17698. https://doi.org/10.1038/s41598-019-53557-9
- Medina C, Jáuregui A, Hernández C, González C, Olvera AG, Blas N, Campos I, Barquera S. Prevalencia de comportamientos del movimiento en población mexicana. Salud Publica Mex. 2023;65(Supl 1):S259–S267. https://doi.org/10.21149/14754
- Ribeiro Filho FF, Mariosa LS, Ferreira SRG, Zanella MT. Visceral fat and metabolic syndrome: more than a simple association. Arq Bras Endocrinol Metabol. 2006;50(2):230–9. https://doi.org/10.1590/S0004-27302006000200009
- Tayefi M, Tayefi B, Darroudi S, Mohammadi Bajgiran M, Mouhebati M, Heidari Bakavoli A, et al. There is an association between body fat percentage and metabolic abnormality in normal weight subjects: Iranian large population. Transl Metab Syndr Res. 2019;2(1):11. https://doi.org/10.1016/j.tmsr.2019.08.001
- Mesa SG, Indhira M. Relación entre el grado de esteatosis hepática grasa no alcohólica por ultrasonografía y valores cuantitativos en el perfil lipídico de los pacientes con sobrepeso y obesidad atendidos en la consulta de atención primaria en el periodo abril mayo 2020 del Hospital Central de las Fuerzas Armadas [tesis]. Santo Domingo: Univ. Nacional Pedro Henríquez Ureña; 2020.
- Mochizuki K, Miyauchi R, Misaki Y, et al. Accumulation of visceral fat is positively associated with serum ALT and ï§ GTP activities in healthy and preclinical middle aged Japanese men. J Nutr Sci Vitaminol (Tokyo). 2011;57(1):65–73. https://doi.org/10.3177/jnsv.57.65
- Kotronen A, Yki Järvinen H, Sevastianova K, Bergholm R, Hakkarainen A, Pietiläinen KH, et al. Comparison of the relative contributions of intra abdominal and liver fat to components of the metabolic syndrome. Obesity (Silver Spring). 2011;19(1):23–28. https://doi.org/10.1038/oby.2010.137
- Liu Y, Chai S, Zhang X. Association between different parameters of adipose distribution and transient elastography assessed hepatic steatosis in American adults with diabetes, prediabetes and normal glucose tolerance. Diabetes Metab Syndr Obes. 2023;16:299–308. https://doi.org/10.2147/DMSO.S394564
- Mukherjee S, Saha S, Banerjee U, Banerjee AK, Banerjee R. A correlational study of hepatic steatosis (fatty liver disease) and liver enzymes (ALT, AST, GGT) in the scenario of insulin resistance among young medicos. Biosci Biotechnol Res Asia. 2021;17(4):717–26. https://doi.org/10.13005/bbra/2876
- Tang L, Yuan B, Zhang F, et al. Visceral fat is associated with elevation of serum alanine aminotransferase and gamma glutamyltransferase in middle aged Chinese adults. Postgrad Med J. 2018;94(1117):641–46. https://doi.org/10.1136/postgradmedj-2018-135644
- Xuan Y, He F, Liu Q, et al. Elevated GGT to HDL ratio as a marker for the risk of NAFLD and liver fibrosis. Sci Rep. 2025;15(1):10. https://doi.org/10.1038/s41598-024-84649-w
- Kyle UG, Schutz Y, Dupertuis YM, Pichard C. Body composition interpretation: contributions of the fat free mass index and the body fat mass index. Nutrition. 2003;19(7):597–603. https://doi.org/10.1016/S0899-9007(03)00061-3
- Salinas Mandujano RG, Reynoso Camacho R, Salgado LM, et al. A new approach using BMI and FMI as predictors of cardio vascular risk factors among Mexican young adults. Eur J Invest Health Psychol Educ. 2023;13(10):10. https://doi.org/10.3390/ejihpe13100146
- Karpe F, Pinnick KE. Biology of upper body and lower body adipose tissue—link to whole body phenotypes. Nat Rev Endocrinol. 2015;11(2):90–100. https://doi.org/10.1038/nrendo.2014.185
- Akiyama H, Iwata F, Okada T. Lipoprotein subclass particle numbers in children with abdominal obesity. Pediatr Int. 2022;64(1):e15045. https://doi.org/10.1111/ped.15045
- Moreira VC, Silva CMS, Welker AF, da Silva ICR. Visceral adipose tissue influence on health problem development and its relationship with serum biochemical parameters in middle aged and older adults: a literature review. J Aging Res. 2022;2022:8350527. https://doi.org/10.1155/2022/8350527
- Castro AL, Arriaga HE, Palacios del C. Hepatic steatosis (HS) as a factor associated with the presence of metabolic risk in obese school aged children and adolescents. Gac Med Mex. 2014;150:95–100. PMID: 25643684
- Denova Gutiérrez E, Lara Castor L, Hernández Alcaraz C, et al. Prevalence and predictors of elevated liver enzyme levels in Mexico: The Mexican National Health and Nutrition Survey, 2016. Ann Hepatol. 2021;26:100562. https://doi.org/10.1016/j.aohep.2021.100562
- Sbarbati A, Accorsi D, Benati D, et al. Subcutaneous adipose tissue classification. Eur J Histochem. 2010;54(4):e48. https://doi.org/10.4081/ejh.2010.e48
- Hernández Avila M, Garrido F, Salazar Martínez E. Sesgos en estudios epidemiológicos. Salud Pública México. 2000;42(5):438–446. https://www.scielosp.org/pdf/spm/v42n5/3995.pdf
- Innes GK, Bhondoekhan F, Lau B, Gross AL, Ng DK, Abraham AG. The measurement error elephant in the room: challenges and solutions to measurement error in epidemiology. Epidemiol Rev. 2021;43(1):94–105. https://doi.org/10.1093/epirev/mxab011
- Ramírez-Silva I, Rodríguez-Ramírez S, Barragán-Vázquez S, et al. Prevalence of inadequate intake of vitamins and minerals in the Mexican population correcting by nutrient retention factors, Ensanut 2016. Salud Publica Mex. 2020;62(5):521-31. https://doi.org/10.21149/11096
- Yang S, Berdine G. Small sample size. Southwest Respir Crit Care Chron. 2023;11(49):52-5. https://doi.org/10.12746/swrccc.v11i49.1251
- Mattsson S, Thomas BJ. Development of methods for body composition studies. Phys Med Biol. 2006;51(13):R203–R228. https://doi.org/10.1088/0031-9155/51/13/R13
- González J. Análisis de composición corporal y su uso en la práctica clínica en personas que viven con obesidad. Rev Méd Clínica Las Condes. 2022;33(6):615–22. https://doi.org/10.1016/j.rmclc.2022.08.005
- Kelly TL, Wilson KE, Heymsfield SB. Dual energy X Ray absorptiometry body composition reference values from NHANES. PLoS One. 2009;4(9):e7038. https://doi.org/10.1371/journal.pone.0007038
- Costa O, Alonso Aubin D, Patrocinio C, Candia Luján R, De Paz J. Métodos de evaluación de la composición corporal: una revisión actualizada de descripción, aplicación, ventajas y desventajas. Arco. medicina deporte. 2015;32(6):387–394. https://archivosdemedicinadeldeporte.com/articulos/upload/rev1_costa_moreira.pdf
- Murray R. Alanine aminotransferase. In: Kaplan A, editor. Clin Chem. St Louis: CV Mosby Co; 1984. p. 1088–90, 1112–16. https://www.spinreact.com/assets/files/Inserts/Bioquimica/BEIS11_GPT_ALT-2016.pdf
- Gendler S. Gamma GT. In: Kaplan A, editor. Clin Chem. St Louis: CV Mosby Co; 1984. p. 1120–23. https://www.spinreact.com/assets/files/Inserts/Bioquimica/BEIS08_GGT_2016.pdf