Introduction
The World Health Organization (WHO) recommends that the population's sodium intake should be less than 2000 mg per day to reduce cardiovascular risk [1]. In Mexico, studies conducted in healthy populations have reported average intakes between 3150 to 3490 mg of sodium per day [2,3], as measured by 24-hour urinary sodium excretion. According to the Mexican National Health and Nutrition Survey 2016 (ENSANUT 2016), the average daily sodium intake for adults, determined by a 24-hour food recall, was 3132 mg [4]. More recent data from the National Health and Nutrition Survey (ENSANUT) Continua 2020-2022 reveal that the dietary patterns of both adult and adolescent populations in Mexico are characterized by a considerable consumption of diverse food groups. However, a concerning trend is the high intake of non-recommended products. Notably, sodium intake is elevated, linked to both total caloric intake and the prevalence of ultra-processed foods, and this is associated with an increased risk of developing overweight, obesity, and various non-communicable chronic diseases such as insulin resistance, diabetes, dyslipidemia, and hypertension [5]. In Mexico, there has been an increase in the purchase of processed and ultra-processed foods in recent years [4]. A national dietary analysis indicates that these foods contribute 39% to 49% of total sodium intake [4]. Additionally, it has been reported that over 50% of adults dine out three or more times a week, and more than 35% consume fast food more than twice a week [6]. which has been identified to be a relevant source of dietary sodium in the diet [7]. However, its sodium content is not declared due to the unpackaged nature of these type of foods.
There are different methods to assess sodium intake, which include biomarkers (24-hour urine sodium as gold standard [8] and single-moment urine sodium, and dietary methods (multi-day food diaries, food recall, and food consumption frequencies) [9].
Currently, several sodium-rich food frequency questionnaires have been developed to estimate sodium intake in different populations [10,11], although their validity has been limited for most of them. Mobile device technology and interactive software are emerging as useful tools for collecting information and assessing dietary intake[12]. These new technologies have the potential to improve dietary assessment as they are practical and better accepted by participants. However, more research is still needed to determine the validity of these methods for estimating sodium intake especially in populations with a high burden of chronic illnesses.
The “Sodium Calculator” (SC) [13] is an online tool developed in Mexico, adapted from a Canadian model [14], designed to provide users with immediate feedback on their estimated daily sodium intake. The SC assesses the frequency of consumption and serving sizes for 71 questions covering four main categories of sodium-rich foods: meals prepared outside the home, home-cooked meals including Mexican "antojitos", sweets, and processed foods, including discretionary salt use. Currently available to the public at https:// calculadorasodio.github.io/, the SC questionnaire has demonstrated content and appearance validity by expert criteria, with its development methodology previously published [13]. This study aims to evaluate the SC criterion validity by assessing its test-retest reliability and concurrent validity. Demonstrating concurrent validity is crucial, as it assesses the degree to which the SC estimates of sodium intake align with those obtained from established methods.
Material and methods
1. Type of study sample size
A prospective observational validation study was conducted. The sample size was calculated to achieve adequate power, considering a ratio of 5 participants per item, a benchmark considered "good" in validation studies according to Comrey et al. [15]. This calculation determined a target sample size of 355 participants.
2. Participants
The study included men and women aged 18 years or older who met specific health criteria. Individuals were excluded if they had any of the following: a pre-existing diagnosis of arterial hypertension, a history of cardiovascular, renal, or liver disease, active menstruation, pregnancy, or urinary tract infection at the time of urine collection. Additional exclusion criteria included being over 65 years of age or the inability to complete the Sodium Calculator (SC) questionnaire twice. Participants were recruited from September 2022 to January 2023, encompassing employees of the Instituto Nacional de Ciencias Médicas y Nutrición Salvador Zubirán (INCMNSZ), workers at two textile factories (one in Mexico City, the other in the State of Mexico), and the general public (family members or visitors of the INCMNSZ).
3. Procedures
Potential participants underwent initial eligibility verification. Eligible individuals received verbal and written instructions detailing proper 24-hour urine collection and completion of a 3-day food record. After providing written informed consent, participants attended a scheduled study visit at their respective work site (INCMNSZ or textile factory) or, for those recruited from the general public, at the INCMNSZ. At the visit, anthropometric and body composition assessments were performed, and sociodemographic data were collected. Participants then completed the online SC instrument. To assess test-retest reliability, participants completed the SC again one week later. All procedures were reviewed and approved by the INCMNSZ Ethics Committee (REF. 3314).
4. Sodium Calculator Administration
Participants completed the online Sodium Calculator (SC) on a tablet provided by the research team, noting the start and end time of the survey. To ensure understanding, research staff members were present to answer any questions. The SC assesses the frequency of consumption and serving sizes for 71 questions spanning four main categories of sodium-rich foods: meals prepared outside the home, home-cooked meals including Mexican "antojitos" (savory street foods), sweets, and processed foods, including discretionary salt use. The staff then recorded the results.
5. Anthropometric Measurements and Body Composition
Weight was measured using a Seca ®769 mechanical column scale (capacity: 200 kg, accuracy: 0.05 kg). Height was measured with a Seca® 220 stadiometer (accuracy: 1 mm). Both measurements were performed with participants fasting, without shoes, and wearing a hospital gown, following the International Society for the Advancement of Kinanthropometry (ISAK) guidelines [16]. Body composition was assessed via bioelectrical impedance analysis using a RJL® Quantum IV bioimpedance analyzer. Participants fasted for at least four hours and were measured in a decubitus position with four conventional electrodes placed on the right hand and foot. Resistance and reactance data (collected at 50 kHz) were used to estimate lean mass, fat mass, and total body water using the Body Composition software provided by the impedance equipment manufacturer.
6. Food Consumption Records
Dietary intake was assessed using a detailed 3-day food diary. Participants recorded all foods and beverages consumed from the first intake upon waking until the last intake before sleeping, specifying dishes and quantities. They were instructed to record their intake on two weekdays and one weekend day to ensure a comprehensive representation of their typical eating patterns. Food Processor software was used to analyze the collected data.
7. Blood Pressure Measurement
Blood pressure was measured after a resting phase of at least five minutes. Systolic and diastolic blood pressure were measured in the left arm in a sitting position using a nebucor (State of Mexico, Mexico) brand digital baumanometer
8. 24-Hour Urine Collection
24-hour urine sodium excretion (24hr UNa) served as the reference method for estimating sodium intake. Participants received instructions to discard the first morning urine and collect all subsequent micturitions over 24 hours, including the first urine of the following morning. Participants were provided with a preservative-free container and instructed to store it in a cool place during the collection period. Urinary sodium was determined via the ion-selective electrode method, and urinary creatinine was determined by Jaffe colorimetric assay in the INCMNSZ central laboratory. Completeness of urine samples was assessed based on urinary creatinine concentrations, using established reference ranges for men (15-25 mg/kg/24 hours) and women (10-20 mg/kg/24 hours) [17]. Urine collections with a volume less than 500 ml were excluded, along with those not meeting the creatinine-based completeness criteria.
9. Statistical Analysis
Data are presented as means and standard deviations for quantitative and parametric variables. Medians and interquartile ranges (IQR) were used for non-parametric variables, and the trimmed mean was used for outlier data. Categorical variables are presented as frequencies and percentages. The Kolmogorov-Smirnov test assessed the distribution of variables. Spearman correlation analysis evaluated the relationship between estimated daily sodium intake (SC) and 24-hour urinary sodium excretion. The strength of correlation was interpreted as perfect (±1), strong (±0.7 to 0.99), moderate (±0.4 to 0.69), and weak (±0.1 to 0.39) [18]. To evaluate test-retest reliability and concurrent criterion validity, the intraclass correlation coefficient (ICC) was calculated. Test-retest reliability was evaluated using the ICC to compare the SC's performance during the first and second assessments. For concurrent criterion validity, the ICC for absolute agreement between the mg of sodium consumed per day estimated by SC and the mg of sodium excreted in 24-hour urine was calculated. The ICCs were interpreted as excellent (above 0.90), good (0.75 to 0.90), moderate (0.5 to 0.75), and poor (below 0.5) [19,20]. Bland-Altman plots estimated the mean difference between sodium intake values obtained by both methods, with 95% limits of agreement (mean difference ± 1.96 standard deviations) calculated. Sensitivity, specificity, positive predictive value (PPV), and negative predictive value (NPV) of the SC for classifying individuals with a daily sodium intake ≥ 2300 mg of sodium (compared to 24hr UNa) were calculated, using the American Heart Association (AHA) recommendation as the cutoff for consumption [21]. Finally, a logistic regression model was employed to estimate the odds ratio (OR) and 95% confidence interval (CI), both crude and adjusted for sex and BMI, for the association between SC sodium estimate and urinary sodium excretion at different levels: ≥ 2,000 mg/day, ≥ 2,300 mg/day, ≥ 2,500 mg/day, ≥ 2,800 mg/day and ≥ 3,000 mg/day. A p-value <0.05 was considered statistically significant. Statistical analysis was performed with SPSS Version 26.0.
Results
1. Study Population and Baseline Characteristics
A total of 353 individuals were initially assessed for eligibility, with 251 participants ultimately meeting inclusion criteria and providing complete datasets for the primary analyses of this validation study (Figure 1). The reasons for exclusion from the study included incomplete urine sample collection, and some of the individuals who had a high value in results were considered to have had extreme values which were ruled as the SC sodium intake estimate. Table 1 presents the demographic and body composition characteristics of the final study sample. The sample was predominantly female (80%), with both male and female participants exhibiting a mean body mass index (BMI) indicative of the overweight category. Systolic and diastolic blood pressure measurements were within normal clinical reference ranges. Body composition analysis further revealed that the percentage of body fat within the cohort was elevated relative to standard age-specific reference values [22].
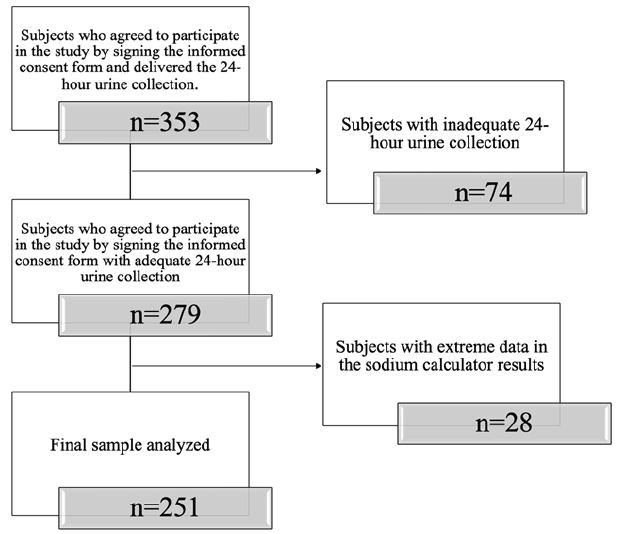
Figure 1. Participant selection flowchart.
Table 1. General characteristics and body composition measurements (n= 251)
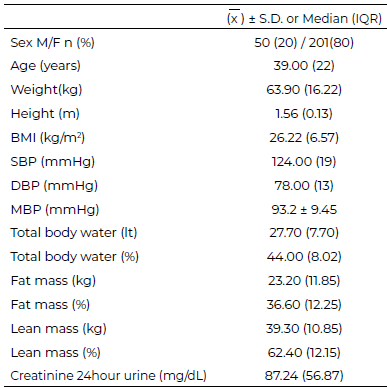
M=males, F=females, BMI=body mass index, SBP= systolic blood pressure, DBP=diastolic blood pressure, MBP=mean arterial blood pressure.
2. Test-Retest Reliability and Concurrent Criterion Validity
The relationship between estimated sodium intake as assessed by the Sodium Calculator (SC) and 24-hour urinary sodium excretion (24hr UNa), the established gold standard for sodium intake assessment, was examined using Spearman correlation analysis. This analysis revealed a statistically significant, but weak, positive correlation coefficient (r=0.19, p=0.002) between SC estimates and 24hr UNa. The test-retest reliability of the SC questionnaire was assessed through calculation of the intraclass correlation coefficient (ICC) comparing sodium intake estimates derived from the initial and subsequent administrations of the instrument. Results indicated moderate agreement between SC administrations (ICC=0.46, 95% CI 0.31-0.58, p<0.001). Concurrent criterion validity, reflecting the agreement between SC estimates and 24hr UNa, was evaluated using the intraclass correlation coefficient. This analysis demonstrated poor agreement between the SC and 24hr UNa (ICC=0.18, 95% CI 0.33-0.59, p=0.05) (Table 2), suggesting limited concurrent validity.
Table 2. Intraclass correlation coefficients SC, 24h Uri-Na and test-retest SC (n = 251)
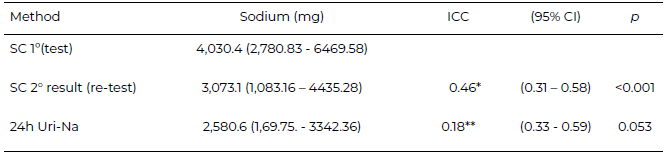
SC=Sodium calculator, 24h Uri-Na=24-hour urine sodium excretion
*ICC=Intraclass correlation coefficient for first and second dietary sodium intake estimates by SC (test-retest)
** ICC = Intraclass correlation coefficients for SC and 24h Uri-Na.
3. Quantification of Bias in Sodium Intake Estimation
Evaluation of potential bias in sodium intake estimation by the SC relative to 24hr UNa was conducted using Bland-Altman analysis. This analysis revealed a substantial average bias of 2524 mg sodium, indicating a tendency for the SC to systematically overestimate sodium intake compared to measurements obtained by 24hr UNa. Visual inspection of individual data points on the Bland-Altman plot (Plot 2A) identified 14 outlier values that exceeded the pre-defined limits of agreement, providing further evidence of discrepancies between the two methods. Additional Bland-Altman analysis of test-retest reliability, comparing initial and subsequent administrations of the SC, demonstrated a bias of 1180 mg sodium, with lower values observed in the first assessment relative to the second (Figure 2B).
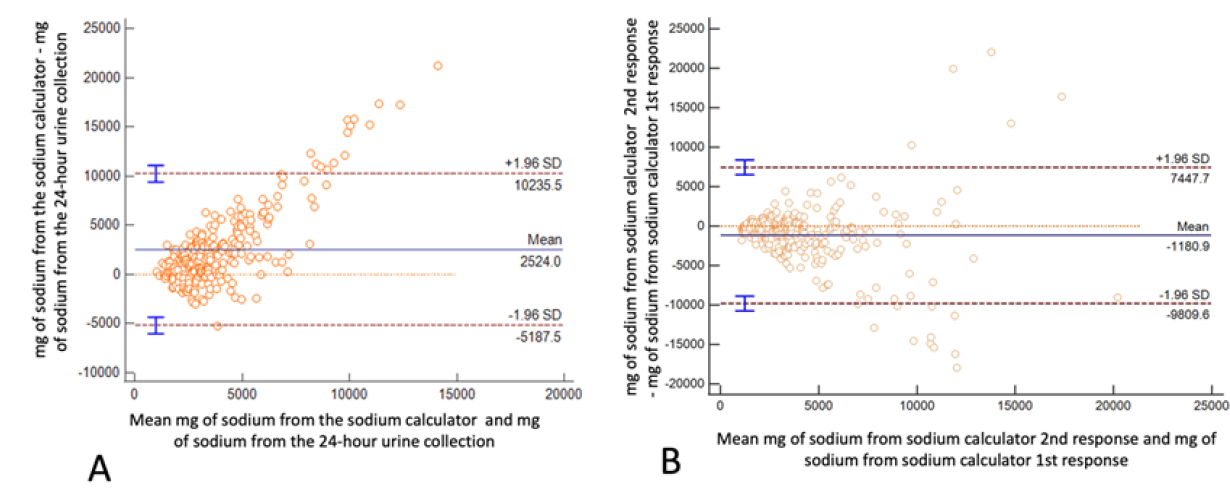
Figure 2. A Bland-Altman plot illustrates the relationship between the differences and the magnitude of the measurements between the sodium mg estimated by the sodium calculator and the 24-hour urine collection. B Bland-Altman plot presents the difference and the mean of variables assessed by the Sodium Calculator on two separate occasions, response 1 and response 2 are considered.
4. Diagnostic Accuracy for Identifying High Sodium Intake
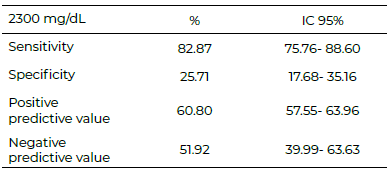
The ability of Sodium Calculator to classify individuals with dietary sodium intake at or above 2300 mg/day, the recommendation established by the American Heart Association (AHA), was determined using the 24hr UNa as the reference standard. Results demonstrated a acceptable sensitivity (82.87%, 95% CI 75.7-88.6%), indicating the SC is capacity to correctly identify individuals with elevated sodium intake. However, specificity was low (25.71%, 95% CI 17.68-35.16%), suggesting a significant proportion of individuals with sodium intake below the 2300 mg/day threshold were incorrectly identified as having elevated intake by the SC (Table 3).
Table 3. Sensitivity and specificity of SC (n = 251)
5. Predictors of Elevated Sodium Intake
Logistic regression analyses (Table 4) were performed to evaluate the association between SC-estimated sodium intake and 24hr UNa at various intake levels (ranging from 2000 mg/day to 3000 mg/day). All levels of dietary sodium intake estimated by the SC were found to be significantly associated with the respective 24hr UNa levels (p<0.001 for all levels), with the strongest association observed for a sodium intake estimate exceeding 2000 mg/day (OR: 4.34, 95% CI: 2.52-7.47). This association was found to remain statistically significant after adjusting for potential confounding effects of BMI and sex.
Table 4. Binary logistic regression between urinary sodium excretion and SC
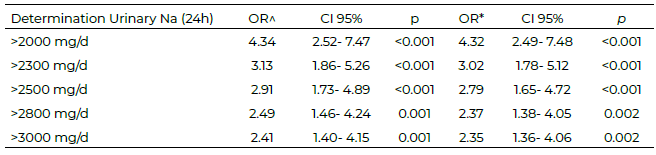
^ Raw analysis.
*Adjusted analysis (sex and BMI=body mass index)
Discussion
The most reliable method for quantifying dietary sodium intake is 24-hour urinary sodium excretion (UNa), considered the gold standard. However, this method is time-consuming, imposes a high burden on participants, and requires trained healthcare professionals for interpretation. This study evaluated the test-retest reliability and concurrent criterion validity of an online, self-administered tool called the Sodium Calculator (SC) [13]. Participants completed the SC twice, with an average interval of 55 ± 5.3 days between assessments. Although the intended retest period was 7 days, many participants did not adhere to this schedule, which may have influenced the results. Adhering strictly to the 7-day retest interval might have yielded a higher Intraclass Correlation Coefficient (ICC). The SC demonstrated moderate reliability with an ICC of 0.46 (p < 0.001), which is lower than the ICC of 0.98 (95% CI 0.95-0.99) reported by Gallani et al. [23], who also assessed test-retest reliability of a food frequency questionnaire by administering it twice. The difference in ICC values may be attributed to the longer interval between tests in the present study compared to 7–15 days in Gallani et al. work. Despite the longer interval, the moderate retest reliability supports the temporal stability of the SC. Moreover, unlike the paper-based questionnaires used by Gallani et al., the SC is an online tool providing instant feedback, which offers the convenience of remote access [23].
The correlation between SC sodium estimates and 24-hour urinary sodium was weak but significant (r = 0.19, p = 0.002), consistent with findings from Charlton et al. [10], who developed a short questionnaire to classify sodium intake in South Africans and reported a similar weak positive correlation (r = 0.15, p = 0.105). Similarly, Gallani et al. [23] found a weak yet significant correlation (r = 0.29, p < 0.001) when combining a food frequency questionnaire and discretionary salt questionnaire. These weak correlations are common in food frequency questionnaires (FFQs) due to inherent limitations such as self-report biases, including misunderstanding questions, social desirability, misclassification, and dishonesty, all of which may reduce concordance with biomarker-based methods [24–27].
Bland-Altman analysis revealed that the SC overestimated daily sodium intake by approximately 2524 mg compared to 24-hour UNa, a magnitude comparable to the 2300 mg overestimation reported by Gallani et al. [23]. Although FFQs generally tend to overestimate intake [28,29], the bias observed here is less than the 9.1 grams difference noted in another FFQ validation study [28].
While the SC may not be precise for exact quantification, its utility as a screening tool is promising. The SC demonstrated acceptable sensitivity (82.43%) but low specificity (25.71%) for identifying individuals consuming ≥2300 mg/day sodium, which differs from the higher specificity reported by Jiménez Rodríguez et al. [30], who found sensitivity and specificity of 91.4% and 96.2%, respectively, using a 24-hour recall and food frequency questionnaire compared against 24-hour UNa. Mason et al. [31] reported a sensitivity of 61% and specificity of 82% for a sodium screening questionnaire (SSQ) in chronic kidney disease patients. Unlike these tools focused primarily on classification, the SC estimates average daily sodium intake by assessing both portion sizes and frequency of consumption. It is important to note that Hosmer and Lemeshow suggest that a test with a sensitivity above 80% is considered “acceptable” [32]. Other authors such as Greiner et al. [33], propose similar ranges, but emphasize that the ideal value depends on the balance between sensitivity and specificity, and on the clinical or public health implications.
Despite overestimation, the SC effectively discriminated individuals exceeding 2000 mg/day sodium intake, aligning with findings by Cooper et al. [34], who validated the SALT tool for identifying high sodium consumers. The SC was developed following rigorous clinimetric methods [13] [35–37], incorporating frequency of consumption and discretionary salt use, often omitted in other tools. Importantly, it is among the few online sodium assessment tools available in Mexico, accessible anytime at no cost, requiring only internet access.
Limitations include the SC specificity to Mexico City dietary patterns, necessitating numerous questions to capture diverse food choices, including street foods, which may deter accurate responses due to length. The tool also requires users to possess adequate literacy and cognitive skills to complete it reliably. Additionally, participant reluctance to perform 24-hour urine collections posed challenges, underscoring the need for practical tools like the SC as alternatives to biomarker methods. Future studies should aim to reduce the time interval between test and retest to enhance reliability. Although the final sample size of 251 was 70% of the initially calculated 355, it remains adequate for validation purposes per Comrey and Lee criteria [15].
Given the increasing interest in innovative, practical dietary assessment methods, mobile and interactive technologies like the SC offer promising avenues for sodium intake estimation. The SC can facilitate individual awareness, enable healthcare workers to monitor at-risk patients, and serve research and intervention studies in Mexico, where hypertension, cardiovascular, and renal diseases linked to high sodium intake are highly prevalent.
This study was not funded by any organization or agency. For access to the study data, please contact the lead authors.
Conclusions
The Sodium Calculator (SC) showed moderate test-retest reliability and the ability to distinguish between different levels of sodium intake. However, the low agreement with 24-hour urinary sodium excretion (UNa), the established reference method, prevents it from being validated as an accurate quantitative measure of daily sodium intake.
Therefore, the findings do not support the widespread use of the SC as a continuous measure of sodium consumption. Nonetheless, we did find that it can identify increased risk, indicating potential utility like a screening tool in the same population.
Future studies should focus on the potential of the tool as a screening design and also the data with those methods.
Acknowledgments
The authors wish to express their sincere gratitude to all study participants for their valuable collaboration and time. Appreciation is also extended to the staff involved from the Instituto Nacional de Ciencias Médicas y Nutrición Salvador Zubirán (INCMNSZ) and to the workers of the textile factories in Mexico City and the State of Mexico for their invaluable support in the data collection process.
Conflict of Interest
The authors declare no competing financial or personal interests that could have influenced the results or interpretation of this study. The absence of direct external funding ensures the independence of the researchers in the study design, data collection, analysis, and interpretation, as well as in the preparation and publication of the manuscript.
References
- World Health Organization /Volkov. Sodium reduction. 2025. https://www.who.int/news-room/fact-sheets/detail/sodium-reduction
- Vallejo M, Colín-Ramírez E, Rivera Mancía S, Cartas Rosado R, Madero M, Infante Vázquez O, et al. Assessment of Sodium and Potassium Intake by 24 h Urinary Excretion in a Healthy Mexican Cohort. Arch Med Res. 2017;48 (2):195–202. https://doi.org/10.1016/j.arcmed.2017.03.012
- Vega-Vega O, Fonseca-Correa JI, Mendoza-De la Garza A, Rincón-Pedrero R, Espinosa-Cuevas A, Baeza-Arias Y, et al. Contemporary Dietary Intake: Too Much Sodium, Not Enough Potassium, yet Sufficient Iodine: The SALMEX Cohort Results. Nutrients. 2018;10 (7): 816. https://doi.org/10.3390/nu10070816
- Vargas-Meza J, Cervantes-Armenta MA, Campos-Nonato I, Nieto C, Marrón-Ponce JA, Barquera S, et al. Dietary Sodium and Potassium Intake: Data from the Mexican National Health and Nutrition Survey 2016. Nutrients. 2022;14(2):281. https://doi.org/10.3390/nu14020281
- Gaona-Pineda EB, Rodríguez-Ramírez S, Medina-Zacarías MC, Valenzuela-Bravo DG, Martínez-Tapia B, Arango-Angarita A. Consumidores de grupos de alimentos en población mexicana. Ensanut Continua 2020-2022. Salud Publica Mex. 2023;65 (Supl 1): s248-s258. https://doi.org/10.21149/14785
- Ju SY. Changes in Eating-Out Frequency according to Sociodemographic Characteristics and Nutrient Intakes among Korean Adults. Iran J Public Health. 2020;49(1):46-55. https://doi.org/10.18502/ijph.v49i1.3051
- Morales-Guerrero JC, Miranda-Alatriste PV, Villafuerte-Salazar MG, Espinosa-Cuevas Á, Cassis-Nosthas L, Colín-Ramírez E. Determination of the chemical compositions of Mexican antojitos and dishes in Mexico City. J Food Compos Anal. 2023; 118:105156. https://doi.org/10.1016/j.jfca.2023.105156
- Colín-Ramírez E, Arcand J, Ezekowitz JA. Estimates of Dietary Sodium Consumption in Patients With Chronic Heart Failure. J Card Fail. 2015;21(12):981–988. https://doi.org/10.1016/j.cardfail.2015.08.345
- Bentley B. A review of methods to measure dietary sodium intake. J Cardiovasc Nurs. 2006;21(1):63–67. https://doi.org/10.1097/00005082-200601000-00012
- Charlton KE, Steyn K, Levitt NS, Jonathan D, Zulu JV, Nel JH. Development and validation of a short questionnaire to assess sodium intake. Public Health Nutr. 2008;11(1):83–94. https://doi.org/10.1017/s1368980007000146
- Miranda-Alatriste PV, Colín Ramírez E, Guillén Hernández M, Rivera Mancía S, Rosado RC, Espinosa-Cuevas Á, et al. Nutrición Hospitalaria Trabajo Original Valoración nutricional Development of a screening tool for a high sodium intake in an adult Mexican population. 2018; 35 (5): 1163-1173. http://doi.org/10.20960/nh.1789
- Zhu F, Bosch M, Woo I, Kim S, Boushey CJ, Ebert DS, et al. The Use of Mobile Devices in Aiding Dietary Assessment and Evaluation. IEEE J Sel Top Signal Process. 2010;4(4):756-766. https://doi.org/10.1109/jstsp.2010.2051471
- Colín-Ramírez E, Cartas-Rosado R, Miranda Alatriste PV, Espinosa Cuevas Á, Arcand J, Morales Guerrero JC, et al. Development of an online tool for sodium intake assessment in Mexico. Rev Panam Salud Pública. 2019;43:1–6. https://doi.org/10.26633/RPSP.2019.90
- Arcand J, Abdulaziz K, Bennett C, L’abbé MR, Manuel DG. Developing a Web-based dietary sodium screening tool for personalized assessment and feedback. Appl Physiol Nutr Metab. 2014;39(3):413–414. https://doi.org/10.1139/apnm-2013-0322
- 15. Comrey AL, Lee HB. A First Course in Factor Analysis. Taylor and Francis; 2013. https://doi.org/10.4324/9781315827506
- Stewart A, Markfell-Jones M, Olds T, Ridder H. Protocolo Internacional para la valoración antropométrica. Isak. 2011;82:1–117.
- Naser AM, He FJ, Rahman M, Venkat Narayan KM, Campbell NRC. Urinary Sodium Excretion and Blood Pressure Relationship across Methods of Evaluating the Completeness of 24-h Urine Collections. Nutrients. 2020;12(3):2772. https://doi.org/10.3390/nu12092772
- Akoglu H. User’s guide to correlation coefficients. Turk J Emerg Med. https://doi.org/10.1016/j.tjem.2018.08.001
- Koo TK, Li MY. A guideline of selecting and reporting intraclass correlation coefficients for reliability research. J Chiropr Med. 2016;15 (2):155-163. https://doi.org/10.1016/j.jcm.2016.02.012
- Hove D ten, Jorgensen TD, van der Ark LA. Updated guidelines on selecting an intraclass correlation coefficient for interrater reliability, with applications to incomplete observational designs. Psychol Methods. 2024;29(5): 967-979. https://doi.org/10.1037/met0000516
- Eckel RH, Jakicic JM, Ard JD, de Jesus JM, Houston Miller N, Hubbard VS, et al. 2013 AHA/ACC guideline on Lifestyle management to reduce rardiovascular risk: a report of the American College of Cardiology/American Heart Association Task Force on Practice Guidelines. J Am Coll Cardiol. 2014;63 (25 Pt B):2960–2984. https://doi.org/10.1016/j.jacc.2013.11.003
- Gallagher D, Heymsfield SB, Heo M, Jebb SA, Murgatroyd PR, Sakamoto Y. Healthy percentage body fat ranges: An approach for developing guidelines based on body mass index. Am J Clin Nutr 2000;72(3):694–701. https://doi.org/10.1093/ajcn/72.3.694
- Gallani MC, Proulx-Belhumeur A, Almeras N, Després JP, Doré M, Giguère JF. Development and Validation of a Salt Food Frequency Questionnaire (FFQ-Na) and a Discretionary Salt Questionnaire (DSQ) for the Evaluation of Salt Intake among French-Canadian Population. Nutrients. 2020;13(1):105. https://doi.org/10.3390/nu13010105
- Aaby D, Siddique J. Effects of differential measurement error in self-reported diet in longitudinal lifestyle intervention studies. Int J Behav Nutr Phys Act. 2021;18: 125 https://doi.org/10.1186/s12966-021-01184-x
- Kipnis V, Midthune D, Freedman LS, Bingham S, Schatzkin A, Subar A, Carroll RJ. Empirical evidence of correlated biases in dietary assessment instruments and its implications. Am J Epidemiol. 2001;153(4):394–403. https://doi.org/10.1093/aje/153.4.394
- Kipnis V, Midthune D, Freedman L, Bingham S, Day NE, Riboli E, Ferrari P, Carroll RJ. Bias in dietary-report instruments and its implications for nutritional epidemiology. Public Health Nutrition. 2002;5(6a):915-923. https://doi.org/10.1079/PHN2002383
- Whitton C, Ramos-García C, Kirkpatrick SI, Healy JD, Dhaliwal SS, Boushey CJ, et al. A Systematic Review Examining Contributors to Misestimation of Food and Beverage Intake Based on Short-Term Self-Report Dietary Assessment Instruments Administered to Adults. Adv Nutr 2022;13 (6):2620–2665. https://doi.org/10.1093/advances/nmac085
- Kelly C, Geaney F, Fitzgerald AP, Browne GM, Perry IJ. Validation of diet and urinary excretion derived estimates of sodium excretion against 24-hurine excretion in a worksite sample. Nutr Metab Cardiovasc Dis 2015;25 (8):771–779. https://doi.org/10.1016/j.numecd.2015.04.010
- Vijay A, Mohan L, Taylor MA, Grove JI, Valdes AM, Aithal GP, et al. The evaluation and use of a food frequency questionnaire among the population in Trivandrum, south Kerala, India. Nutrients. 2020;12 (2): 383. https://doi.org/10.3390/nu12020383
- Jiménez Rodríguez A, Palomo Cobos L, Rodríguez-Martín A, Fernández del Valle P, Novalbos-Ruíz JP. Design of a Nutritional Survey to Detect High Dietary Salt Intakes and Its Usefulness in Primary Care Compared to 24-Hour Urine Sodium Determination. Nutrients. 2023;15 86):1542 https://doi.org/10.3390/nu15061542
- Mason B, Ross L, Gill E, Healy H, Juffs P, Kark A. Development and Validation of a Dietary Screening Tool for High Sodium Consumption in Australian Renal Patients. J Ren Nutr 2014;24 (2):123-134.e3. https://doi.org/10.1053/j.jrn.2013.10.004
- Hosmer DW, Lemeshow S. Applied Logistic Regression. New York: John Wiley & Sons; 2000. https://pzs.dstu.dp.ua/DataMining/mls/bibl/logistic.pdf
- Greiner M, Two-graph receiver operating characteristic (TG-ROC): a Microsoft-EXCEL template for the selection of cut-off values in diagnostic tests. J Immunol Methods. 1995;185 81):145-146. https://doi.org/10.1016/0022-1759(95)00078-O
- Cooper M, Simpson JR, Klutka R. Development and validation of a sodium AnaLysis tool (SALT). Nutr J. 2020, 19 (1):55. https://doi.org/10.1186/s12937-020-00555-7
- Taylor SJC, Carnes D, Homer K, Pincus T., Kahan BC., Hounsome N., et al. Improving the self-management of chronic pain: Coping with persistent Pain, Effectiveness Research in Self-management (COPERS). Programme Grants for Applied Research 2016; 4 (14): Appendix 3, Clinimetric study of outcome measures. https://doi.org/10.3310/pgfar04140
- Cruz-Avelar A, Sinaí Cruz-Peralta E. Metodología para la construcción de instrumentos de medición en salud. Artículo de Revisión 2017;26(3):100–105. https://www.medigraphic.com/pdfs/alergia/al-2017/al173d.pdf
- Colín-Ramírez E, Espinosa-Cuevas Á, Miranda-Alatriste P, Tovar-Villegas V, Arcand J, Correa-Rotter R. Food Sources of Sodium Intake in an Adult Mexican Population: A Sub-Analysis of the SALMEX Study. Nutrients. 2017;9(8):810. https://doi.org/10.3390/nu908081